GMS location: 719
Random forest results
| names |
period |
power |
significance |
meanSquareError |
absError |
maxError |
CRPS |
IGN |
| baseline |
winter 2016 |
1.000 |
0.000e+00 |
0.328 |
0.402 |
2.400 |
NaN |
NaN |
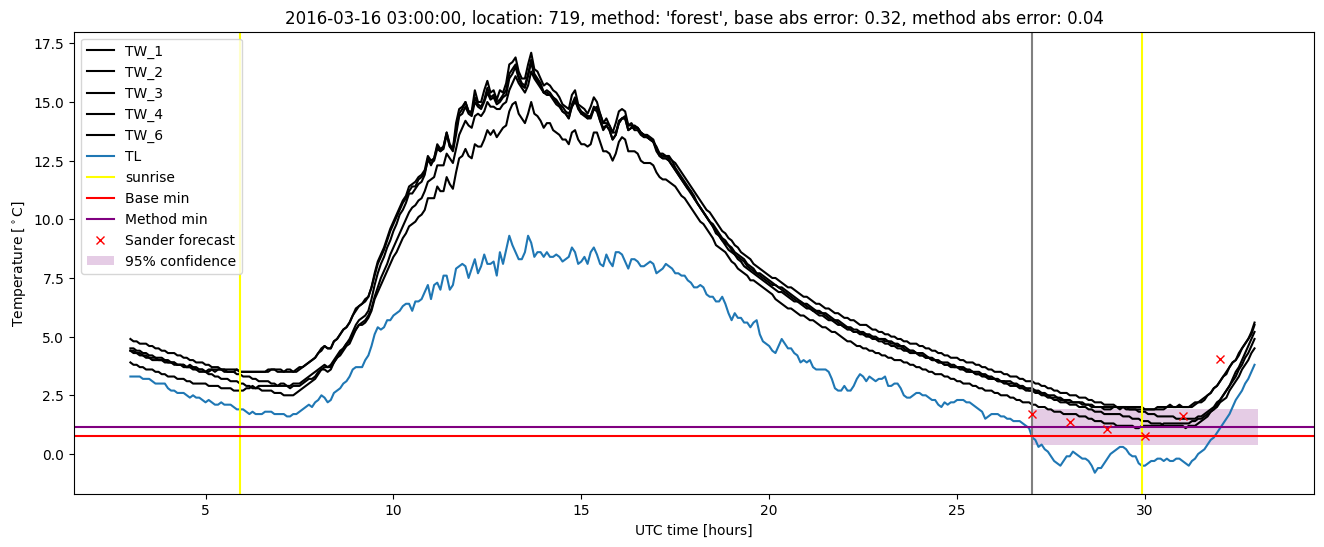
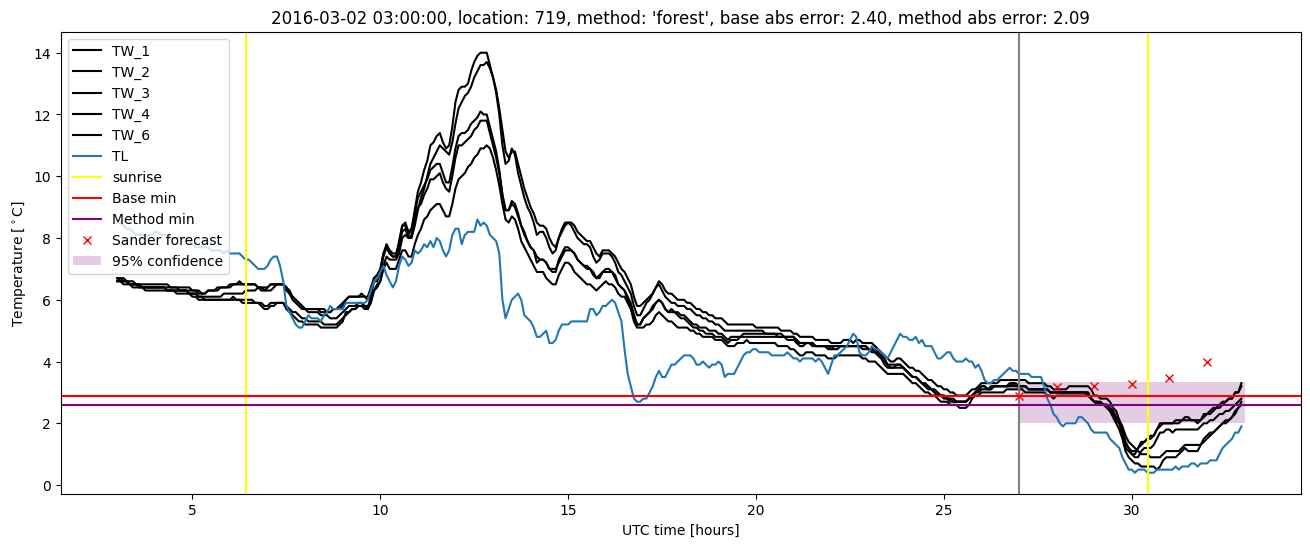
| forest |
winter 2016 |
1.000 |
0.133 |
0.286 |
0.391 |
2.092 |
0.449 |
2.933 |
| baseline |
winter 2017 |
0.984 |
0.154 |
0.465 |
0.488 |
2.501 |
NaN |
NaN |
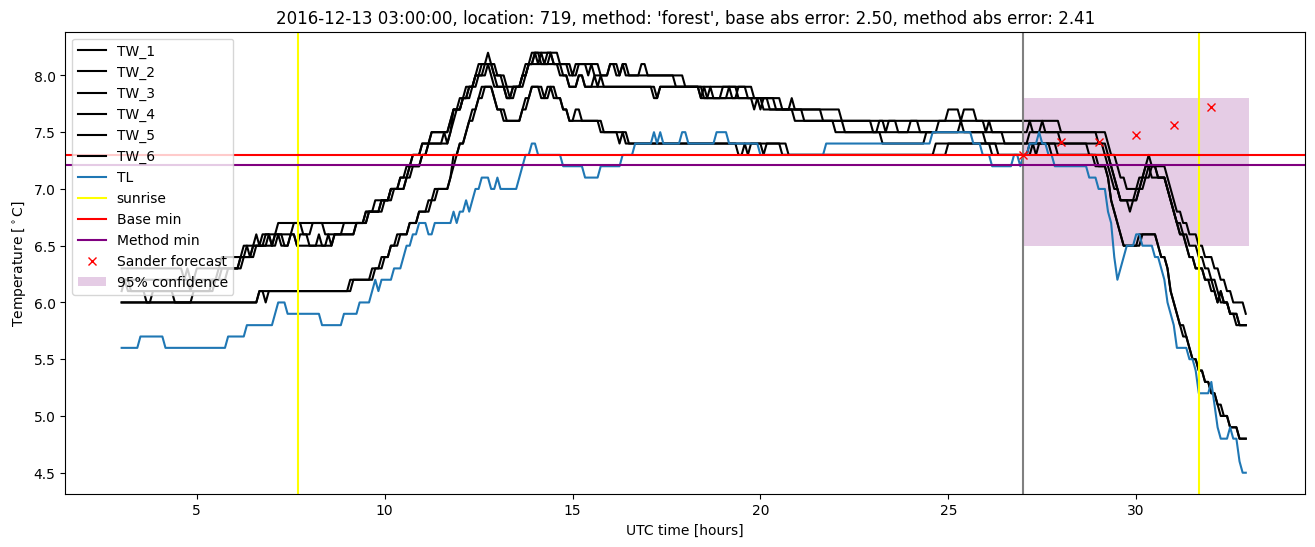
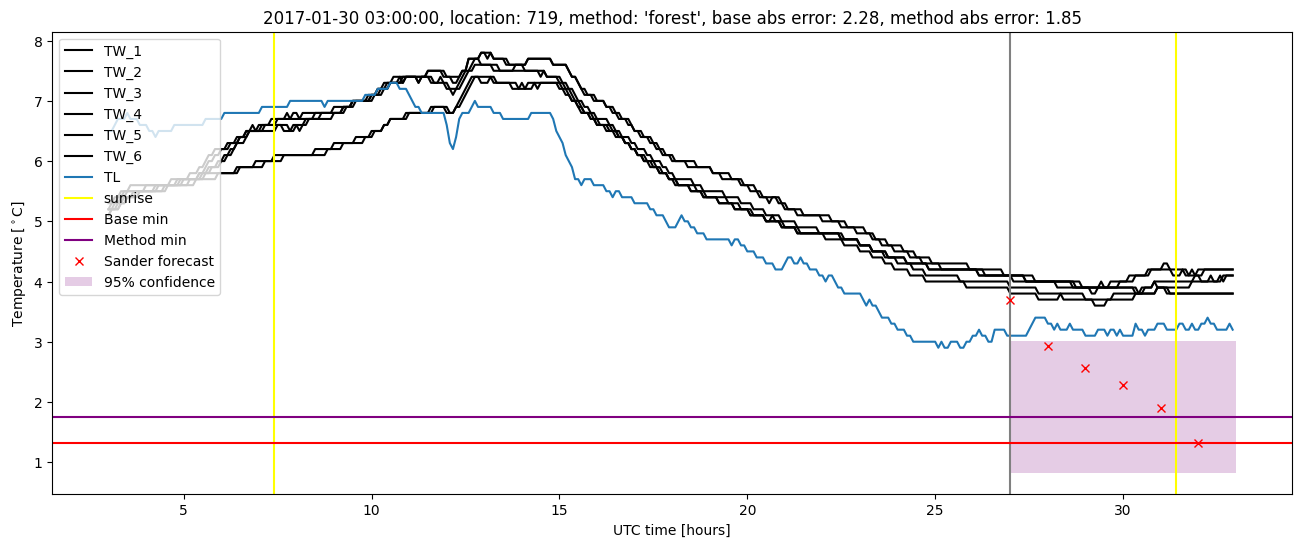
| forest |
winter 2017 |
0.984 |
0.154 |
0.346 |
0.423 |
2.411 |
0.458 |
3.453 |
| baseline |
winter 2018 |
0.972 |
0.250 |
0.311 |
0.422 |
1.700 |
NaN |
NaN |
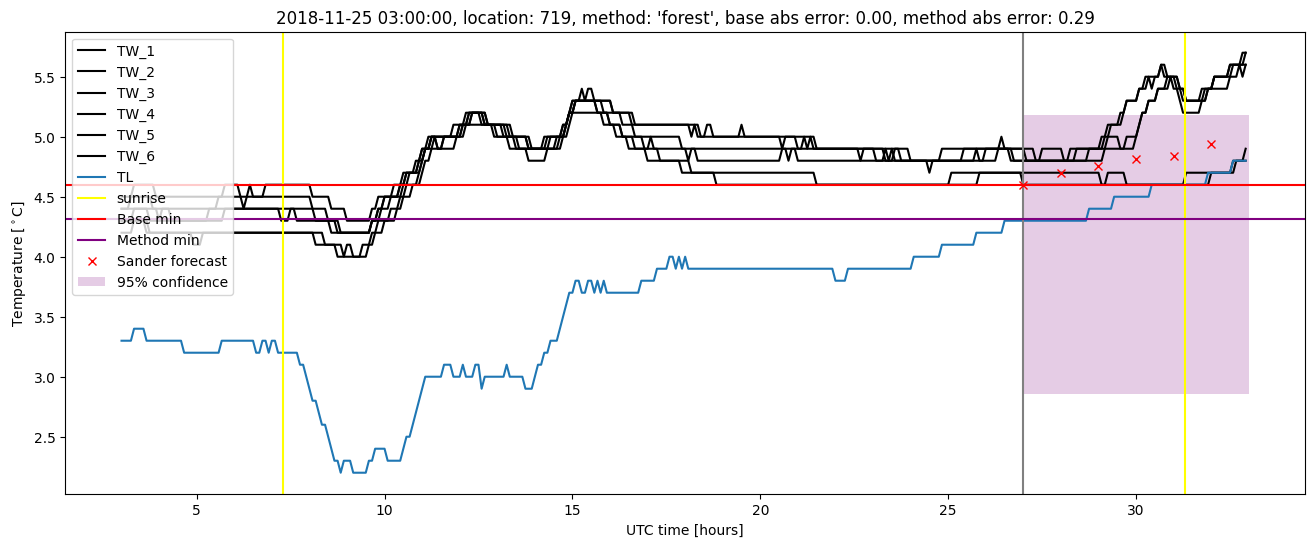
| forest |
winter 2018 |
0.979 |
0.167 |
0.241 |
0.374 |
1.442 |
0.446 |
2.279 |
| baseline |
winter 2019 |
0.980 |
0.000e+00 |
0.291 |
0.402 |
1.956 |
NaN |
NaN |
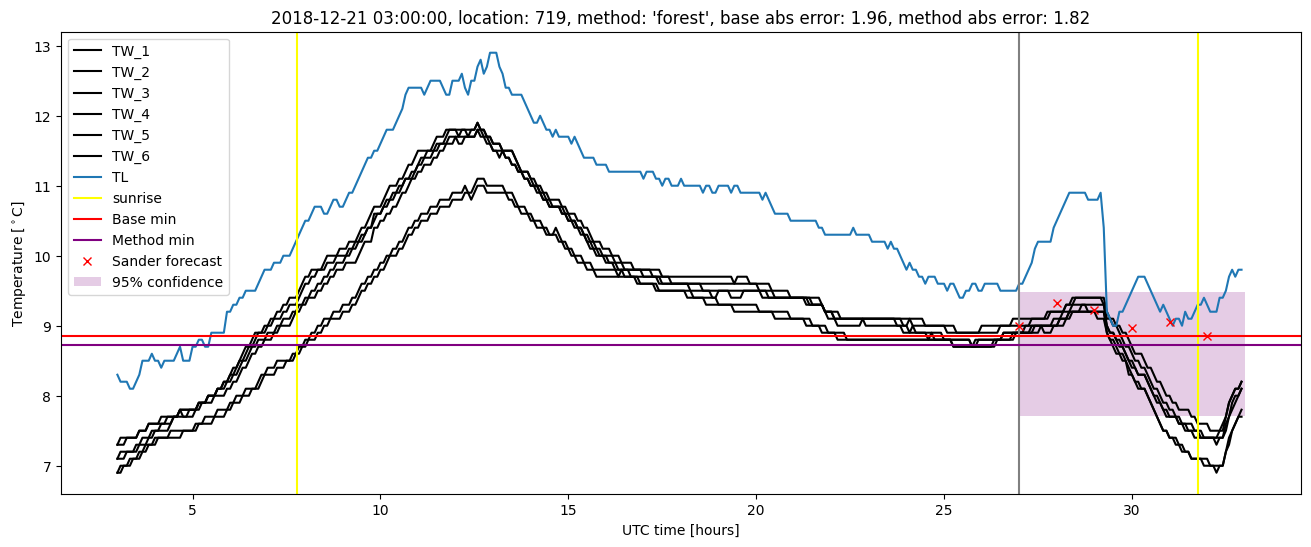
| forest |
winter 2019 |
0.993 |
0.000e+00 |
0.228 |
0.356 |
1.819 |
0.431 |
2.350 |
| baseline |
all |
0.985 |
0.109 |
0.346 |
0.426 |
2.501 |
NaN |
NaN |
| forest |
all |
0.990 |
0.125 |
0.275 |
0.386 |
2.411 |
0.446 |
2.760 |
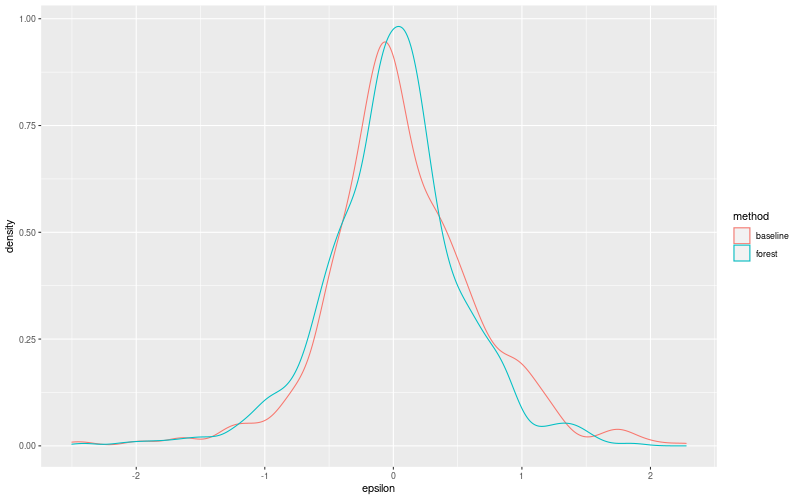
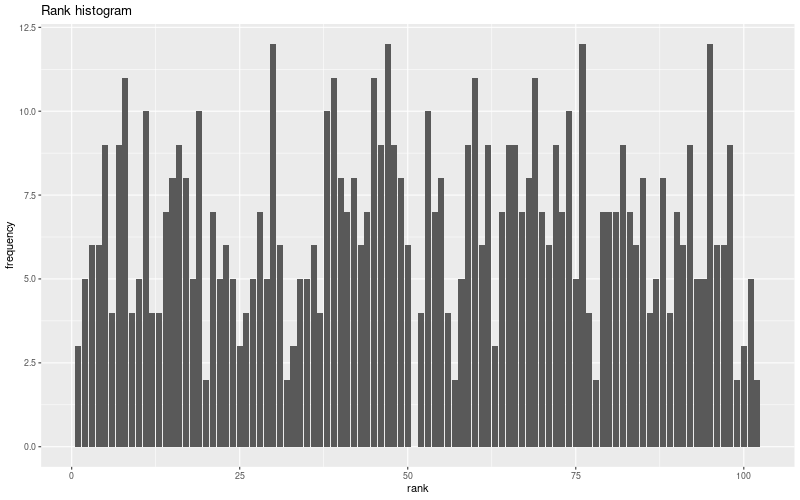
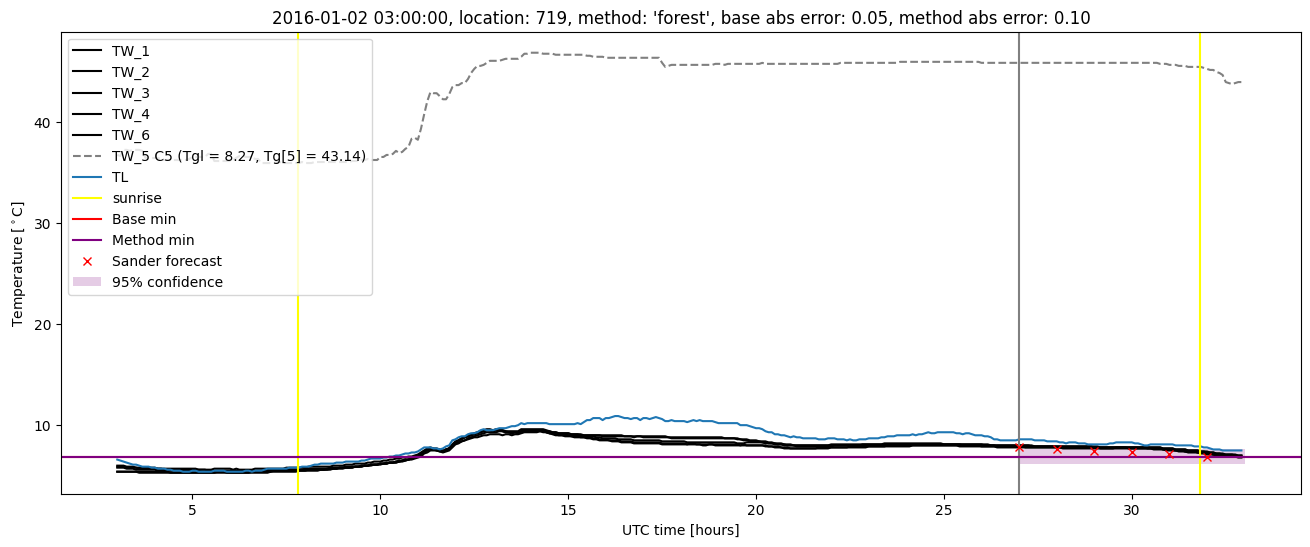
Random forest plots

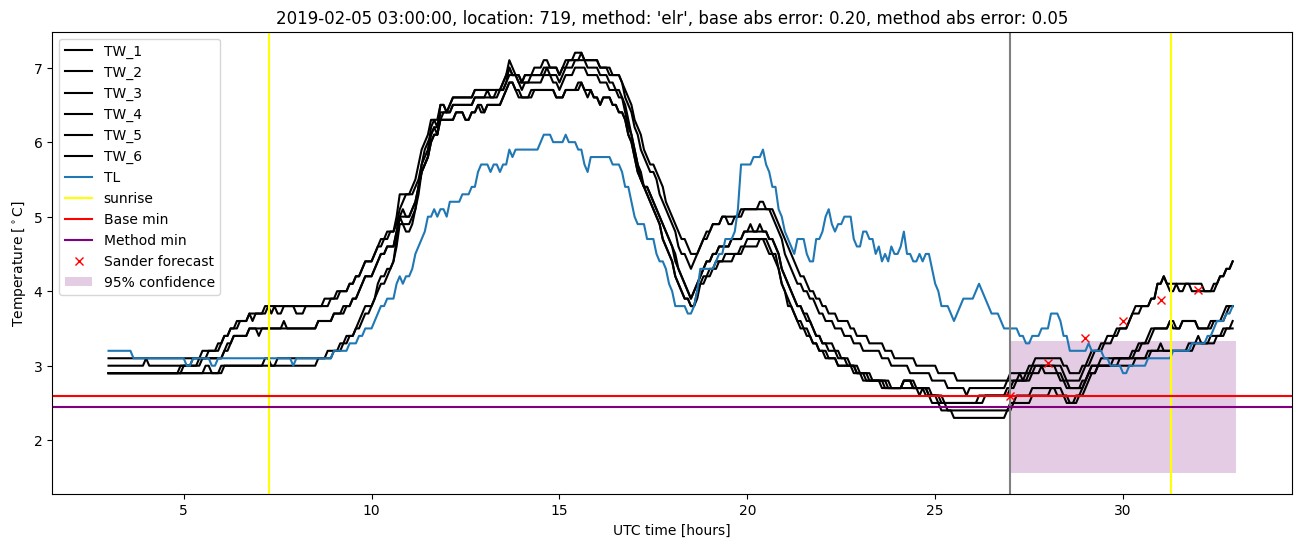
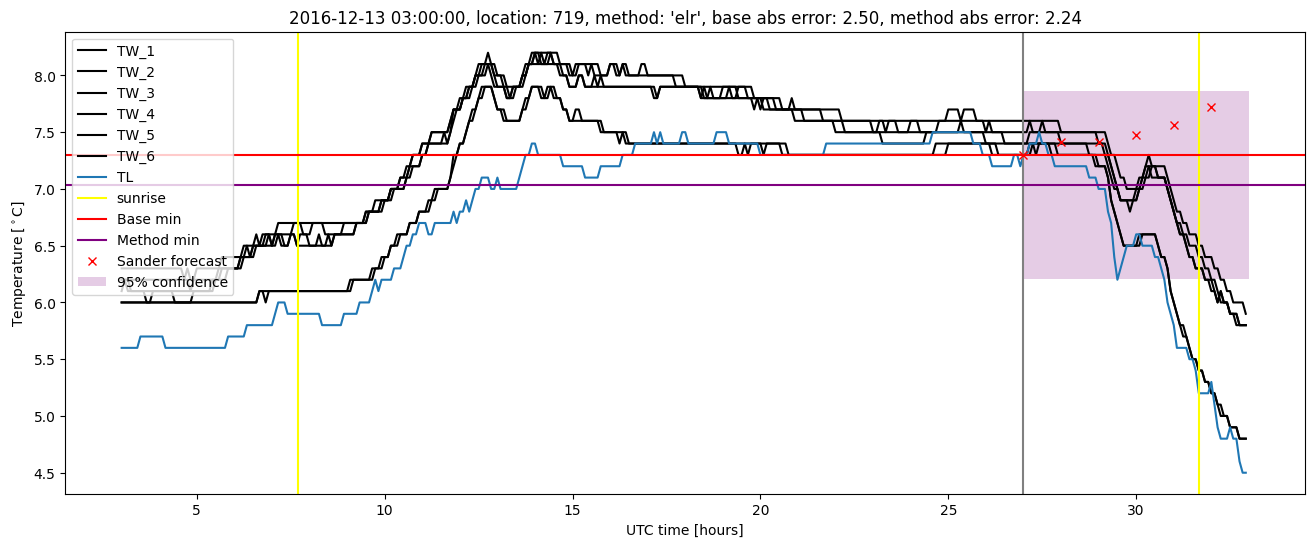
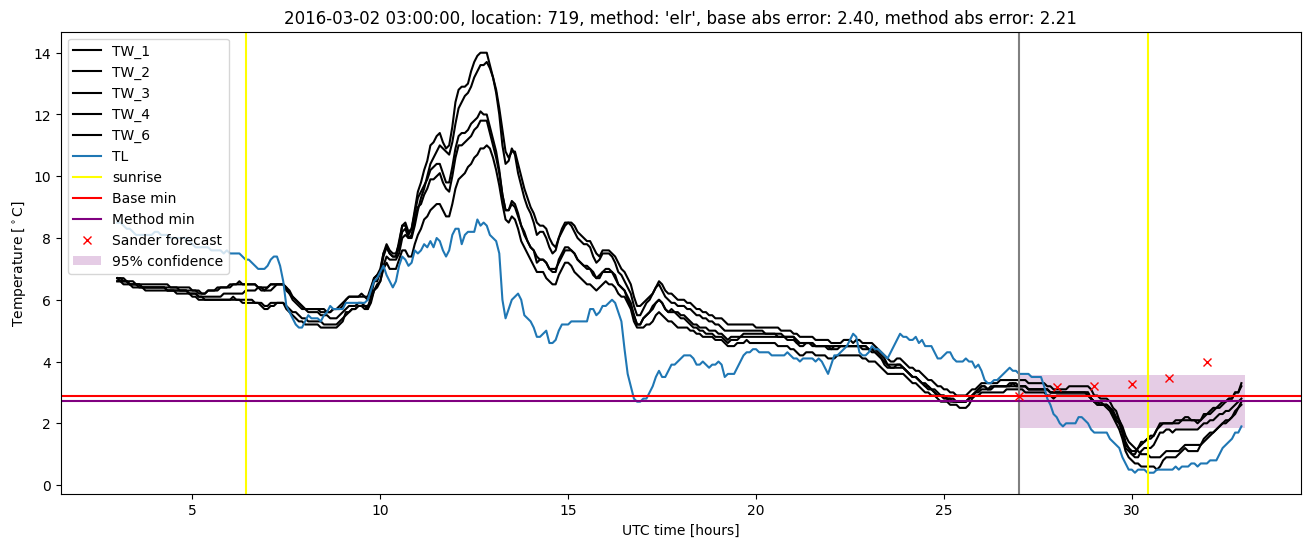
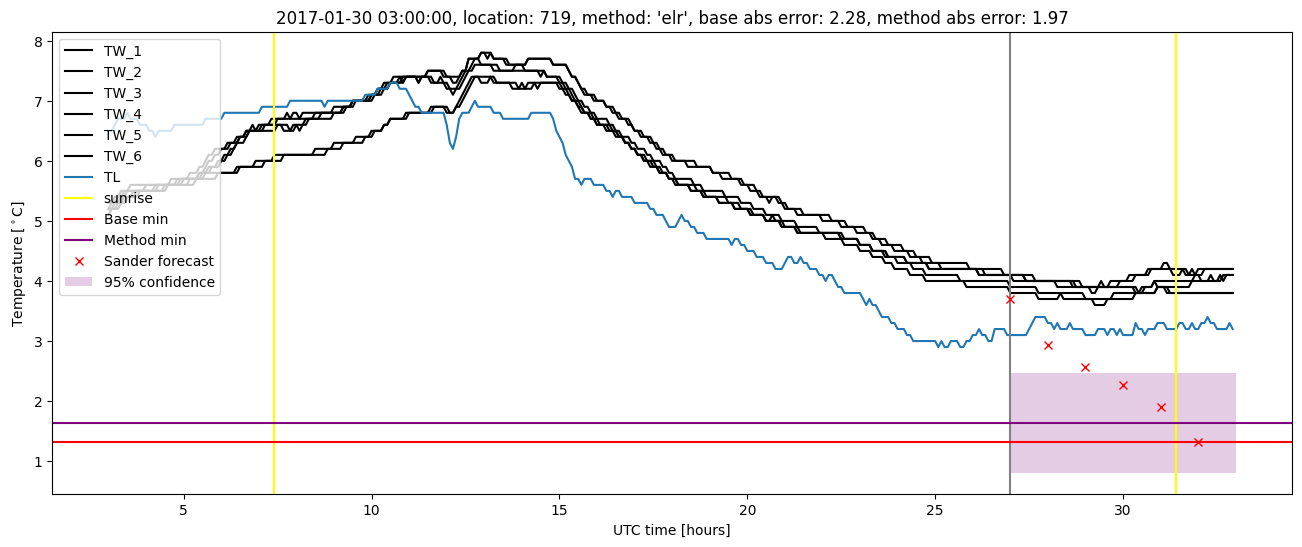
Extended logistic regression results
| names |
period |
power |
significance |
meanSquareError |
absError |
maxError |
CRPS |
IGN |
| baseline |
winter 2016 |
1.000 |
0.000e+00 |
0.328 |
0.402 |
2.400 |
NaN |
NaN |
| elr |
winter 2016 |
1.000 |
0.067 |
0.276 |
0.384 |
2.207 |
0.498 |
3.886 |
| baseline |
winter 2017 |
0.984 |
0.154 |
0.465 |
0.488 |
2.501 |
NaN |
NaN |
| elr |
winter 2017 |
0.976 |
0.154 |
0.355 |
0.447 |
2.238 |
0.520 |
5.013 |
| baseline |
winter 2018 |
0.972 |
0.250 |
0.311 |
0.422 |
1.700 |
NaN |
NaN |
| elr |
winter 2018 |
0.972 |
0.250 |
0.260 |
0.394 |
1.571 |
0.492 |
3.401 |
| baseline |
winter 2019 |
0.980 |
0.000e+00 |
0.291 |
0.402 |
1.956 |
NaN |
NaN |
| elr |
winter 2019 |
0.986 |
0.000e+00 |
0.247 |
0.381 |
1.530 |
0.491 |
3.424 |
| baseline |
all |
0.985 |
0.109 |
0.346 |
0.426 |
2.501 |
NaN |
NaN |
| elr |
all |
0.985 |
0.125 |
0.283 |
0.400 |
2.238 |
0.500 |
3.917 |
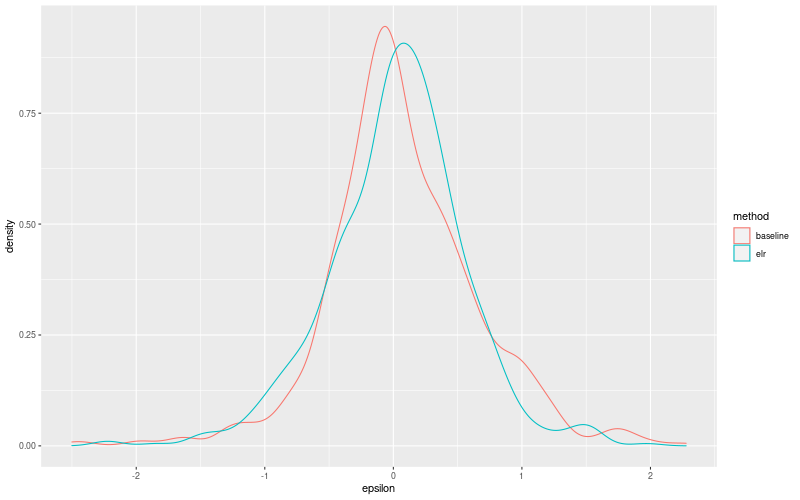
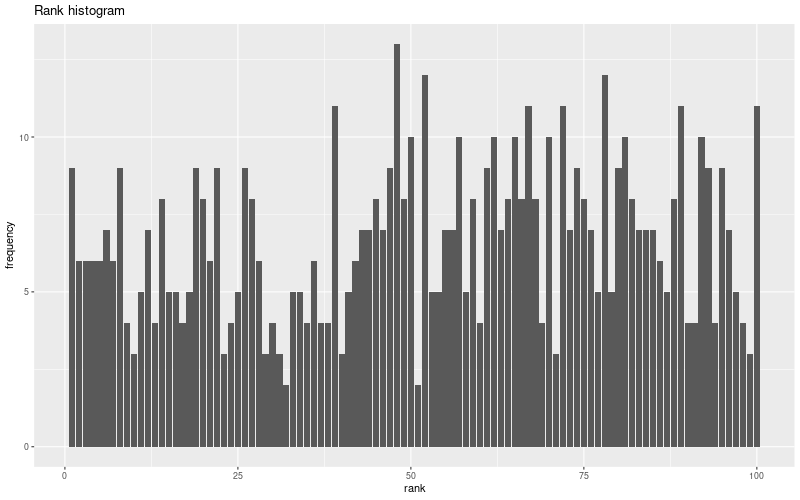
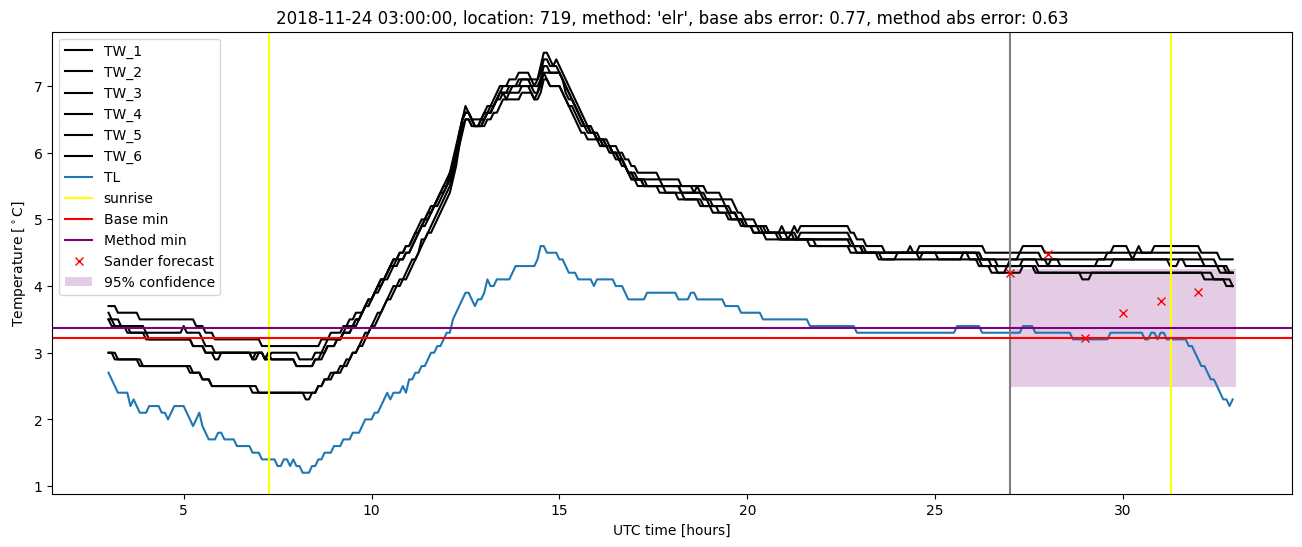
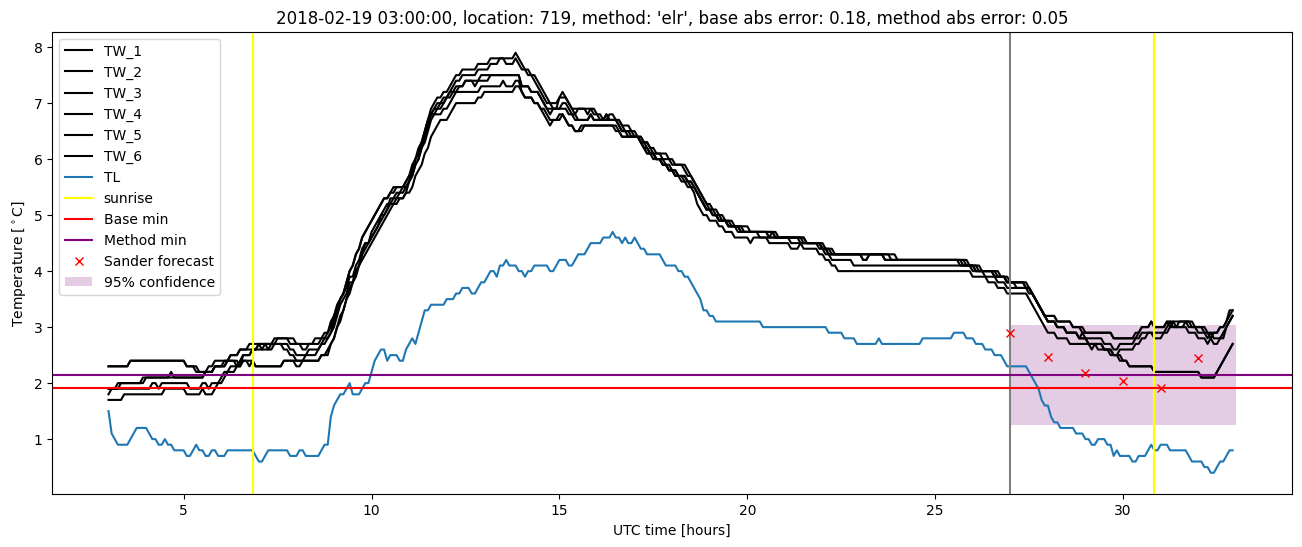
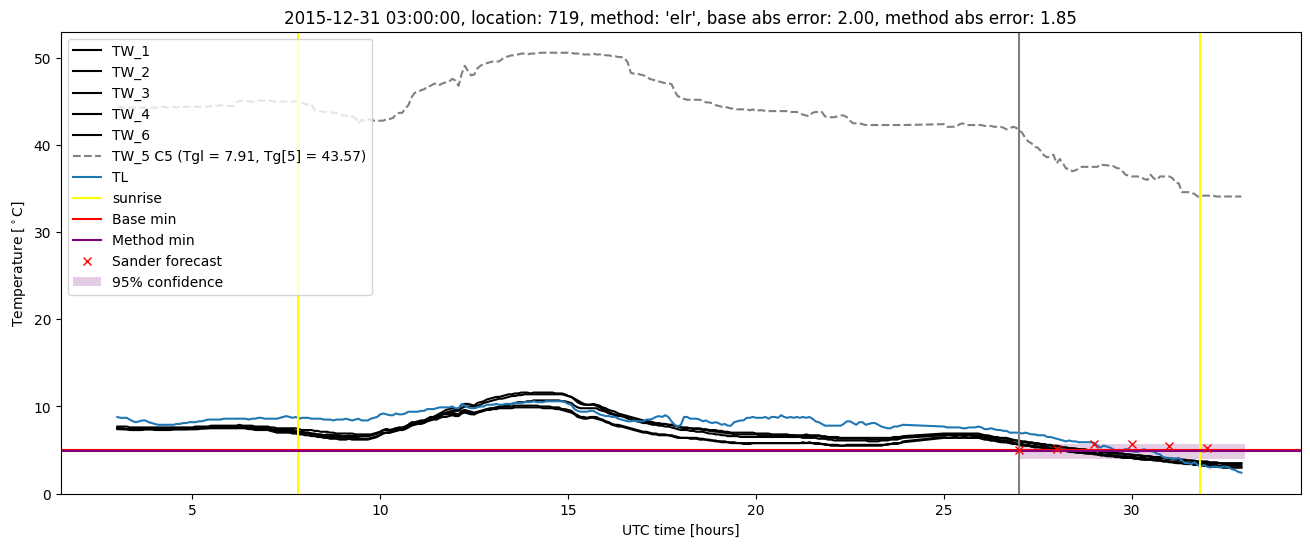
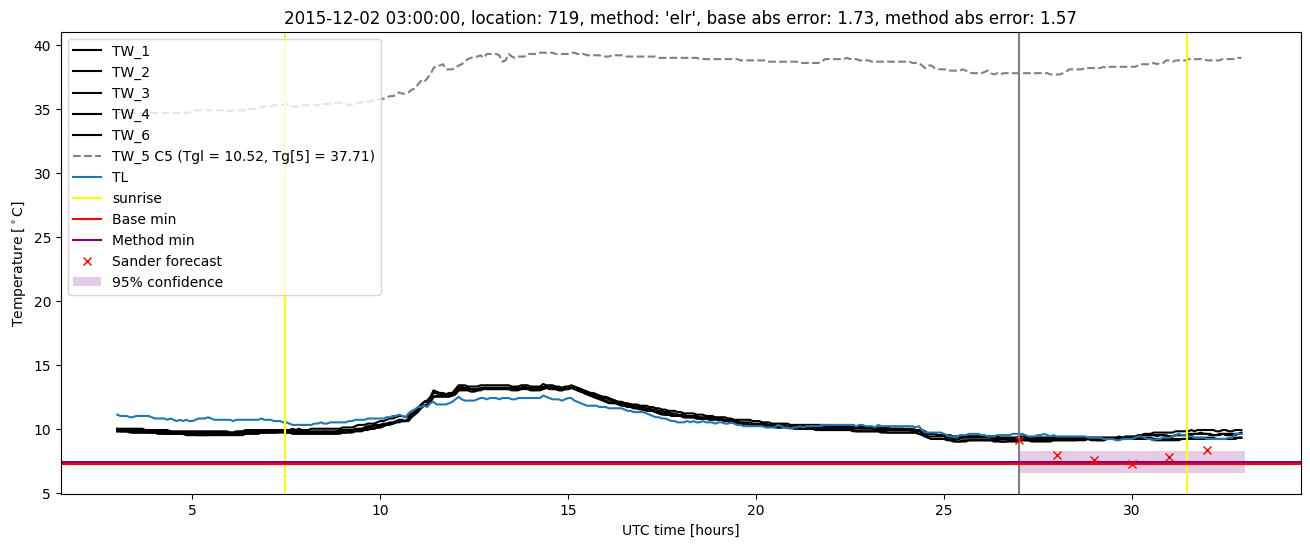
Extended logistic regression plots