GMS location: 718
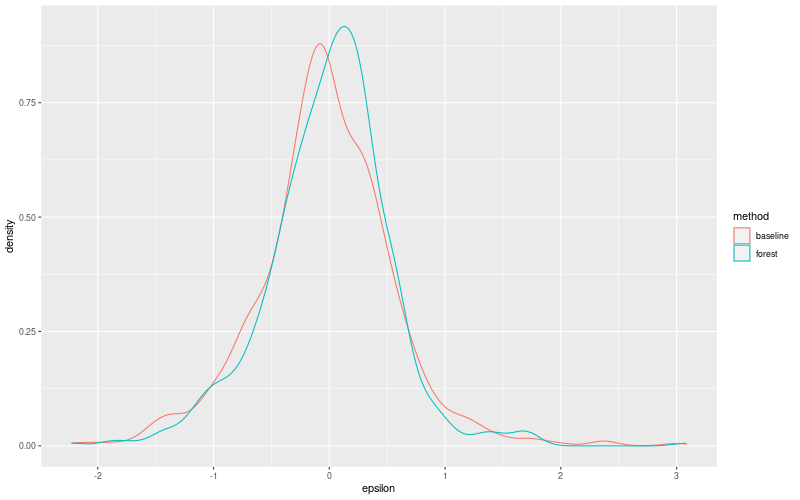
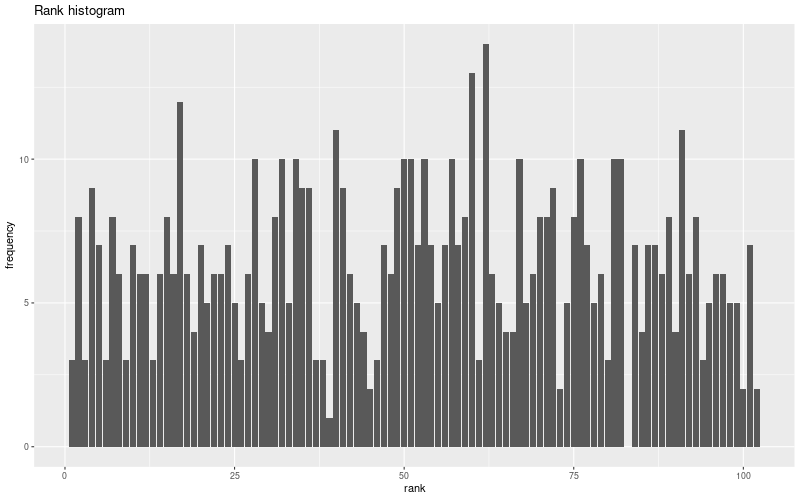
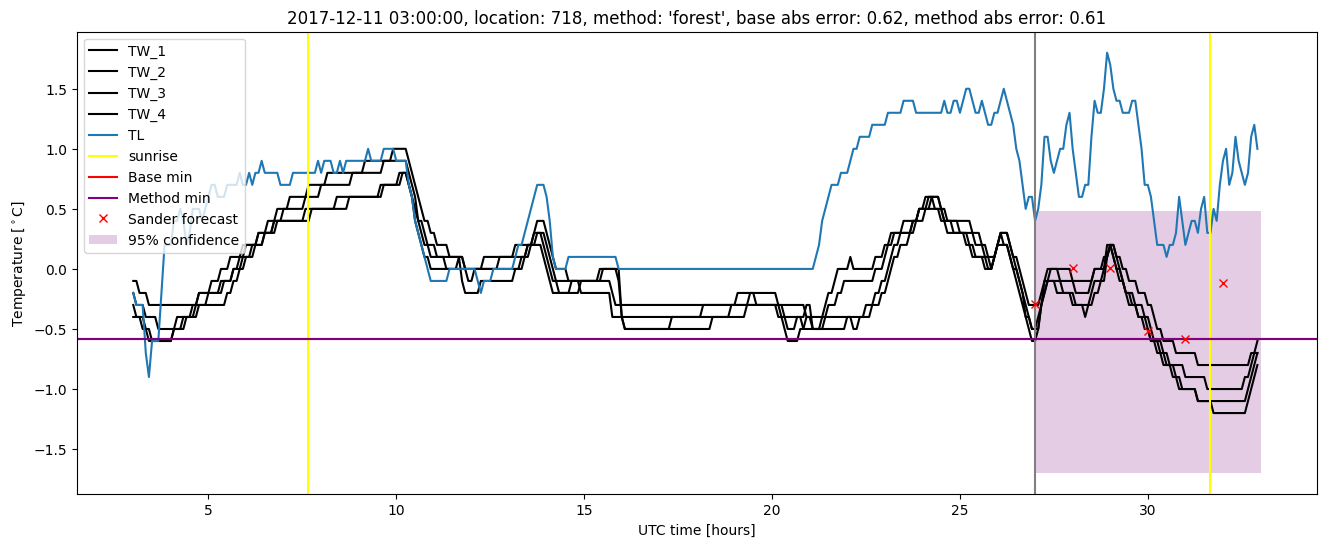
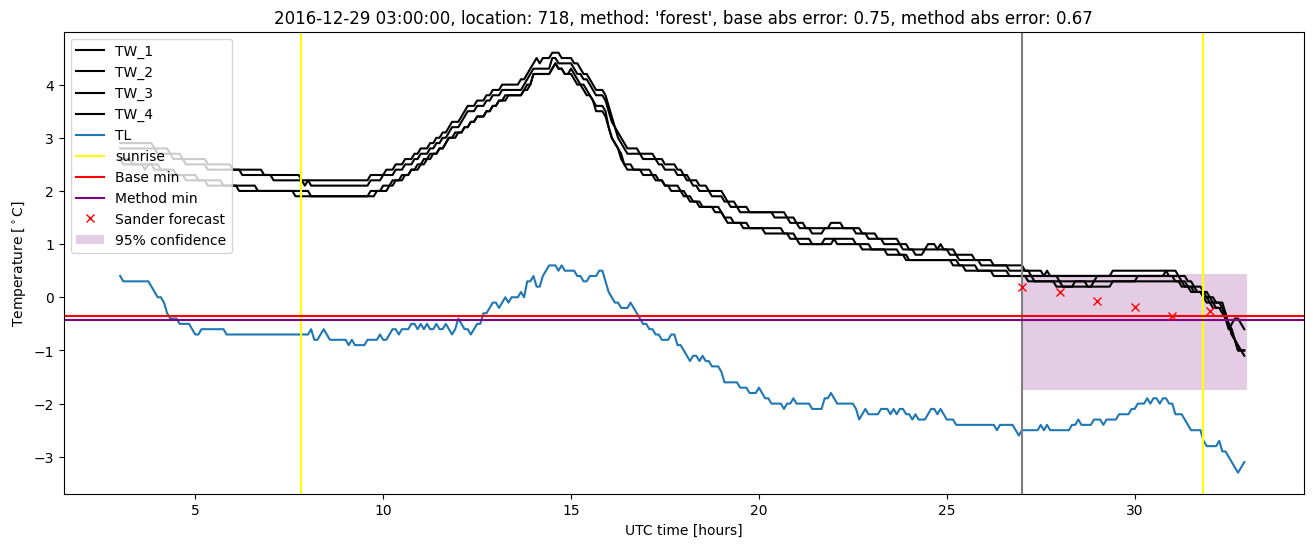
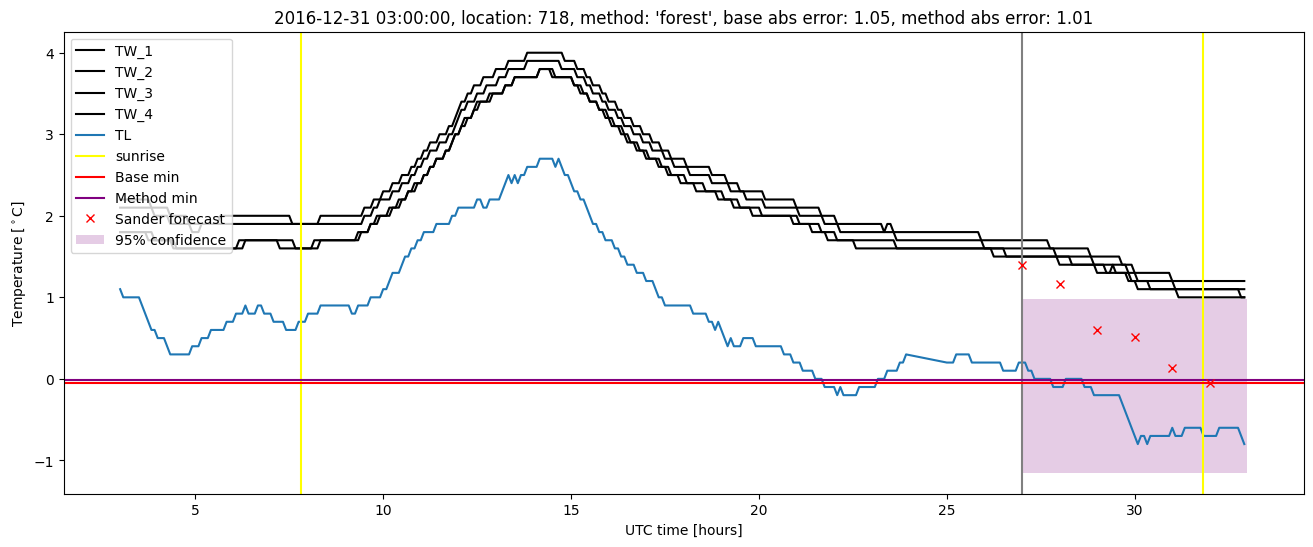
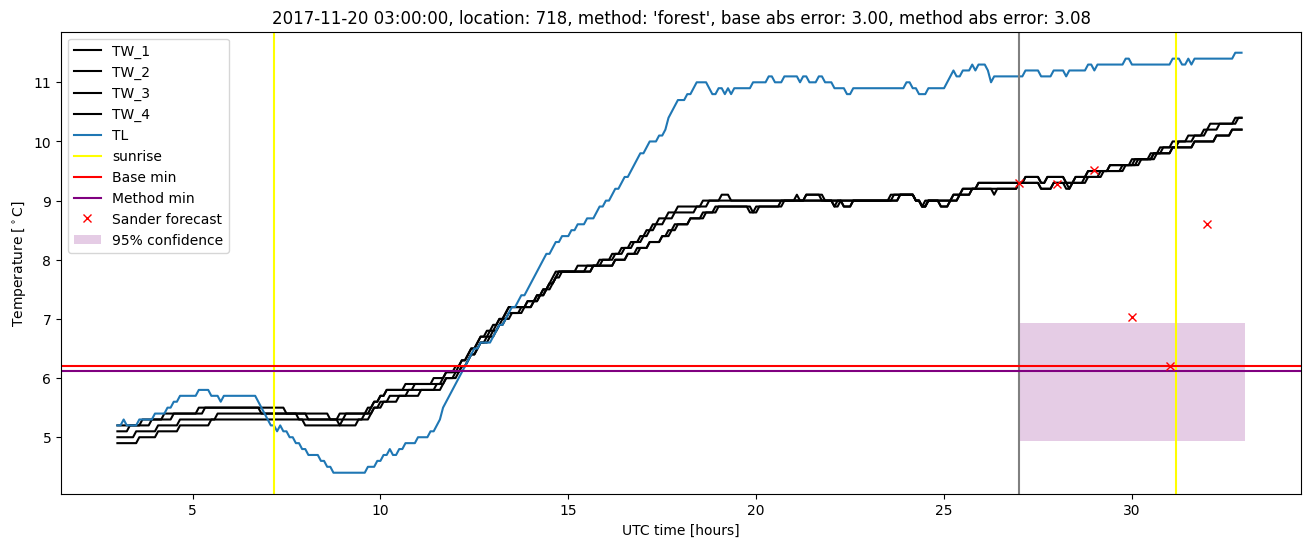
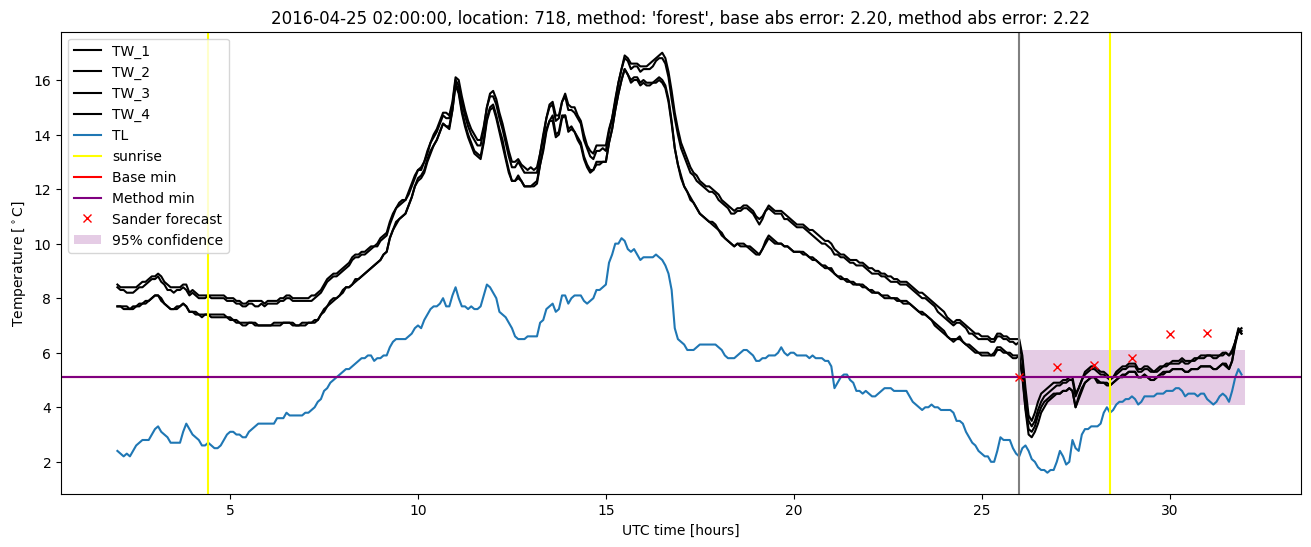
Random forest results
| names |
period |
power |
significance |
meanSquareError |
absError |
maxError |
CRPS |
IGN |
| baseline |
winter 2016 |
1.000 |
0.000e+00 |
0.359 |
0.427 |
2.200 |
NaN |
NaN |
| forest |
winter 2016 |
1.000 |
0.000e+00 |
0.318 |
0.403 |
2.223 |
0.488 |
3.009 |
| baseline |
winter 2017 |
0.966 |
0.121 |
0.327 |
0.417 |
2.386 |
NaN |
NaN |
| forest |
winter 2017 |
0.966 |
0.091 |
0.255 |
0.378 |
1.910 |
0.483 |
2.768 |
| baseline |
winter 2018 |
0.993 |
0.083 |
0.397 |
0.486 |
2.997 |
NaN |
NaN |
| forest |
winter 2018 |
1.000 |
0.083 |
0.338 |
0.441 |
3.082 |
0.483 |
2.861 |
| baseline |
winter 2019 |
0.984 |
0.000e+00 |
0.292 |
0.390 |
2.354 |
NaN |
NaN |
| forest |
winter 2019 |
0.984 |
0.000e+00 |
0.233 |
0.354 |
1.749 |
0.484 |
2.284 |
| baseline |
all |
0.988 |
0.078 |
0.348 |
0.432 |
2.997 |
NaN |
NaN |
| forest |
all |
0.990 |
0.065 |
0.291 |
0.397 |
3.082 |
0.485 |
2.772 |
Random forest plots
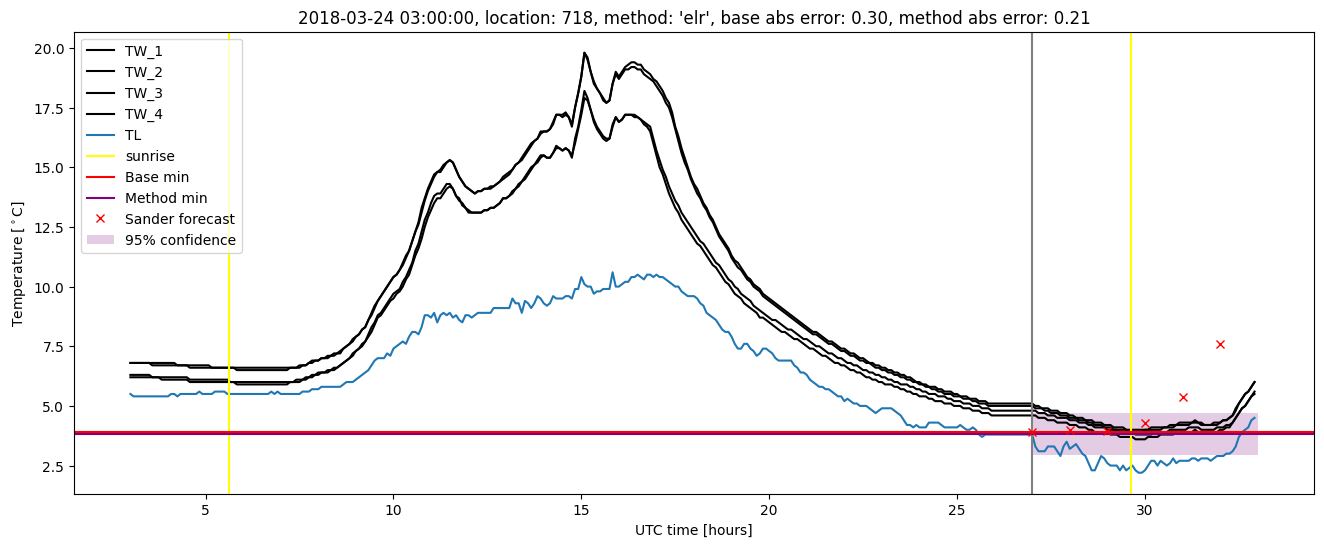
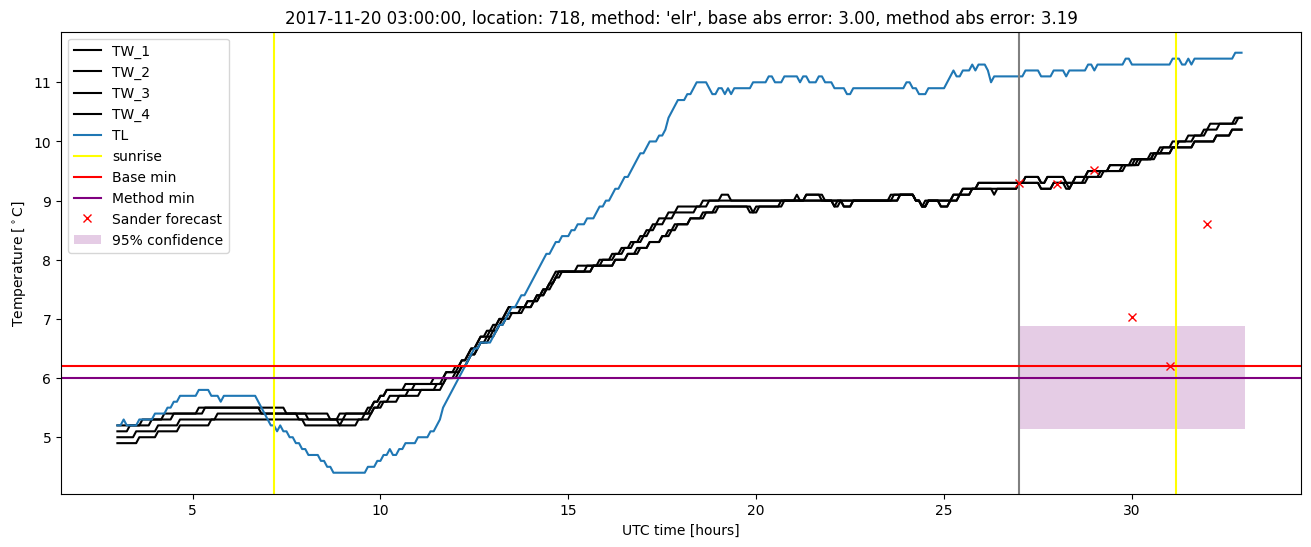
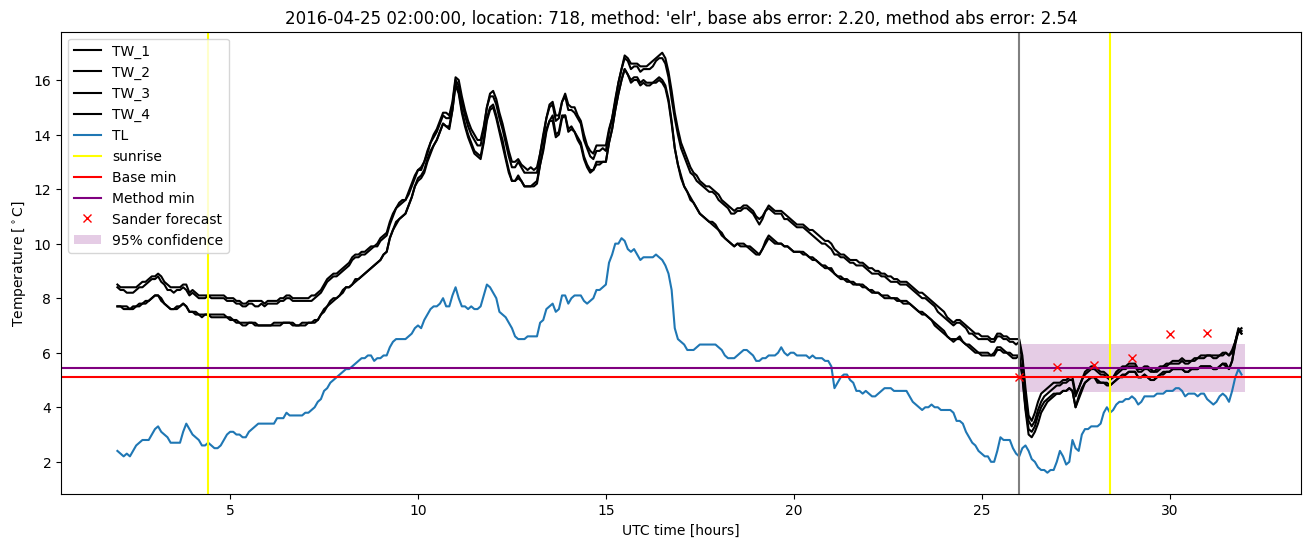
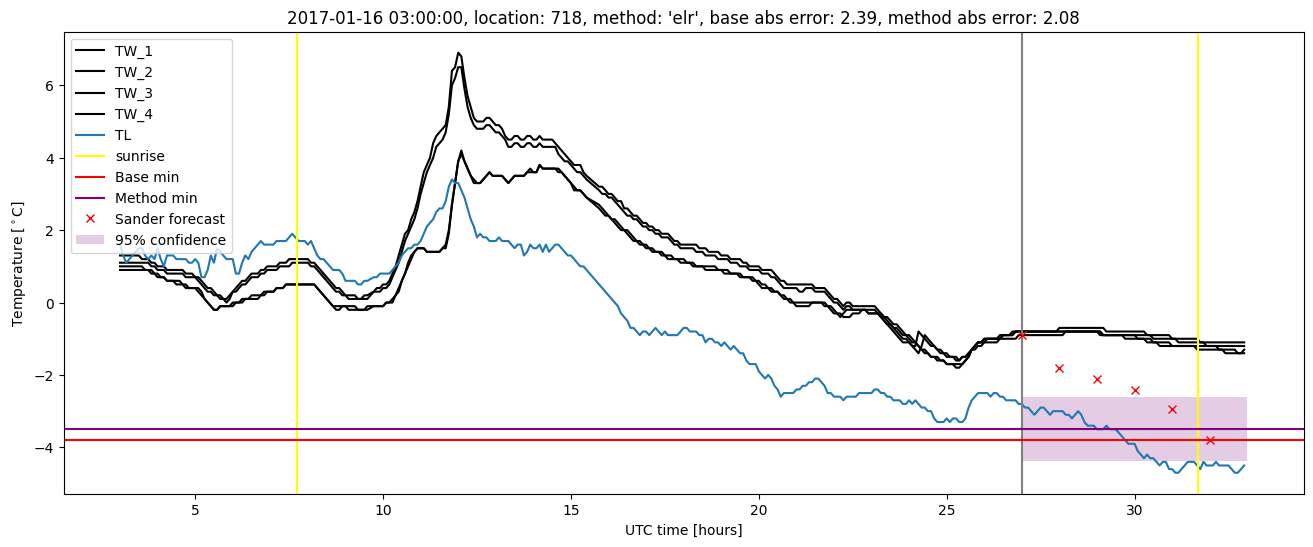
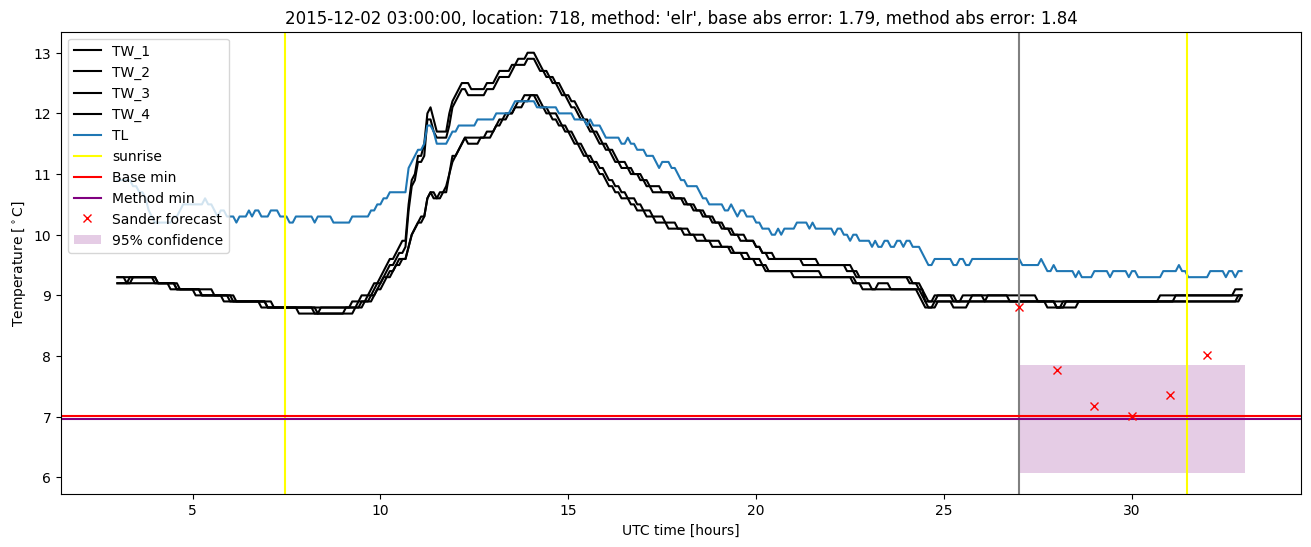
Extended logistic regression results
| names |
period |
power |
significance |
meanSquareError |
absError |
maxError |
CRPS |
IGN |
| baseline |
winter 2016 |
1.000 |
0.000e+00 |
0.359 |
0.427 |
2.200 |
NaN |
NaN |
| elr |
winter 2016 |
1.000 |
0.077 |
0.368 |
0.437 |
2.536 |
0.528 |
4.055 |
| baseline |
winter 2017 |
0.966 |
0.121 |
0.327 |
0.417 |
2.386 |
NaN |
NaN |
| elr |
winter 2017 |
0.958 |
0.091 |
0.305 |
0.424 |
2.082 |
0.565 |
4.639 |
| baseline |
winter 2018 |
0.993 |
0.083 |
0.397 |
0.486 |
2.997 |
NaN |
NaN |
| elr |
winter 2018 |
1.000 |
0.083 |
0.381 |
0.481 |
3.191 |
0.537 |
4.298 |
| baseline |
winter 2019 |
0.984 |
0.000e+00 |
0.292 |
0.390 |
2.354 |
NaN |
NaN |
| elr |
winter 2019 |
0.984 |
0.000e+00 |
0.241 |
0.367 |
1.735 |
0.501 |
3.082 |
| baseline |
all |
0.988 |
0.078 |
0.348 |
0.432 |
2.997 |
NaN |
NaN |
| elr |
all |
0.988 |
0.078 |
0.331 |
0.431 |
3.191 |
0.534 |
4.062 |
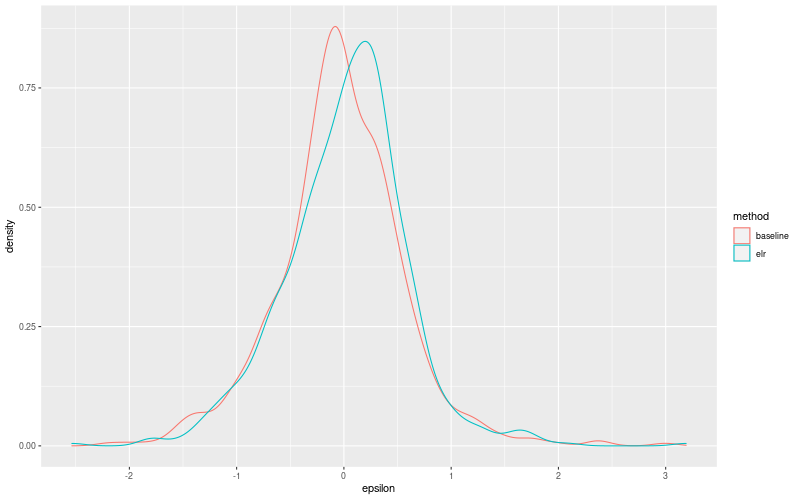
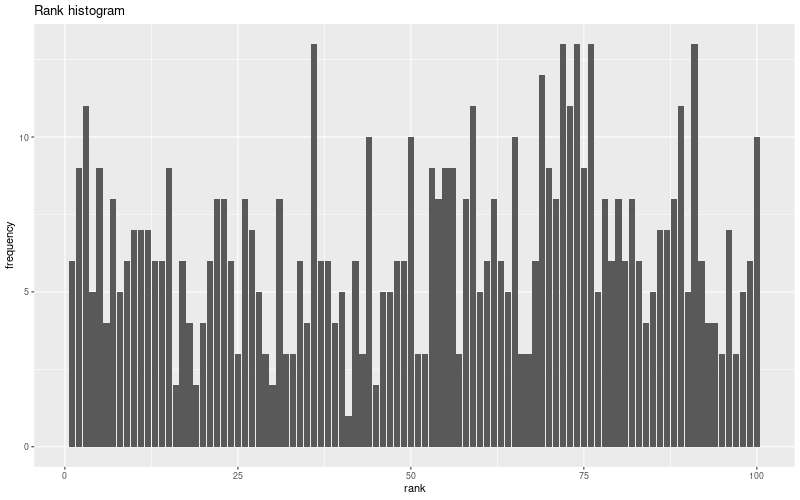
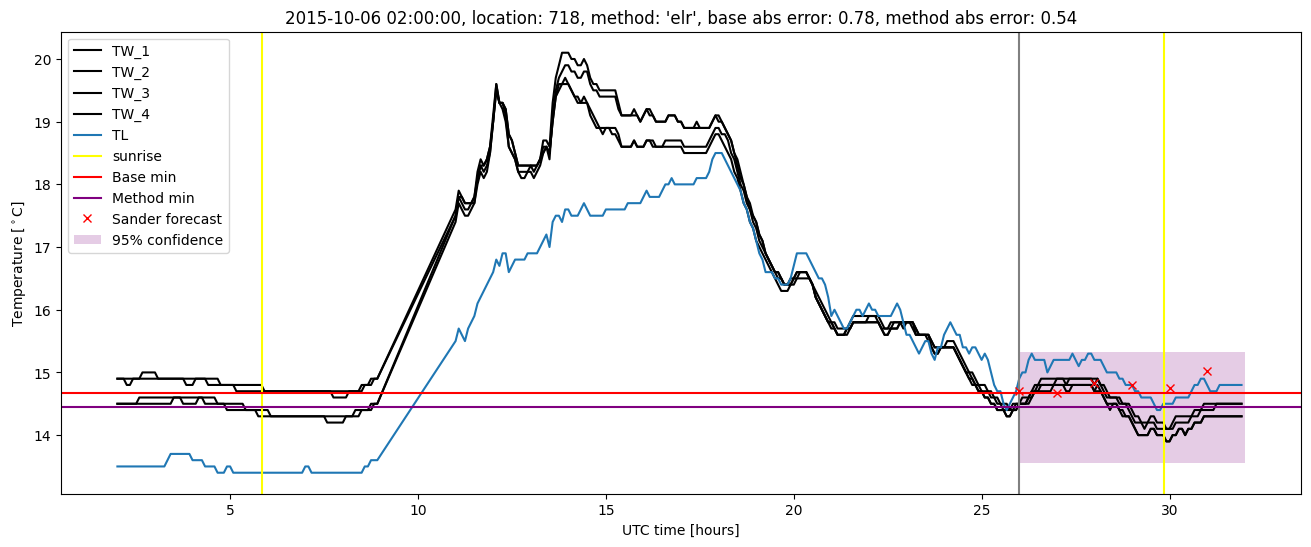
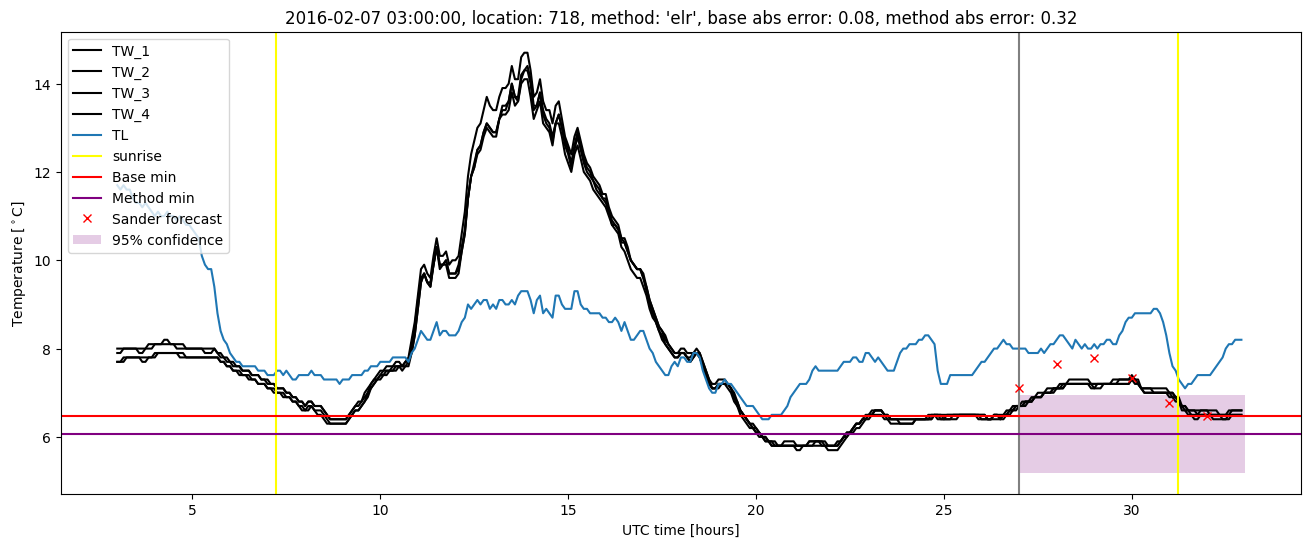
Extended logistic regression plots