GMS location: 717
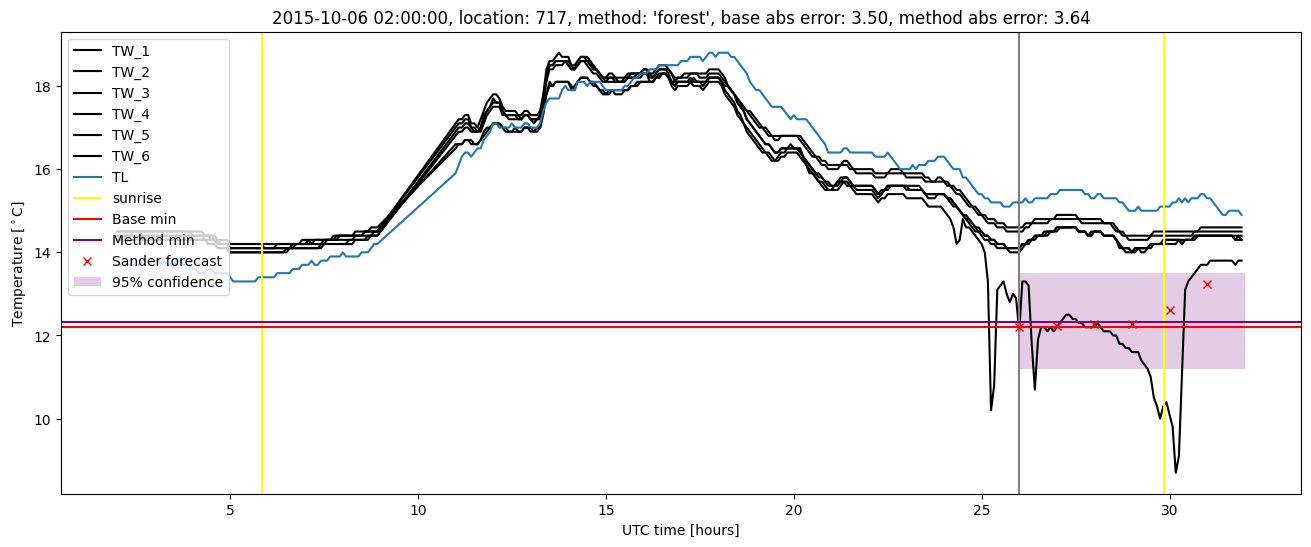
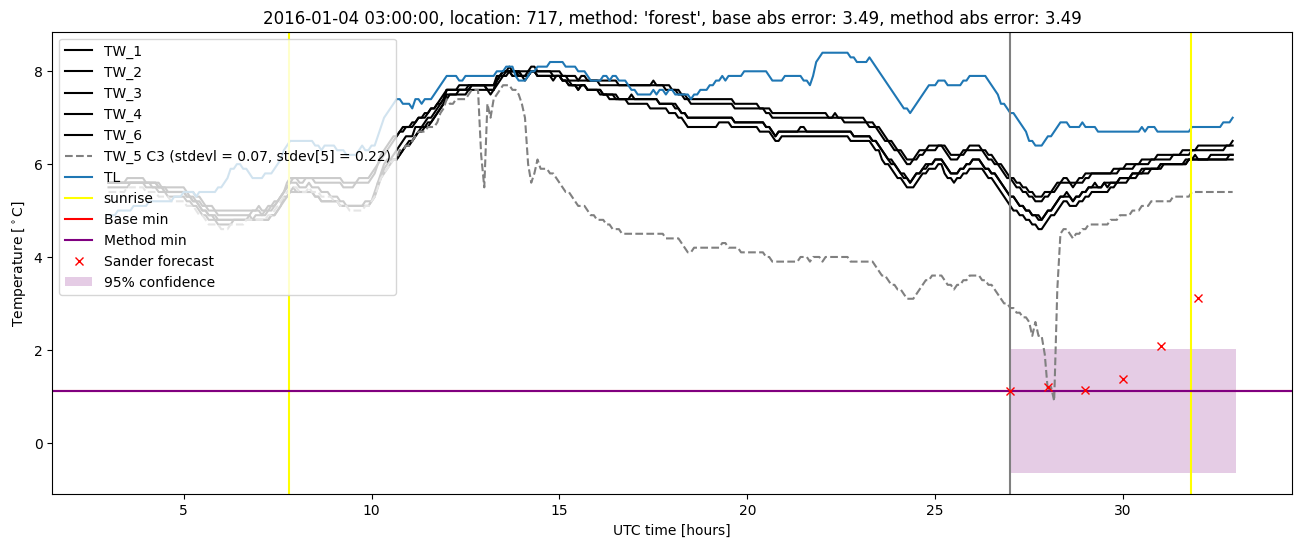
Random forest results
| names |
period |
power |
significance |
meanSquareError |
absError |
maxError |
CRPS |
IGN |
| baseline |
winter 2016 |
0.994 |
0.150 |
0.764 |
0.593 |
3.503 |
NaN |
NaN |
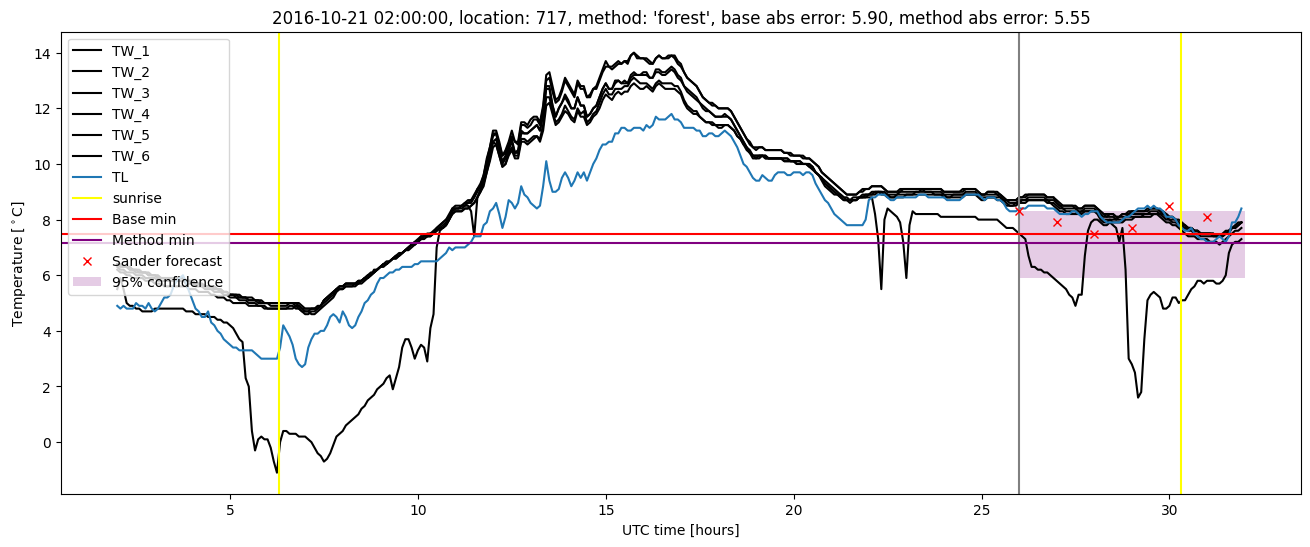
| forest |
winter 2016 |
0.981 |
0.200 |
0.741 |
0.572 |
3.636 |
0.452 |
1.592 |
| baseline |
winter 2017 |
0.968 |
0.111 |
0.802 |
0.546 |
5.899 |
NaN |
NaN |
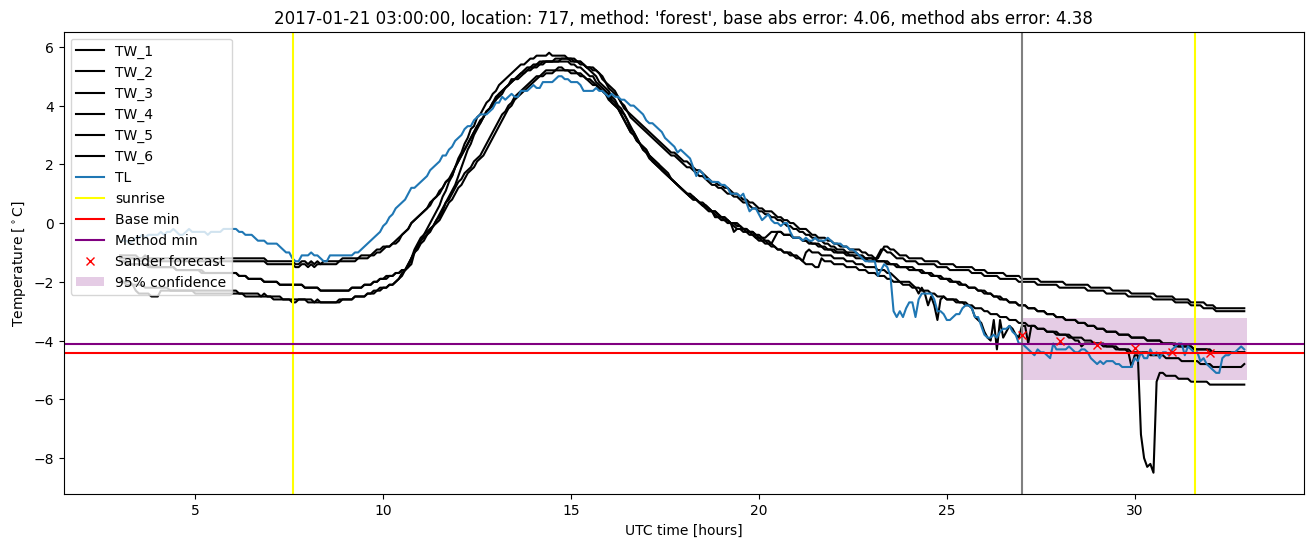
| forest |
winter 2017 |
0.984 |
0.111 |
0.723 |
0.499 |
5.552 |
0.450 |
1.482 |
| baseline |
winter 2018 |
1.000 |
0.000e+00 |
0.397 |
0.488 |
1.455 |
NaN |
NaN |
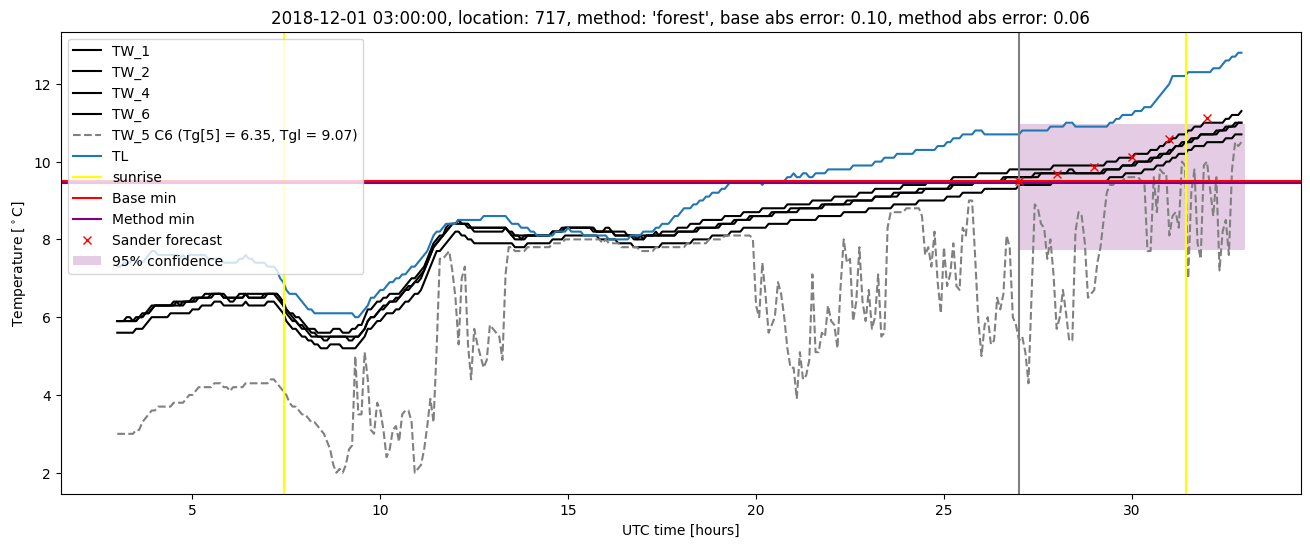
| forest |
winter 2018 |
1.000 |
0.000e+00 |
0.287 |
0.389 |
1.579 |
0.410 |
1.218 |
| baseline |
winter 2019 |
0.979 |
0.083 |
0.417 |
0.447 |
2.806 |
NaN |
NaN |
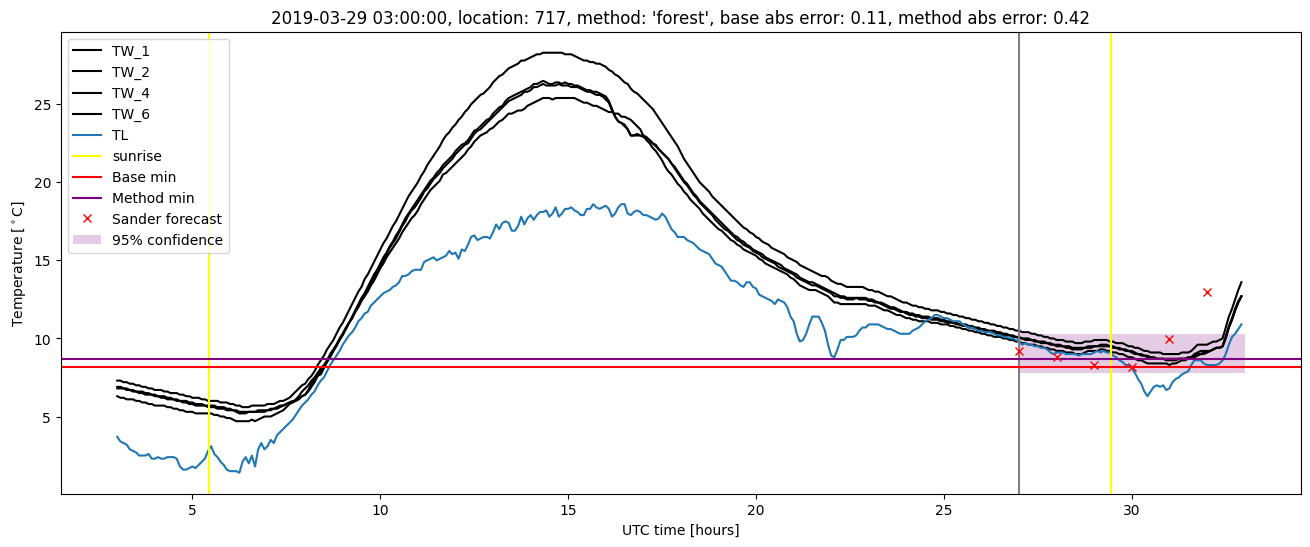
| forest |
winter 2019 |
0.986 |
0.083 |
0.406 |
0.417 |
2.885 |
0.442 |
1.230 |
| baseline |
all |
0.983 |
0.117 |
0.642 |
0.527 |
5.899 |
NaN |
NaN |
| forest |
all |
0.985 |
0.133 |
0.600 |
0.490 |
5.552 |
0.445 |
1.423 |
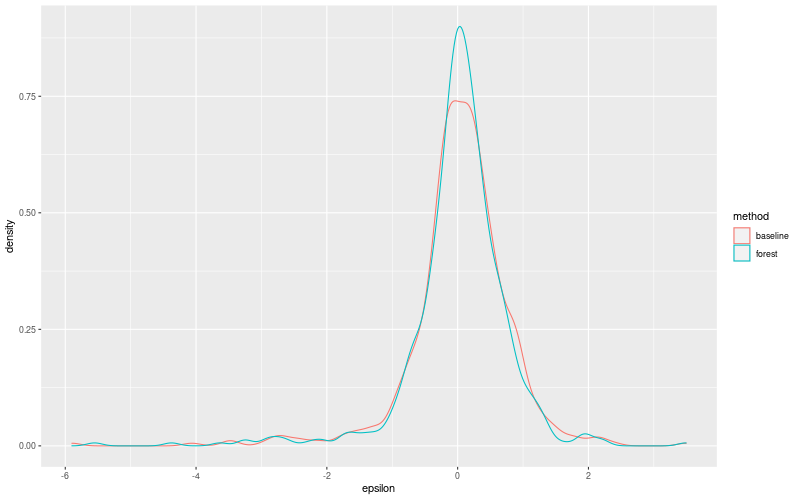
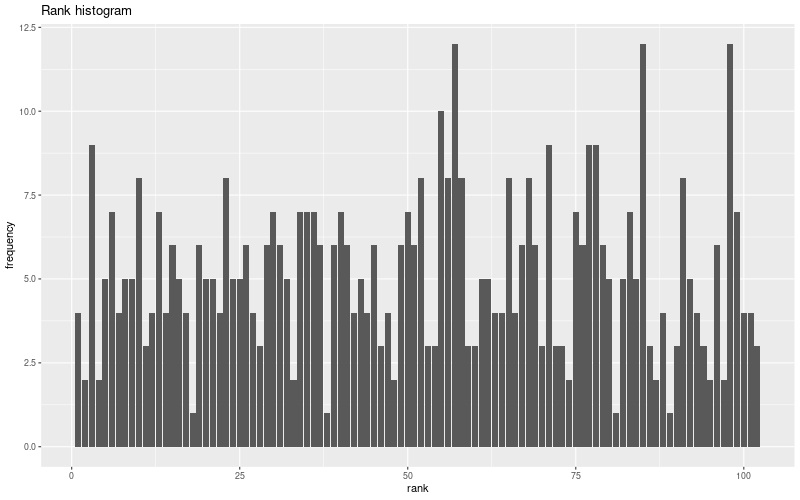
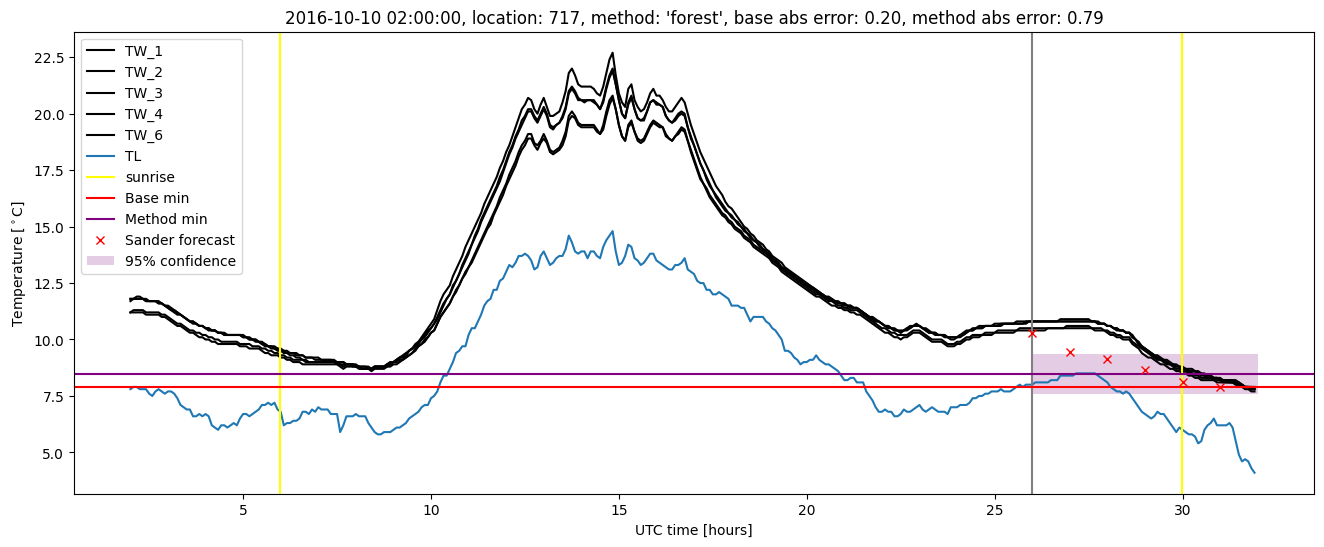
Random forest plots

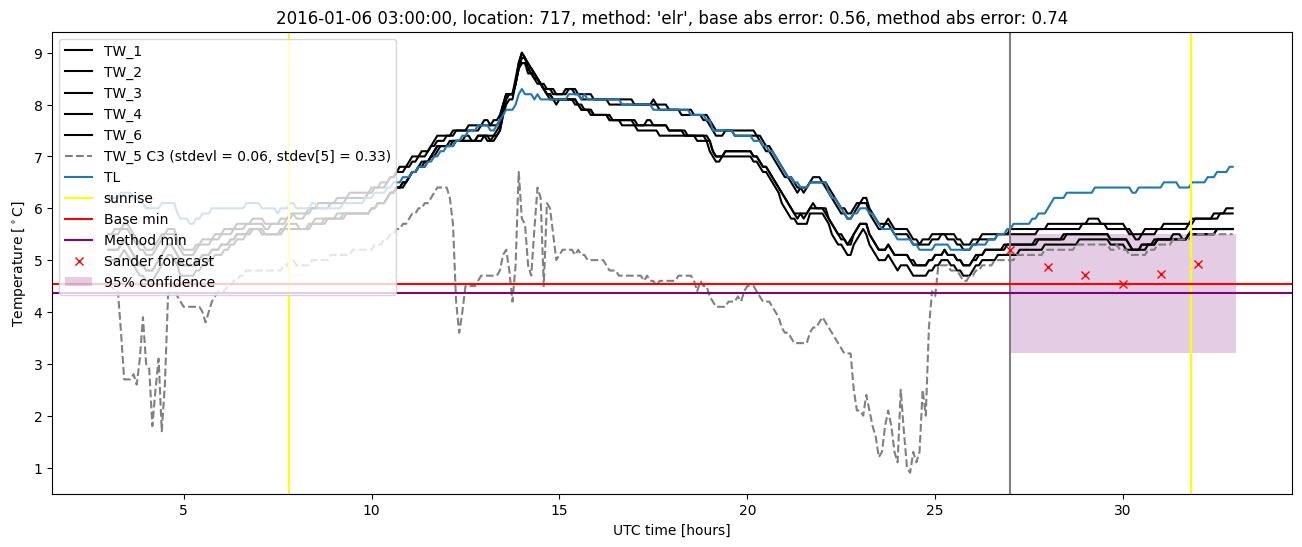
Extended logistic regression results
| names |
period |
power |
significance |
meanSquareError |
absError |
maxError |
CRPS |
IGN |
| baseline |
winter 2016 |
0.994 |
0.150 |
0.764 |
0.593 |
3.503 |
NaN |
NaN |
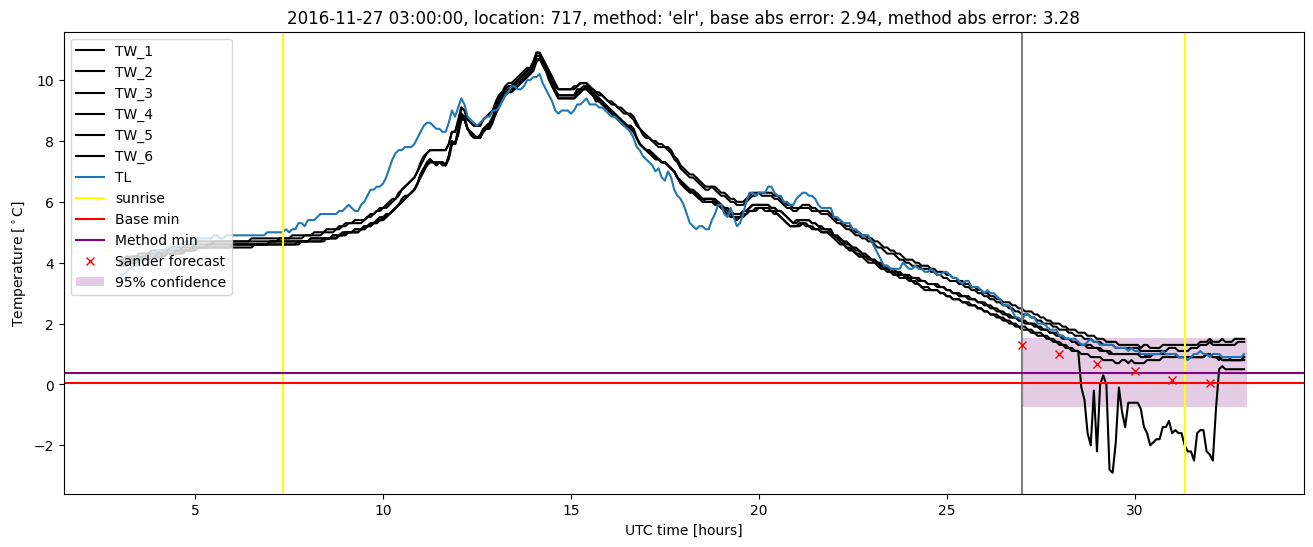
| elr |
winter 2016 |
0.994 |
0.150 |
0.662 |
0.542 |
3.582 |
0.462 |
1.549 |
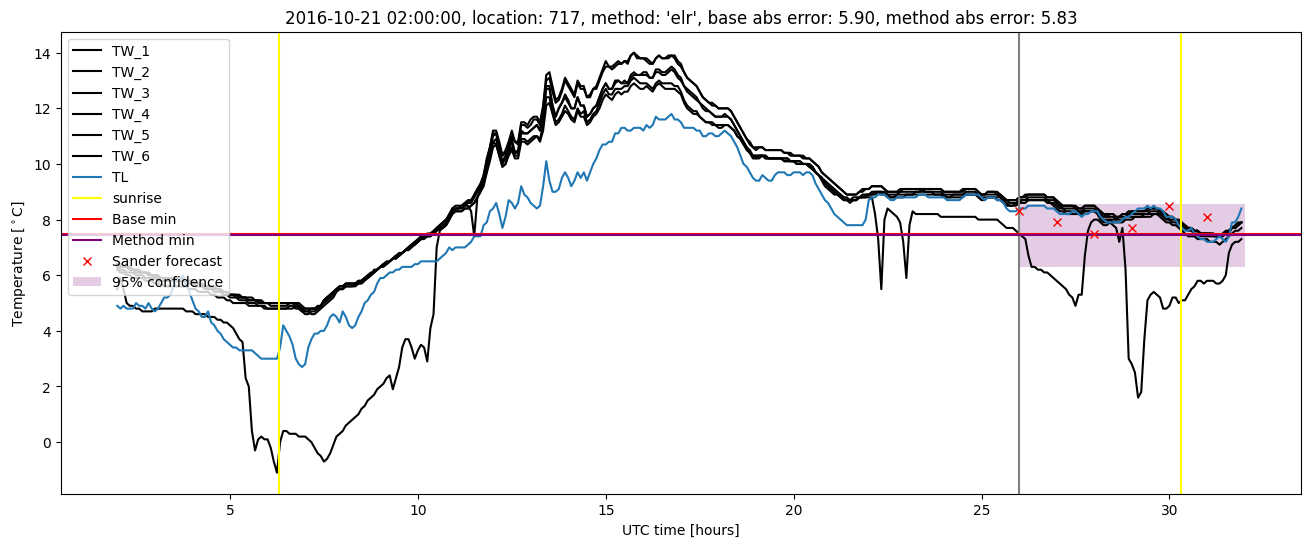
| baseline |
winter 2017 |
0.968 |
0.111 |
0.802 |
0.546 |
5.899 |
NaN |
NaN |
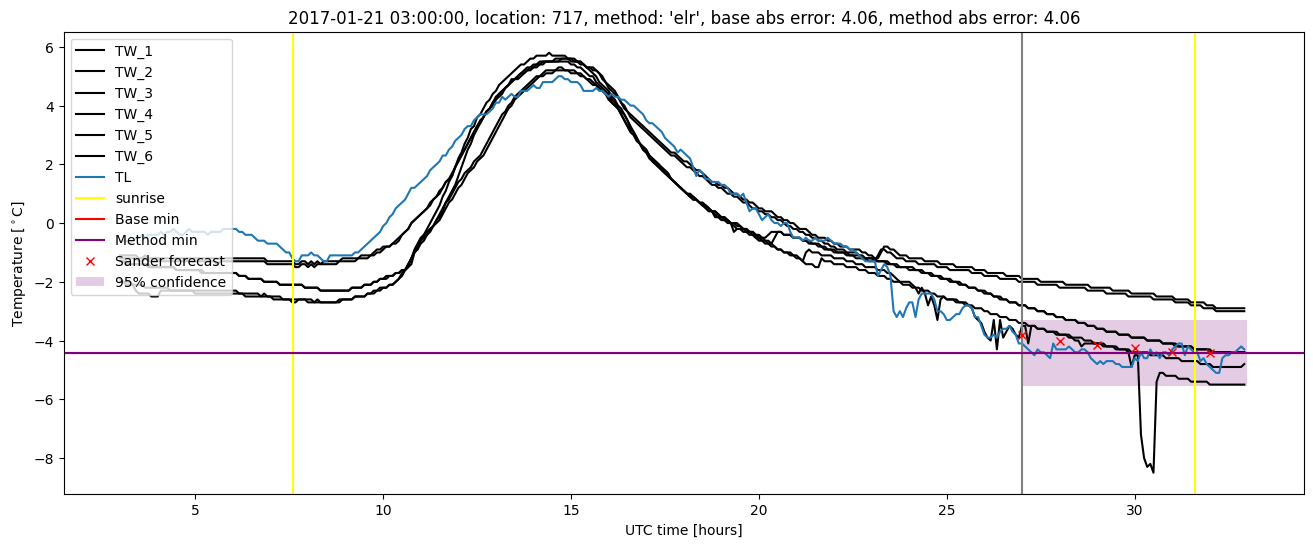
| elr |
winter 2017 |
0.976 |
0.111 |
0.722 |
0.508 |
5.833 |
0.507 |
1.873 |
| baseline |
winter 2018 |
1.000 |
0.000e+00 |
0.397 |
0.488 |
1.455 |
NaN |
NaN |
| elr |
winter 2018 |
1.000 |
0.000e+00 |
0.274 |
0.355 |
1.526 |
0.417 |
1.213 |
| baseline |
winter 2019 |
0.979 |
0.083 |
0.417 |
0.447 |
2.806 |
NaN |
NaN |
| elr |
winter 2019 |
0.986 |
0.083 |
0.412 |
0.443 |
2.922 |
0.448 |
1.296 |
| baseline |
all |
0.983 |
0.117 |
0.642 |
0.527 |
5.899 |
NaN |
NaN |
| elr |
all |
0.987 |
0.117 |
0.574 |
0.488 |
5.833 |
0.467 |
1.540 |
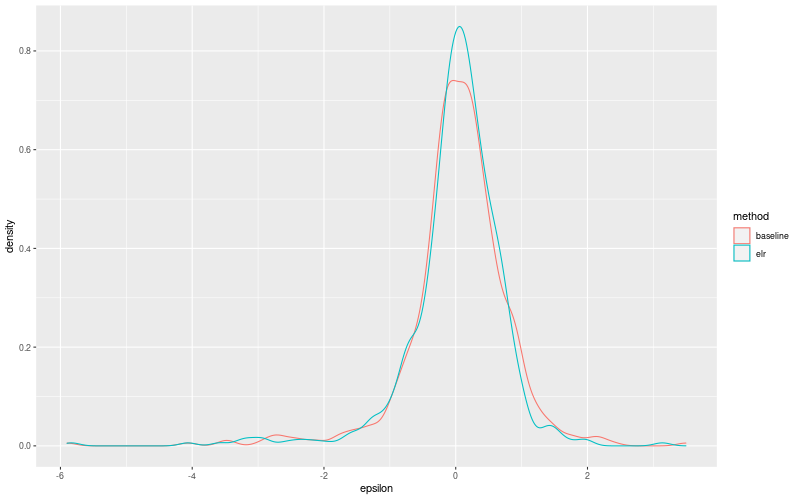
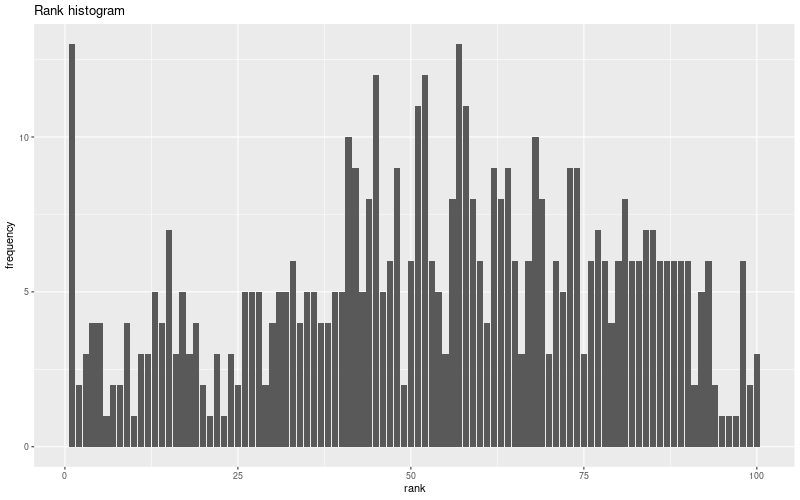
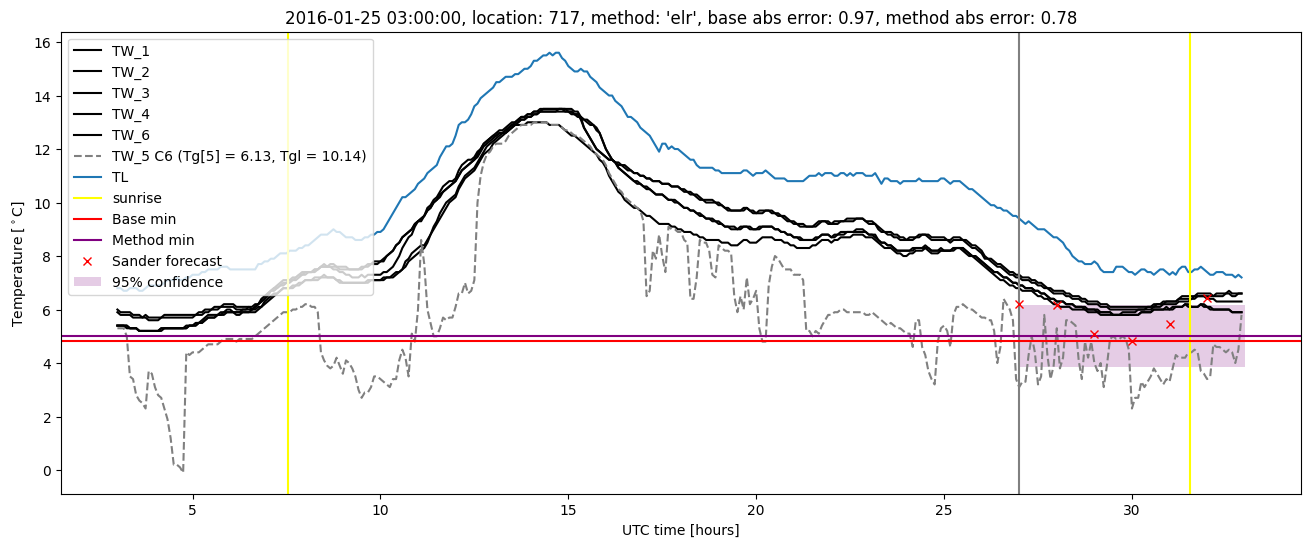
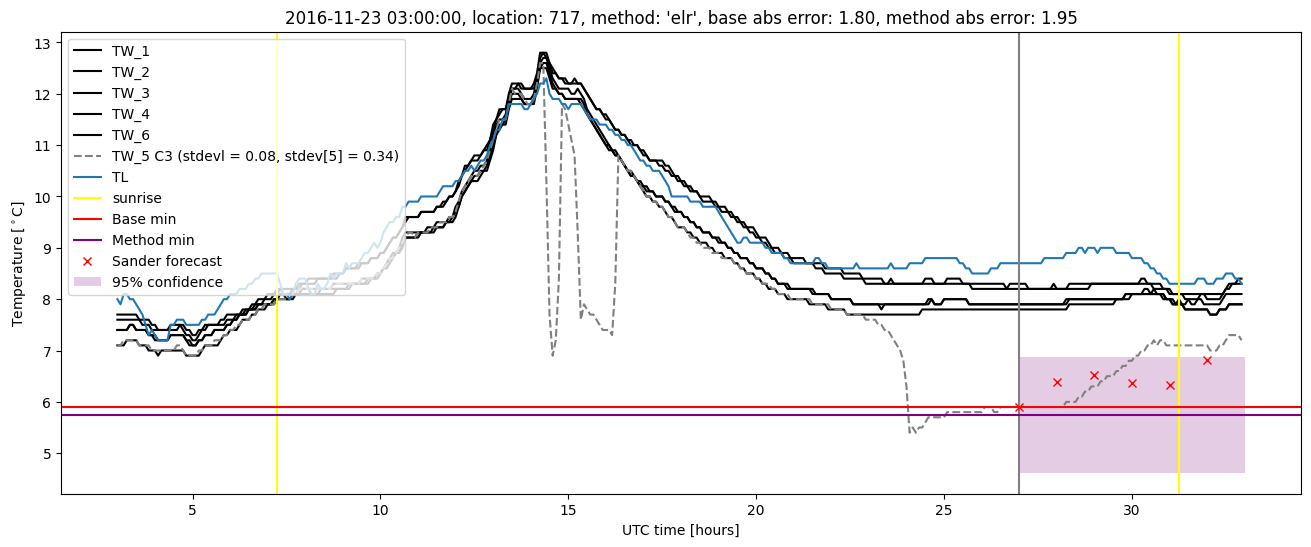
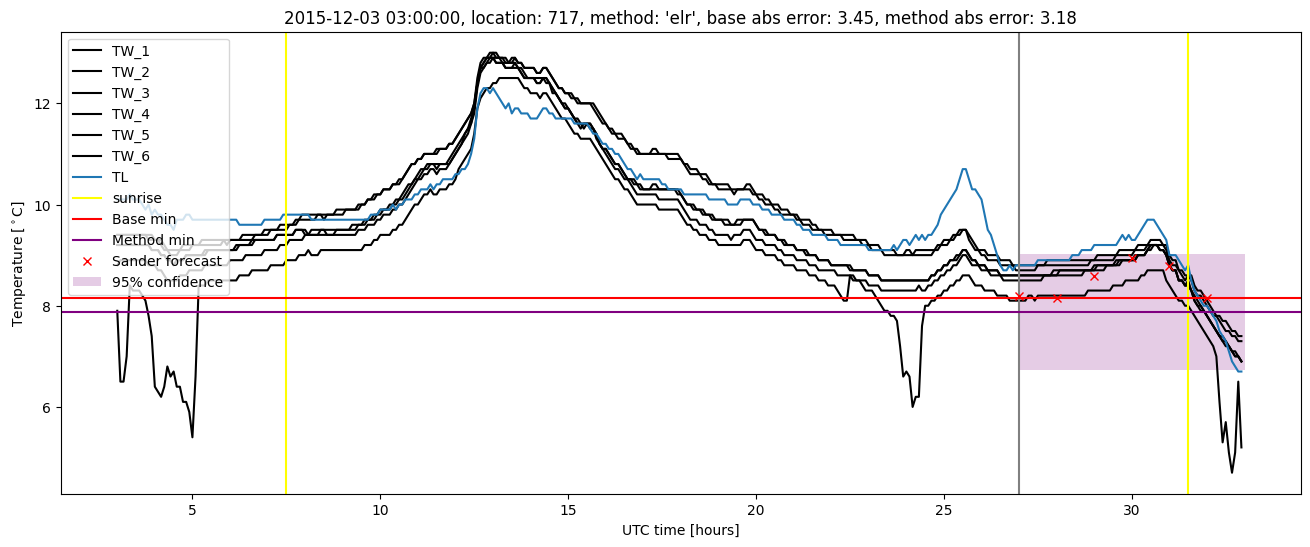
Extended logistic regression plots