GMS location: 716
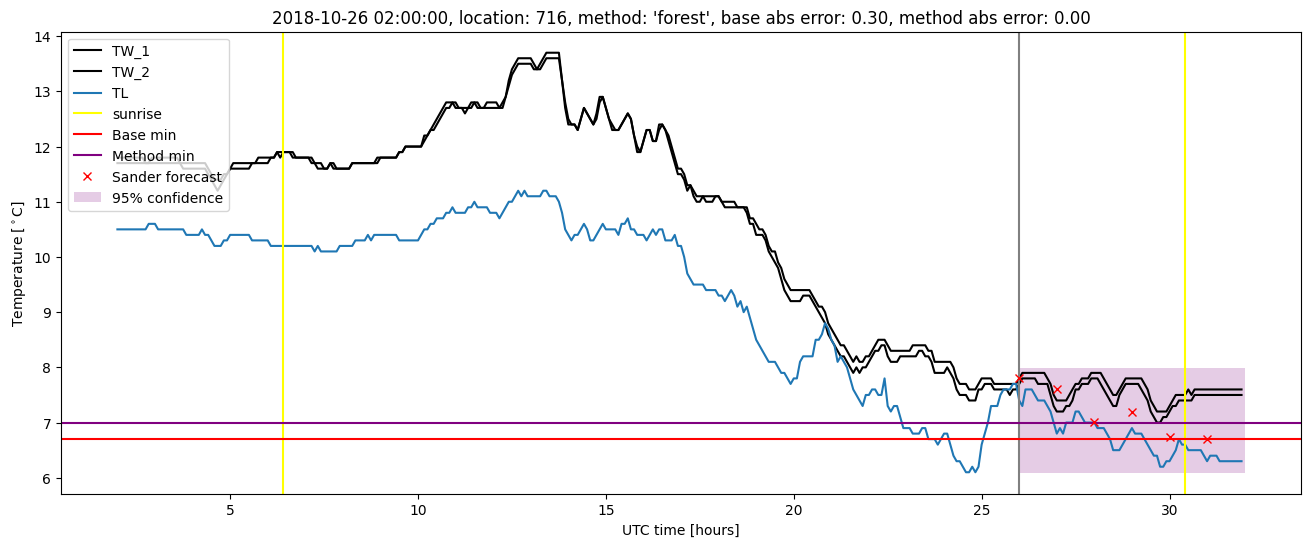
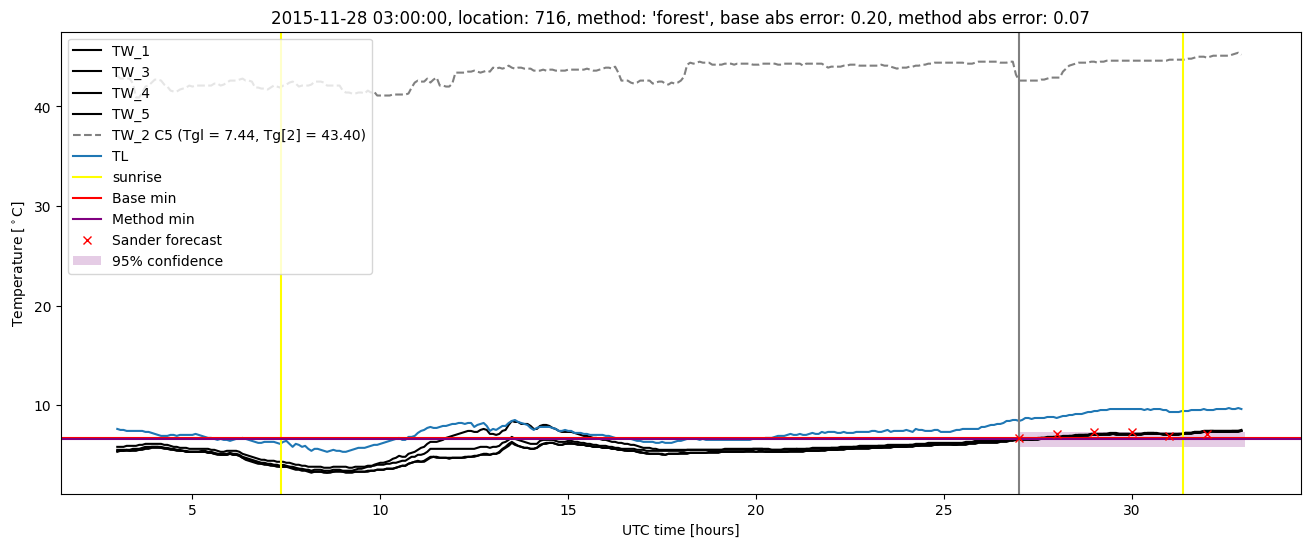
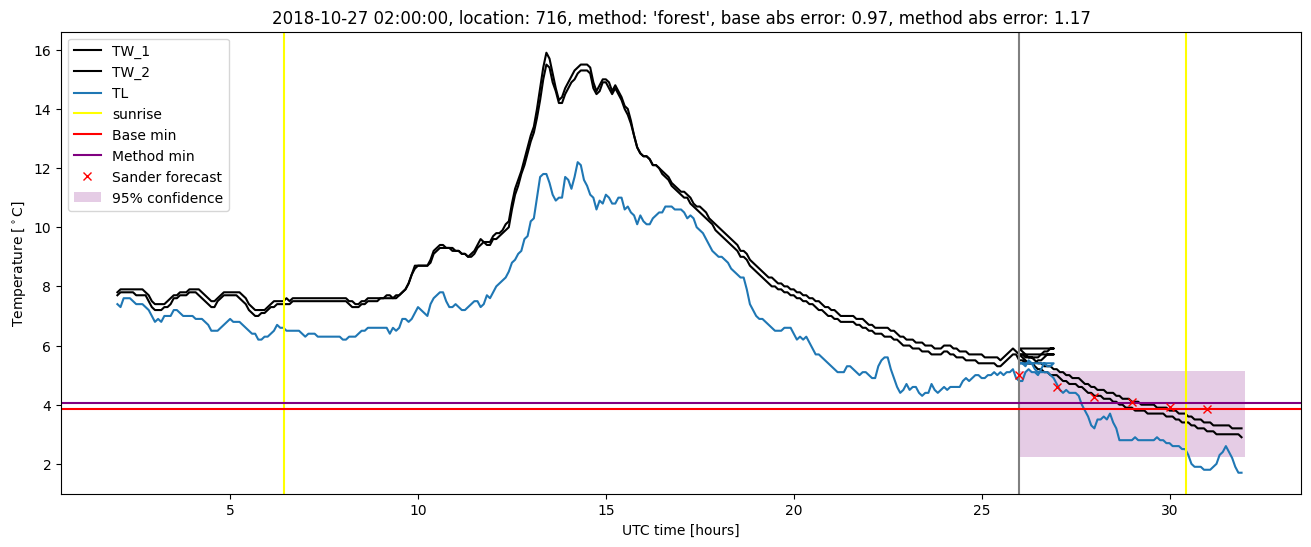
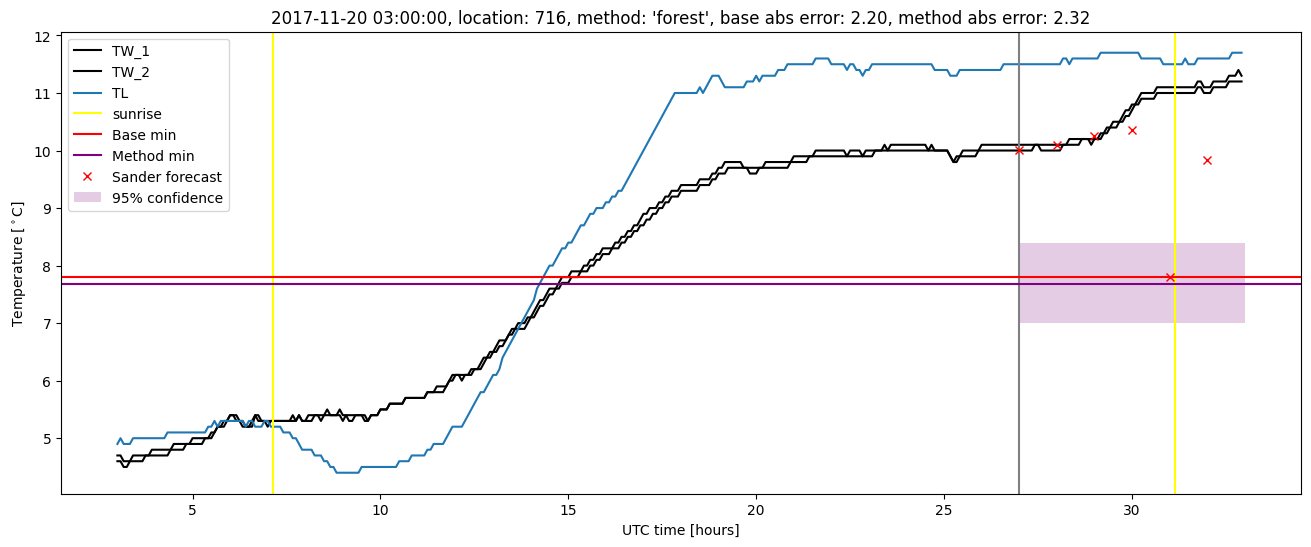
Random forest results
| names |
period |
power |
significance |
meanSquareError |
absError |
maxError |
CRPS |
IGN |
| baseline |
winter 2016 |
0.974 |
0.059 |
0.333 |
0.435 |
1.916 |
NaN |
NaN |
| forest |
winter 2016 |
0.989 |
0.059 |
0.224 |
0.354 |
1.674 |
0.425 |
2.656 |
| baseline |
winter 2017 |
0.946 |
0.088 |
0.429 |
0.493 |
2.668 |
NaN |
NaN |
| forest |
winter 2017 |
0.955 |
0.000e+00 |
0.267 |
0.392 |
1.843 |
0.444 |
3.622 |
| baseline |
winter 2018 |
0.978 |
0.111 |
0.447 |
0.507 |
2.200 |
NaN |
NaN |
| forest |
winter 2018 |
0.993 |
0.111 |
0.378 |
0.444 |
2.320 |
0.429 |
3.759 |
| baseline |
winter 2019 |
0.987 |
0.000e+00 |
0.265 |
0.386 |
2.004 |
NaN |
NaN |
| forest |
winter 2019 |
0.987 |
0.091 |
0.170 |
0.318 |
1.337 |
0.428 |
2.667 |
| baseline |
all |
0.973 |
0.079 |
0.364 |
0.453 |
2.668 |
NaN |
NaN |
| forest |
all |
0.983 |
0.056 |
0.257 |
0.375 |
2.320 |
0.431 |
3.131 |
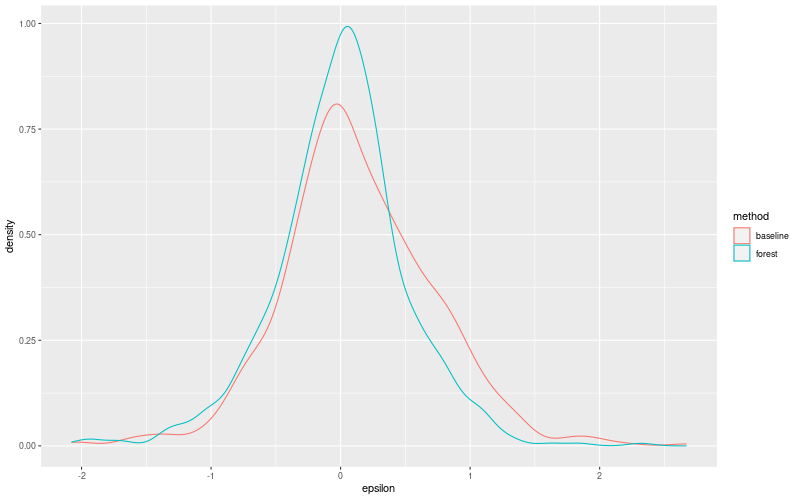
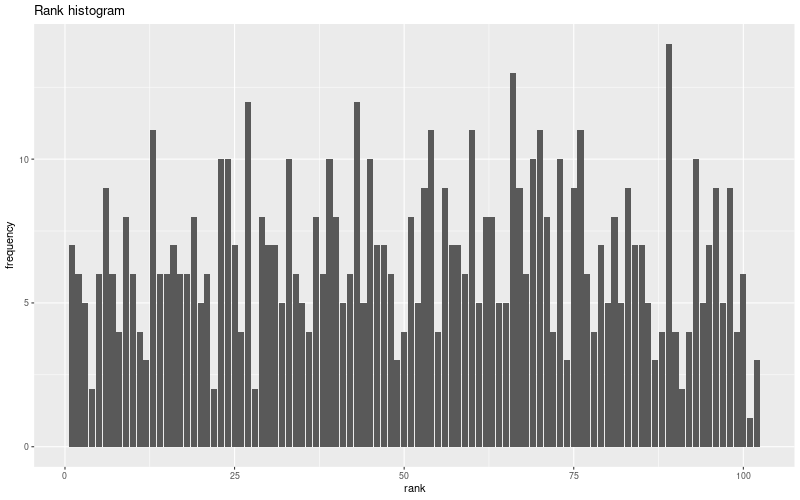
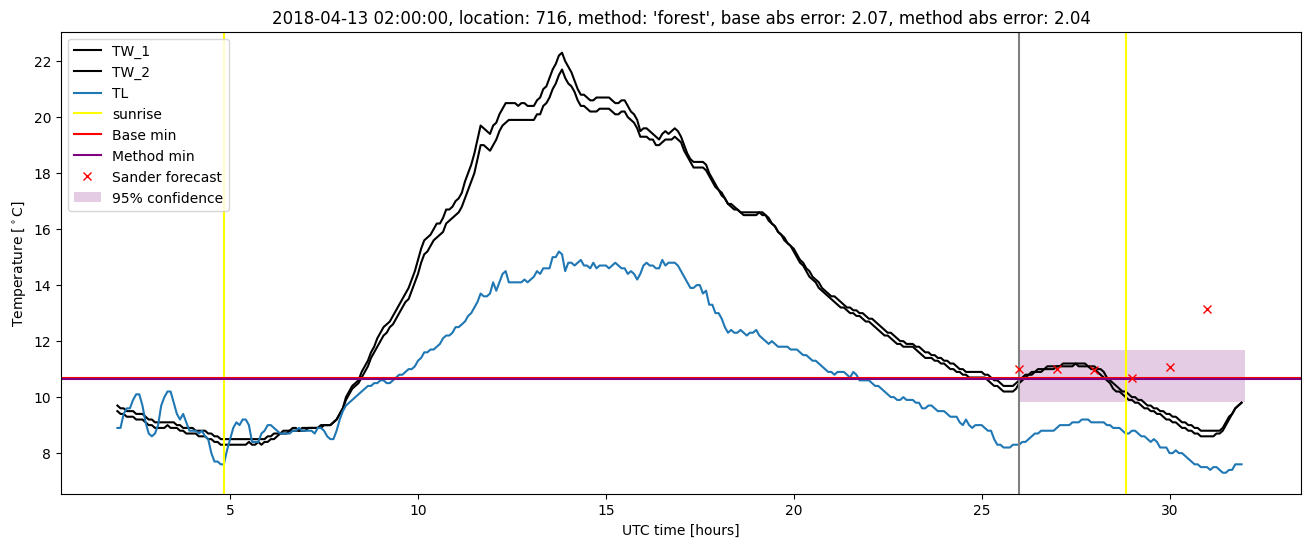
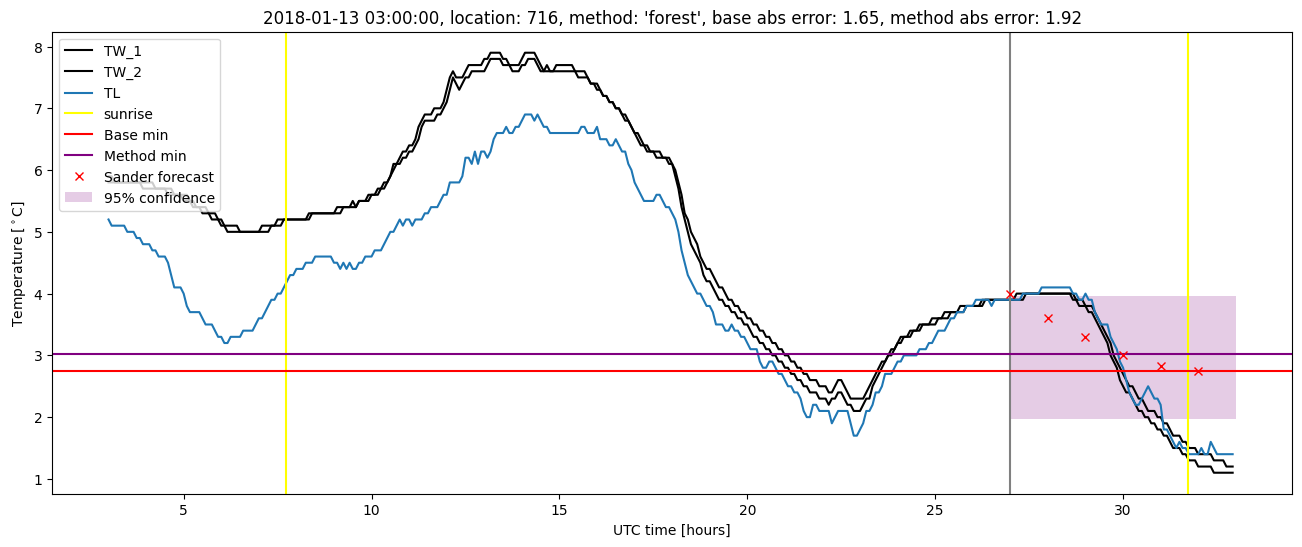
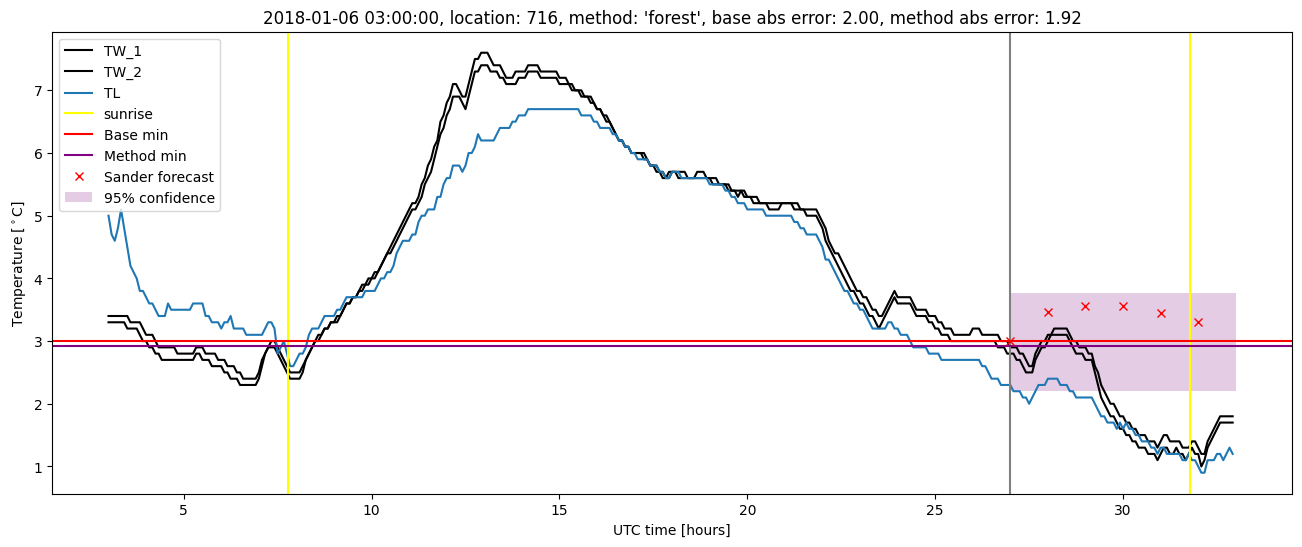
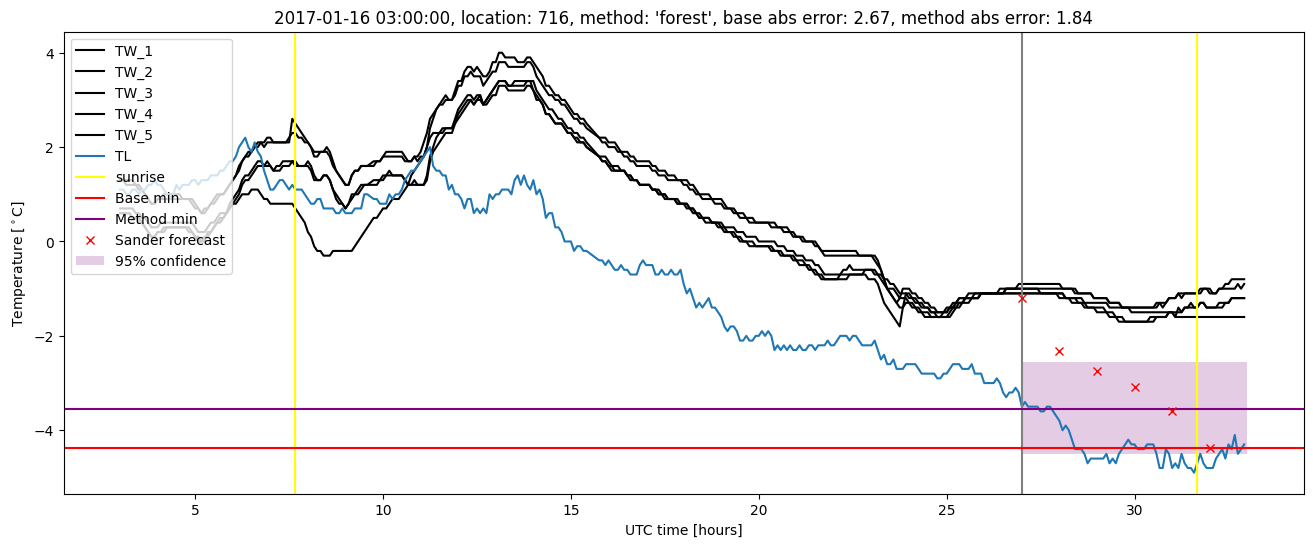
Random forest plots
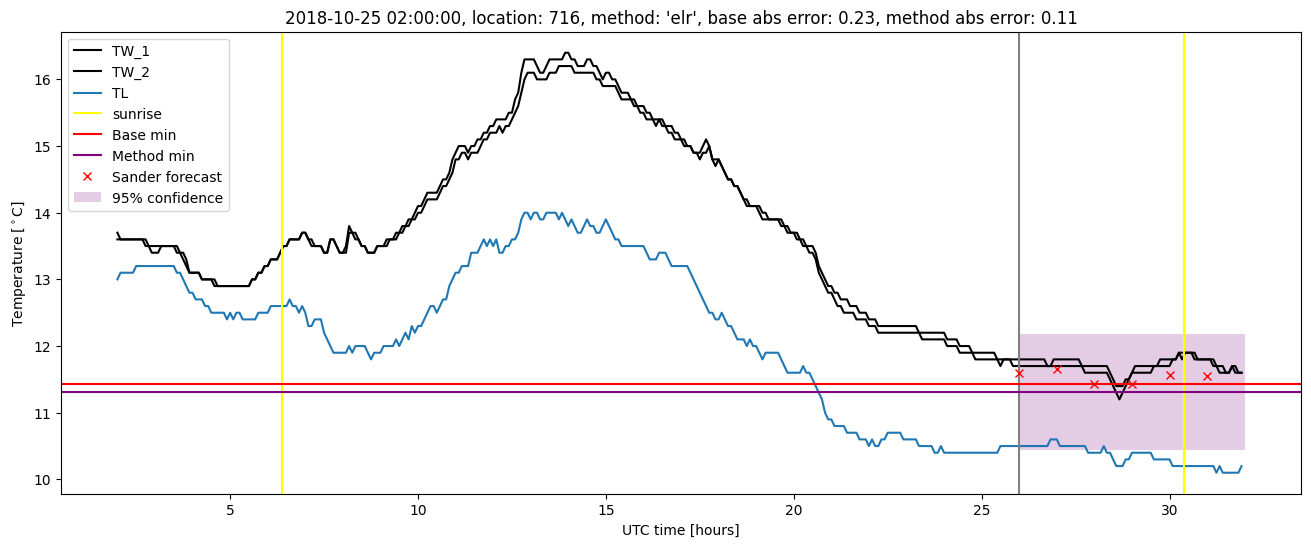
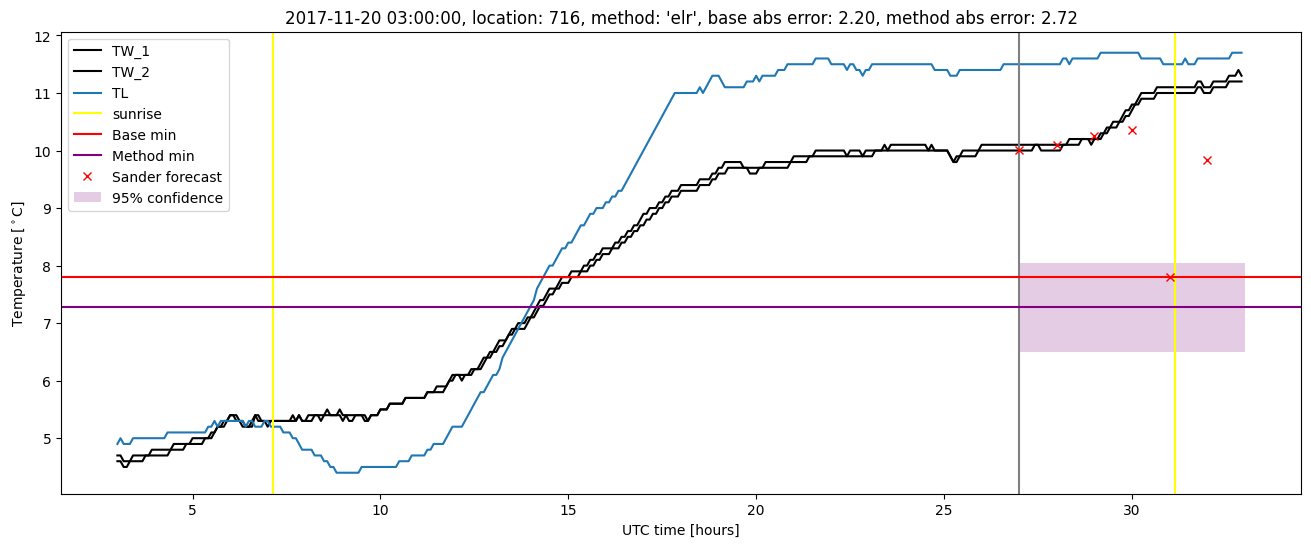
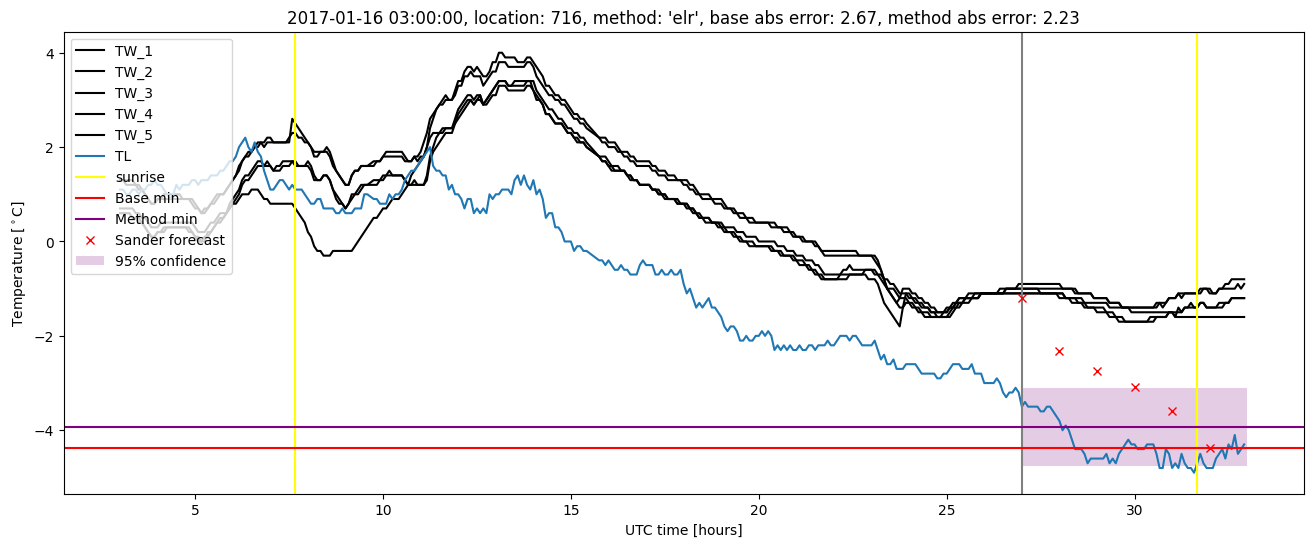
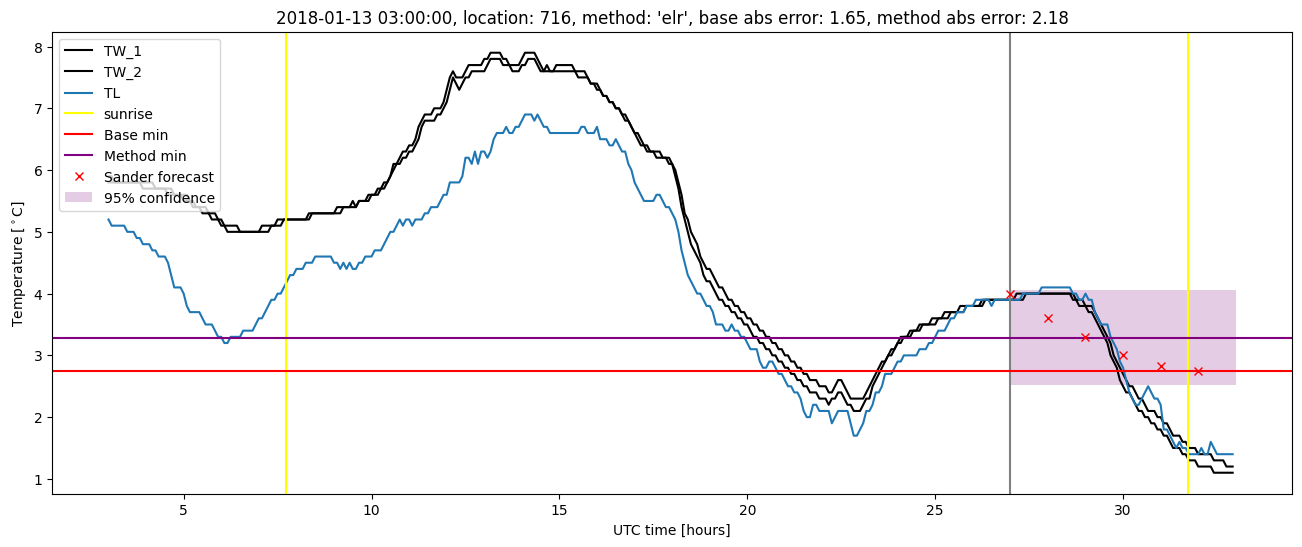
Extended logistic regression results
| names |
period |
power |
significance |
meanSquareError |
absError |
maxError |
CRPS |
IGN |
| baseline |
winter 2016 |
0.974 |
0.059 |
0.333 |
0.435 |
1.916 |
NaN |
NaN |
| elr |
winter 2016 |
0.984 |
0.059 |
0.269 |
0.388 |
1.681 |
0.486 |
3.849 |
| baseline |
winter 2017 |
0.946 |
0.088 |
0.429 |
0.493 |
2.668 |
NaN |
NaN |
| elr |
winter 2017 |
0.955 |
0.059 |
0.308 |
0.425 |
2.230 |
0.468 |
4.039 |
| baseline |
winter 2018 |
0.978 |
0.111 |
0.447 |
0.507 |
2.200 |
NaN |
NaN |
| elr |
winter 2018 |
0.993 |
0.185 |
0.414 |
0.477 |
2.721 |
0.482 |
5.085 |
| baseline |
winter 2019 |
0.987 |
0.000e+00 |
0.265 |
0.386 |
2.004 |
NaN |
NaN |
| elr |
winter 2019 |
0.987 |
0.091 |
0.226 |
0.361 |
1.900 |
0.464 |
3.240 |
| baseline |
all |
0.973 |
0.079 |
0.364 |
0.453 |
2.668 |
NaN |
NaN |
| elr |
all |
0.981 |
0.101 |
0.302 |
0.411 |
2.721 |
0.476 |
4.039 |
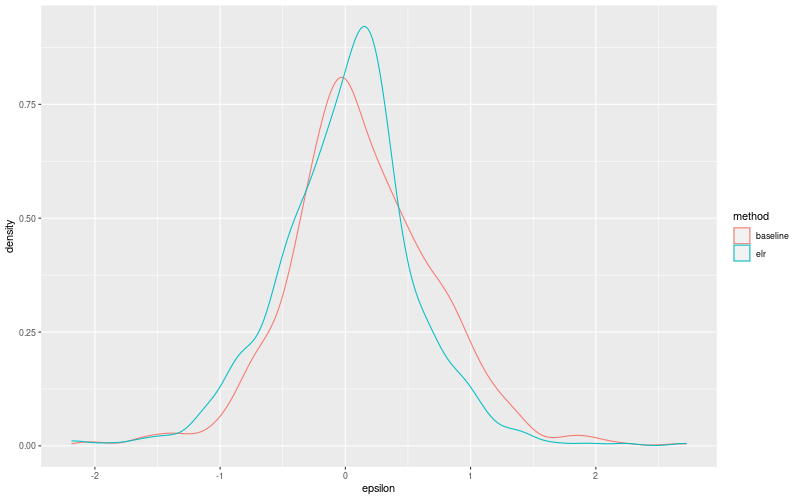
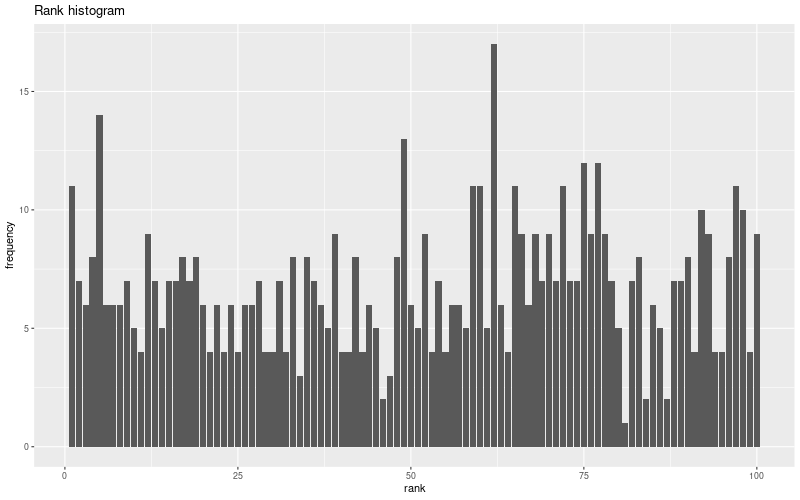
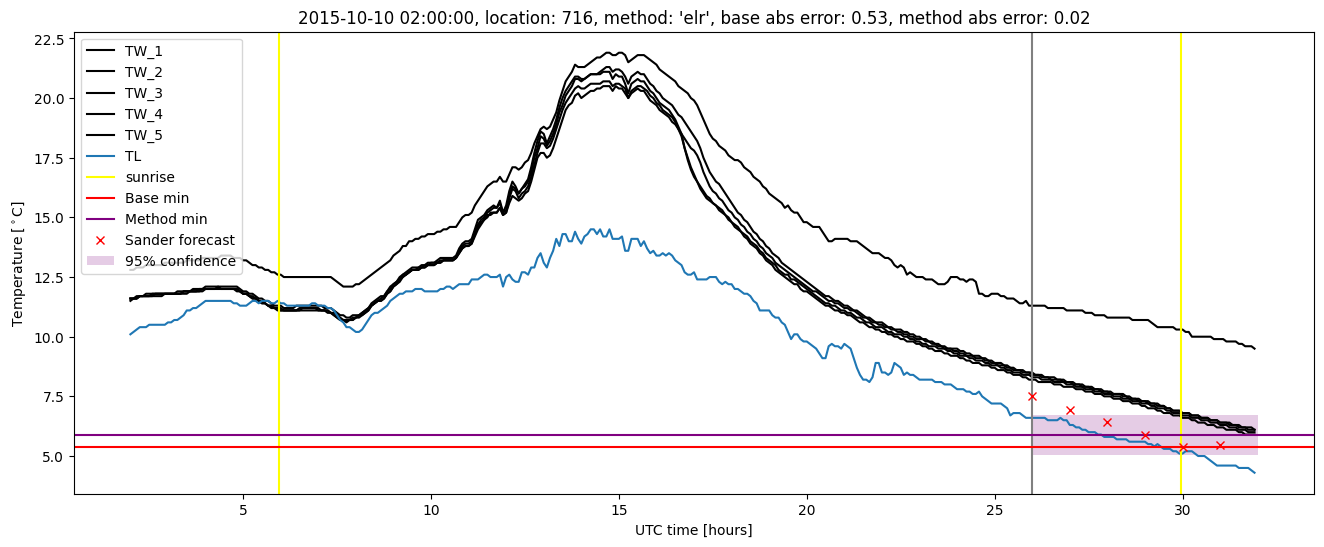
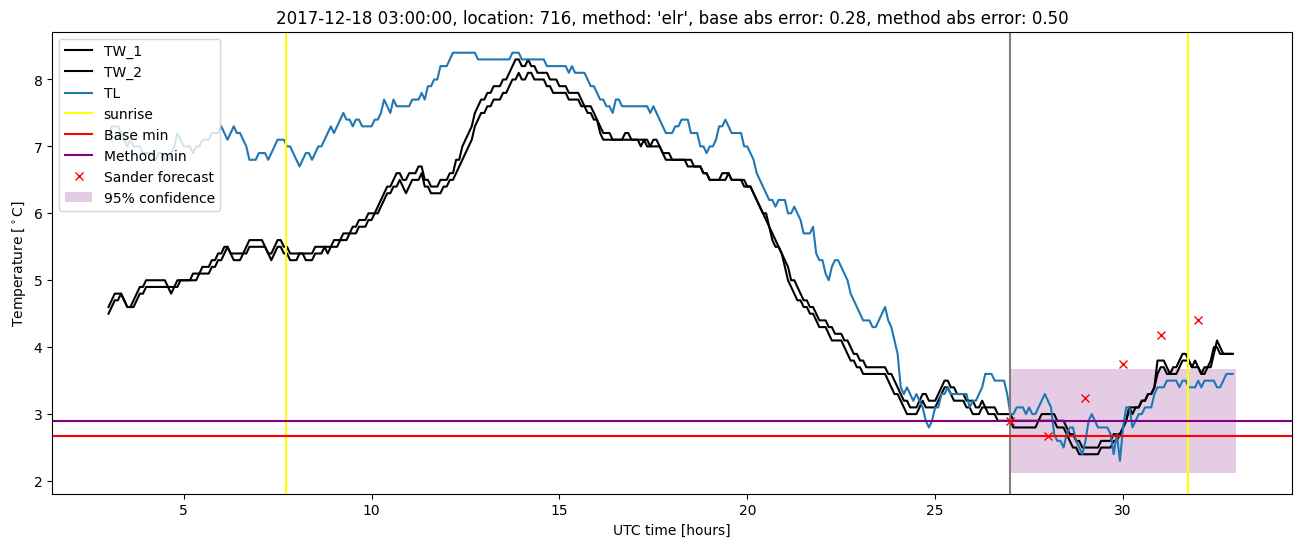
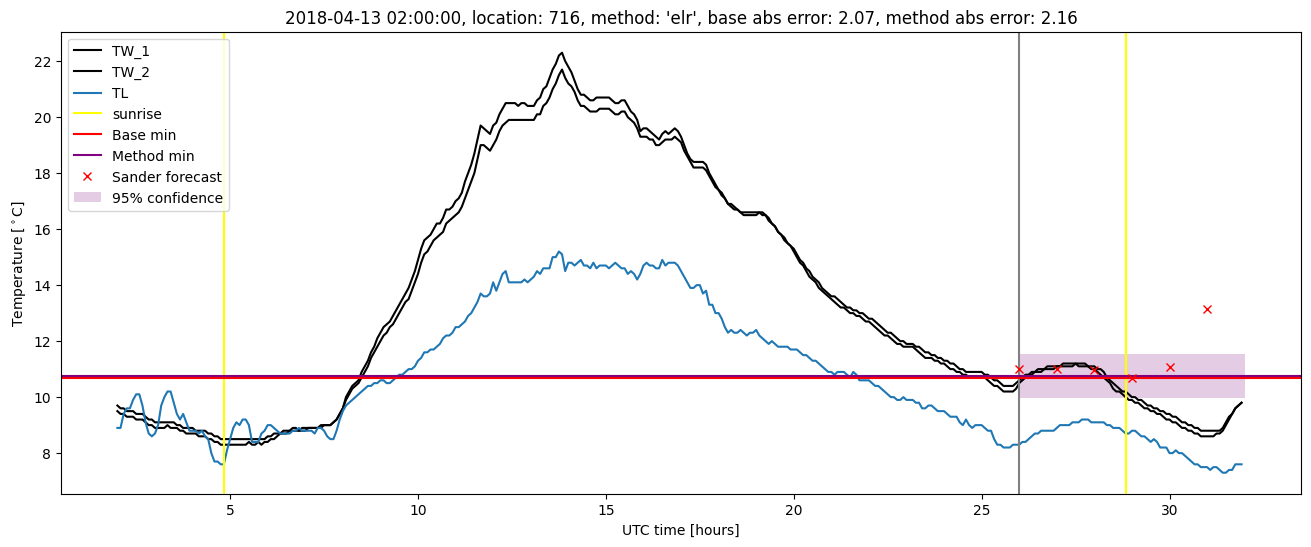
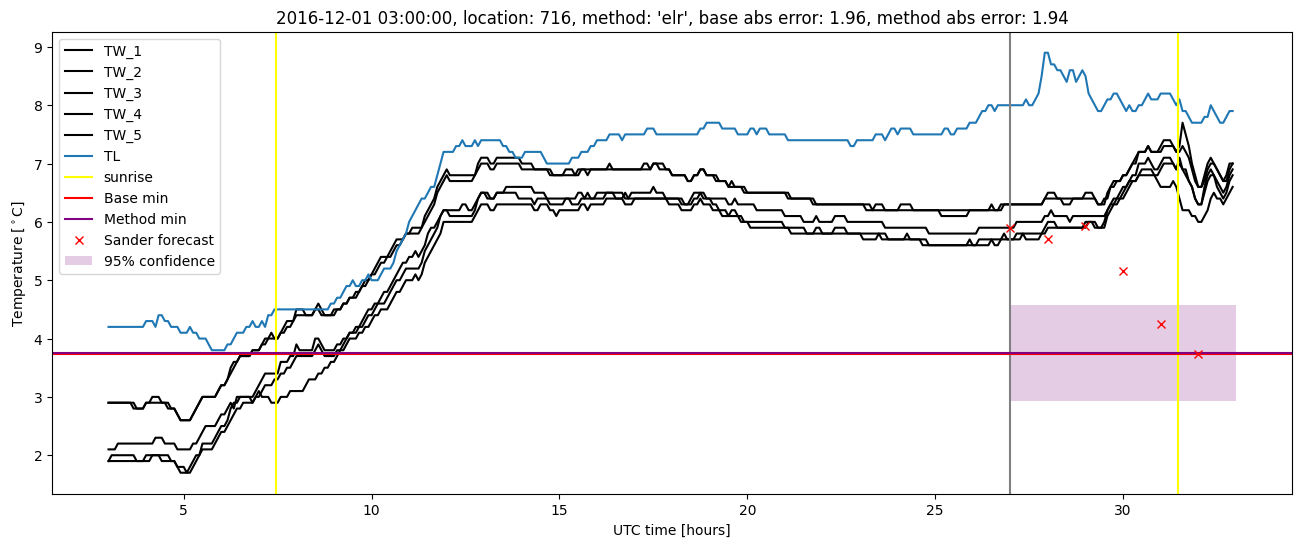
Extended logistic regression plots