GMS location: 715
Random forest results
| names |
period |
power |
significance |
meanSquareError |
absError |
maxError |
CRPS |
IGN |
| baseline |
winter 2016 |
0.995 |
0.000e+00 |
0.346 |
0.427 |
2.996 |
NaN |
NaN |
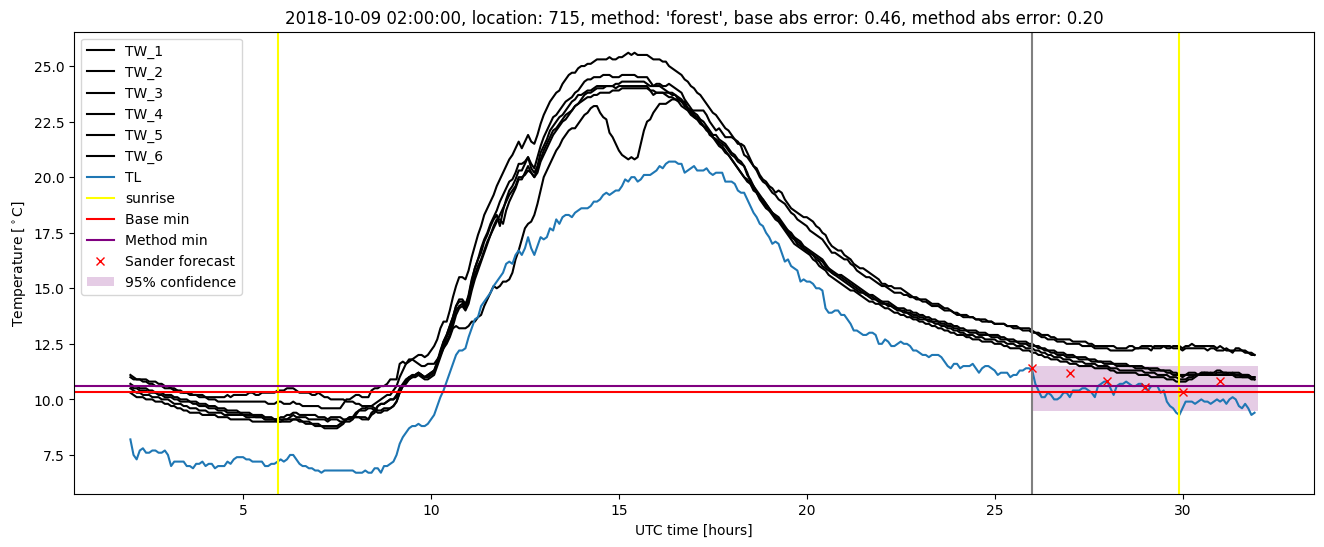
| forest |
winter 2016 |
0.995 |
0.111 |
0.259 |
0.364 |
2.904 |
0.446 |
3.598 |
| baseline |
winter 2017 |
0.968 |
0.071 |
0.378 |
0.478 |
1.904 |
NaN |
NaN |
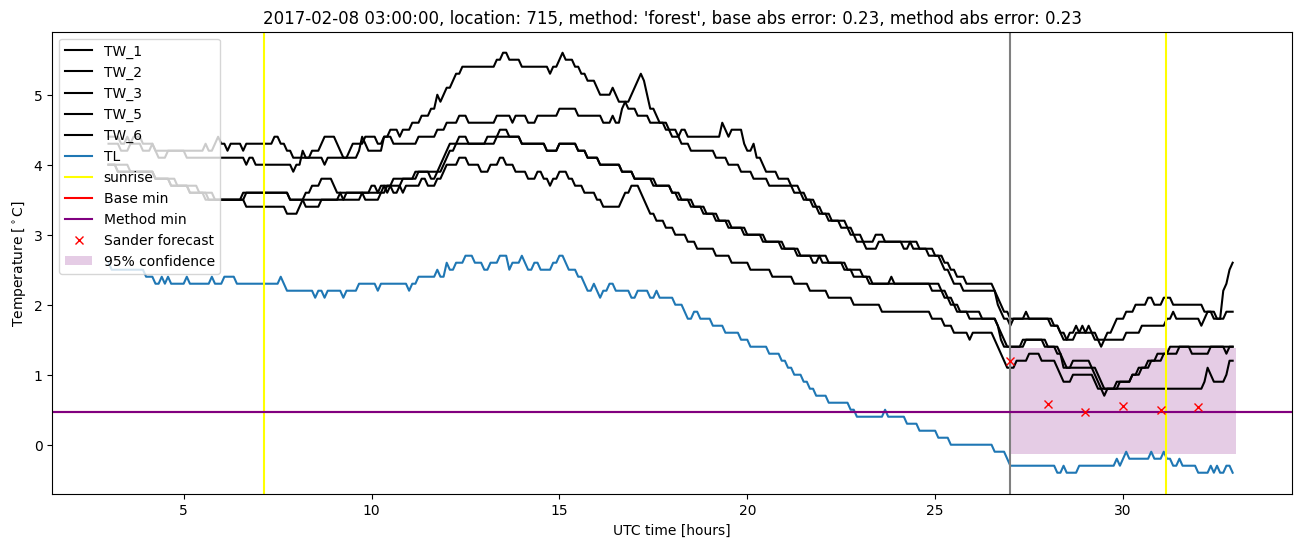
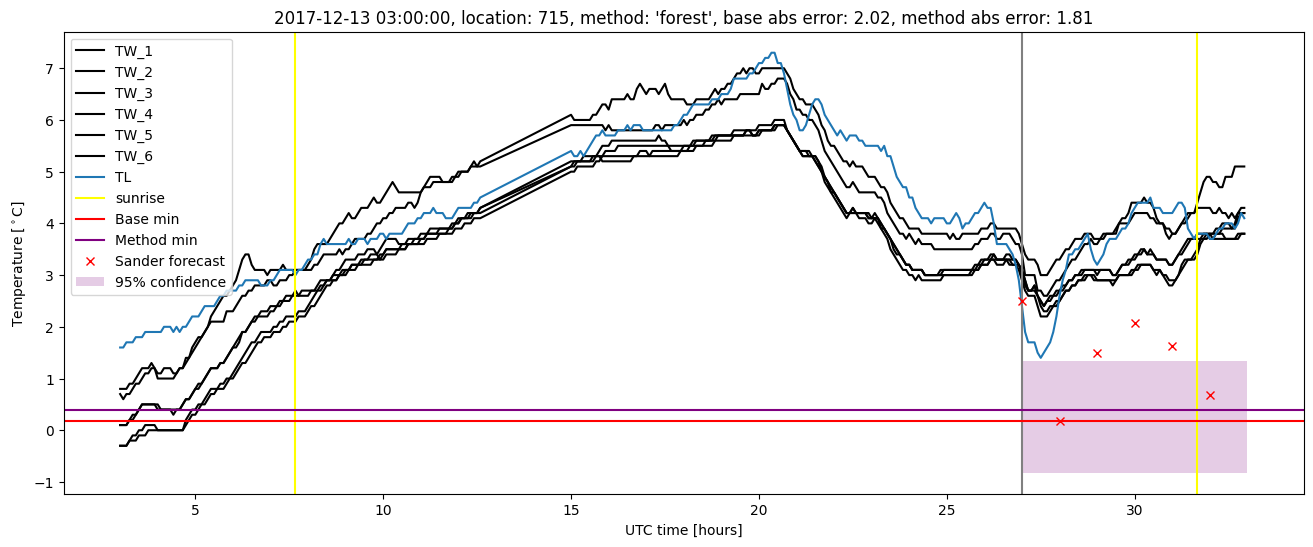
| forest |
winter 2017 |
0.976 |
0.107 |
0.226 |
0.357 |
1.308 |
0.439 |
4.541 |
| baseline |
winter 2018 |
0.986 |
0.125 |
0.362 |
0.464 |
2.020 |
NaN |
NaN |
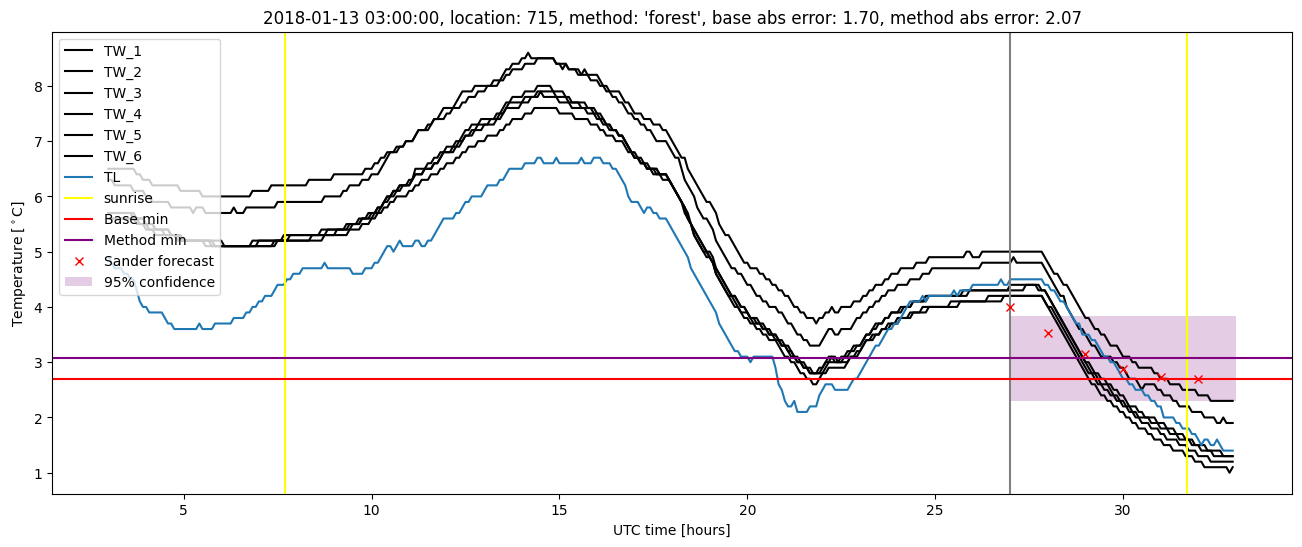
| forest |
winter 2018 |
0.993 |
0.167 |
0.264 |
0.384 |
2.067 |
0.441 |
3.272 |
| baseline |
winter 2019 |
0.980 |
0.000e+00 |
0.335 |
0.400 |
2.361 |
NaN |
NaN |
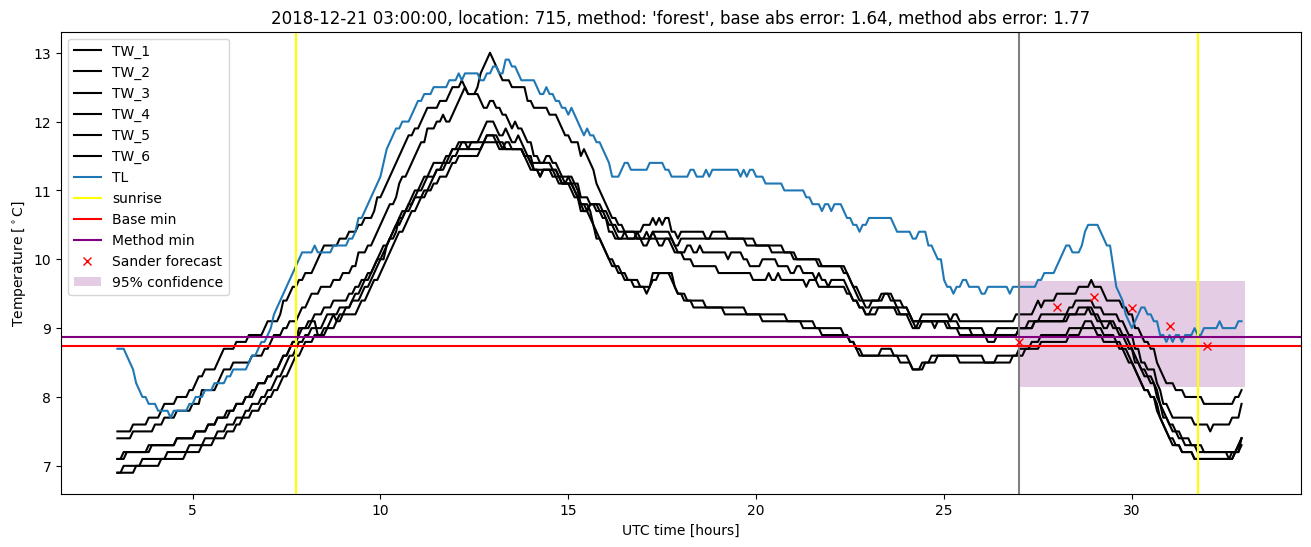
| forest |
winter 2019 |
0.980 |
0.000e+00 |
0.230 |
0.347 |
1.769 |
0.437 |
3.216 |
| baseline |
all |
0.983 |
0.061 |
0.354 |
0.441 |
2.996 |
NaN |
NaN |
| forest |
all |
0.987 |
0.110 |
0.246 |
0.363 |
2.904 |
0.441 |
3.640 |
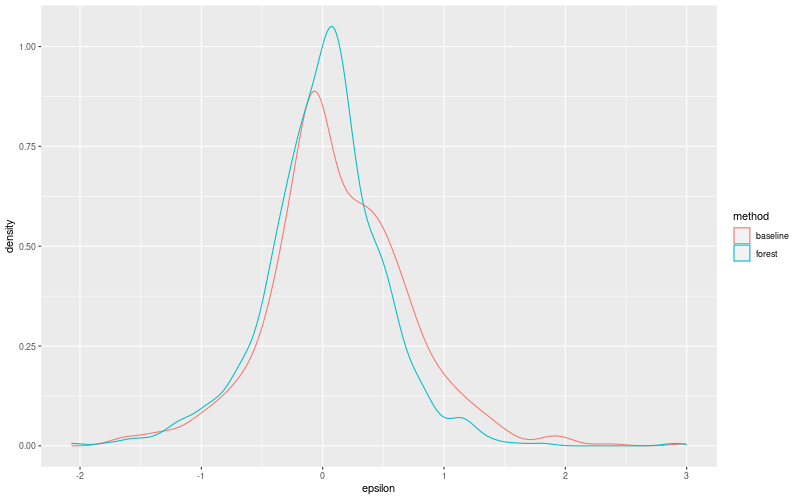
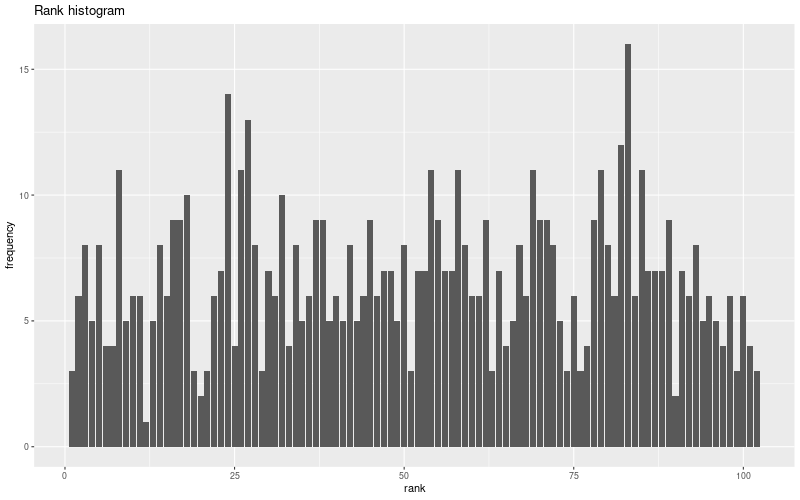
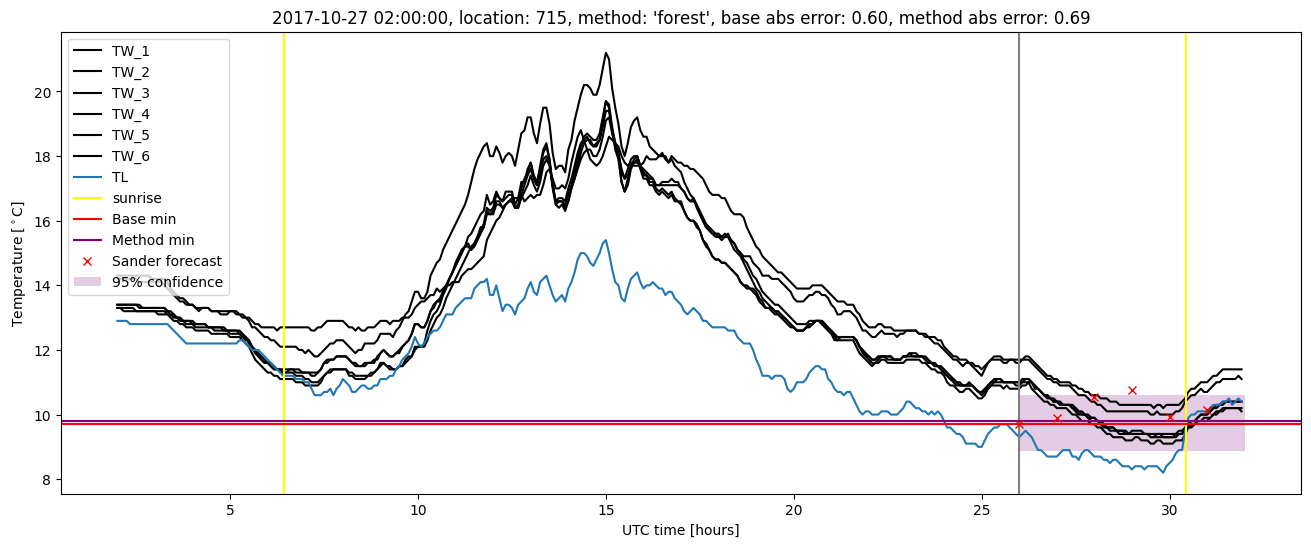
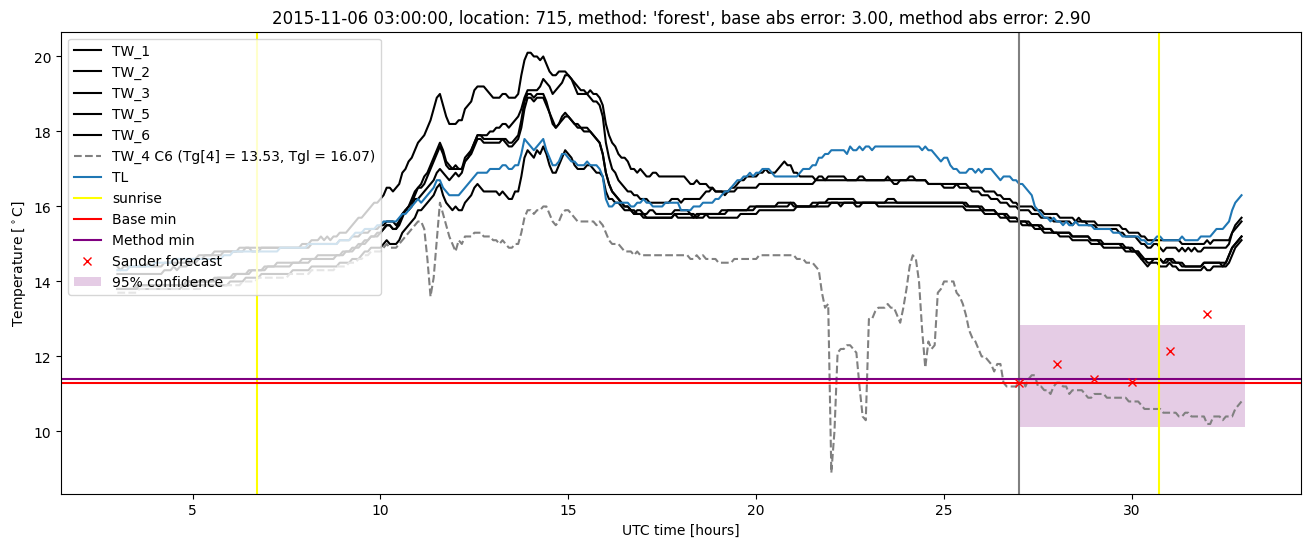
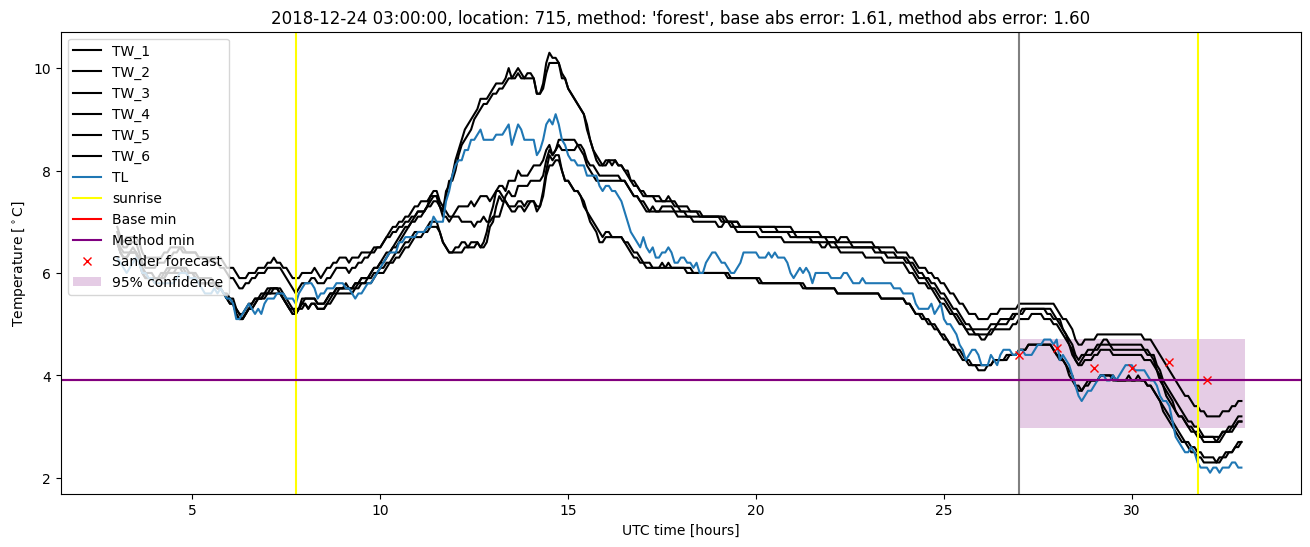
Random forest plots
Extended logistic regression results
| names |
period |
power |
significance |
meanSquareError |
absError |
maxError |
CRPS |
IGN |
| baseline |
winter 2016 |
0.995 |
0.000e+00 |
0.346 |
0.427 |
2.996 |
NaN |
NaN |
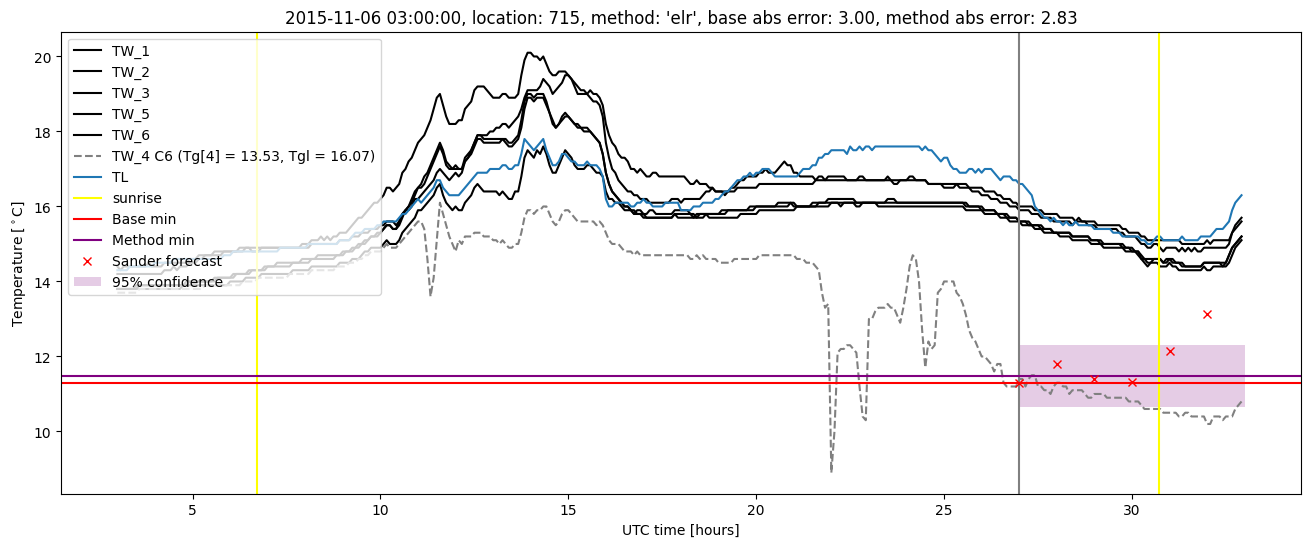
| elr |
winter 2016 |
0.995 |
0.000e+00 |
0.313 |
0.412 |
2.825 |
0.517 |
4.757 |
| baseline |
winter 2017 |
0.968 |
0.071 |
0.378 |
0.478 |
1.904 |
NaN |
NaN |
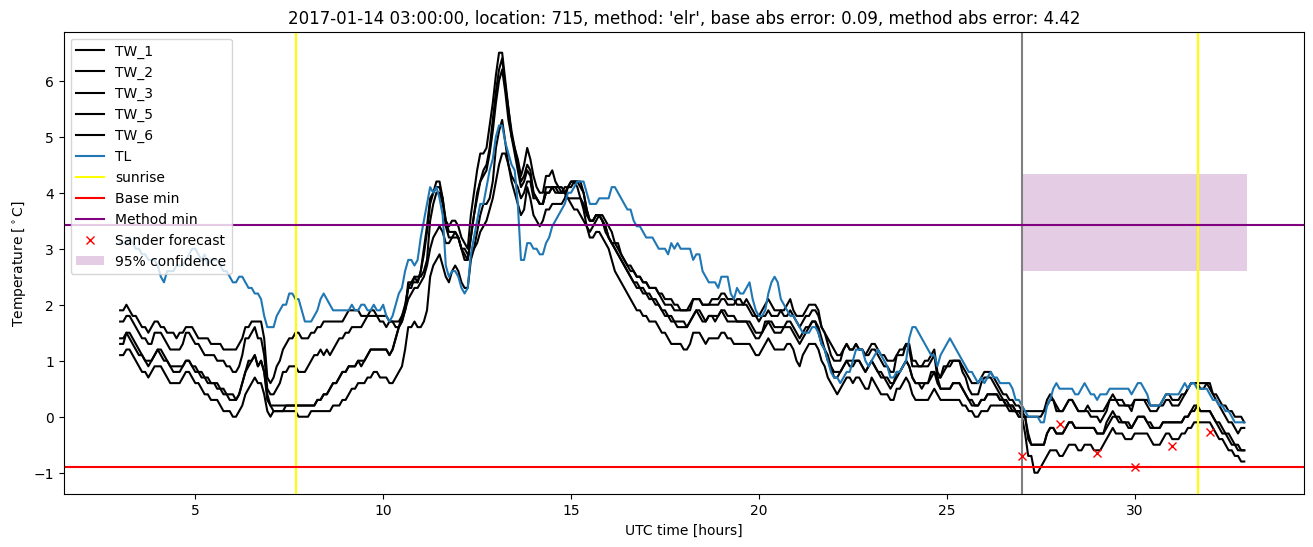
| elr |
winter 2017 |
0.976 |
0.107 |
0.440 |
0.447 |
4.418 |
0.517 |
4.616 |
| baseline |
winter 2018 |
0.986 |
0.125 |
0.362 |
0.464 |
2.020 |
NaN |
NaN |
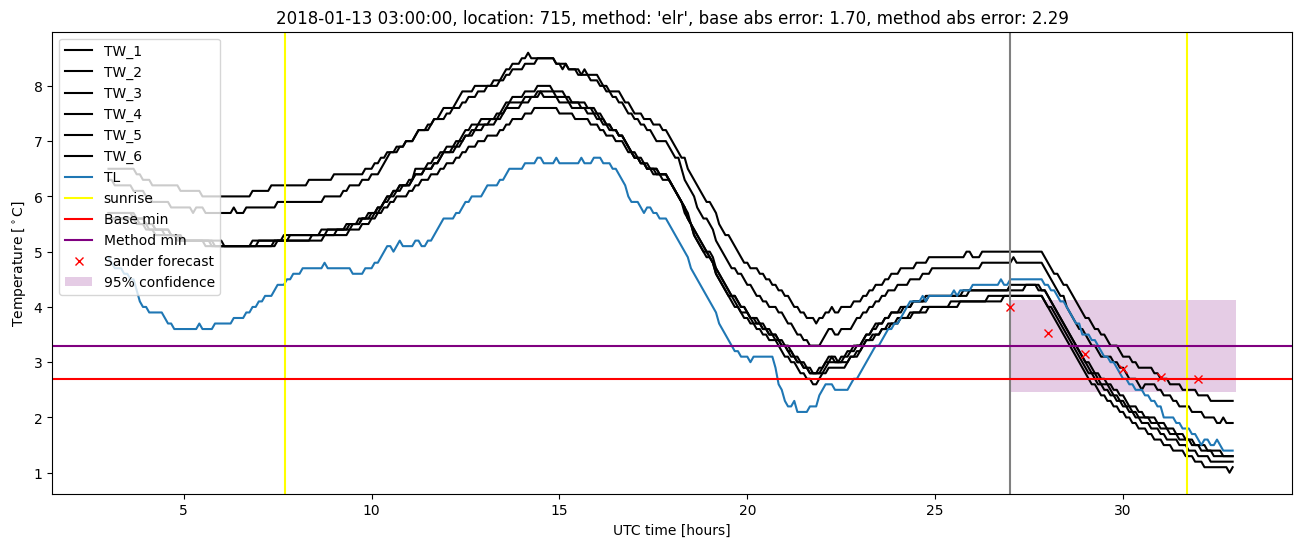
| elr |
winter 2018 |
0.986 |
0.208 |
0.286 |
0.396 |
2.293 |
0.493 |
4.283 |
| baseline |
winter 2019 |
0.980 |
0.000e+00 |
0.335 |
0.400 |
2.361 |
NaN |
NaN |
| elr |
winter 2019 |
0.980 |
0.000e+00 |
0.256 |
0.375 |
1.518 |
0.480 |
4.136 |
| baseline |
all |
0.983 |
0.061 |
0.354 |
0.441 |
2.996 |
NaN |
NaN |
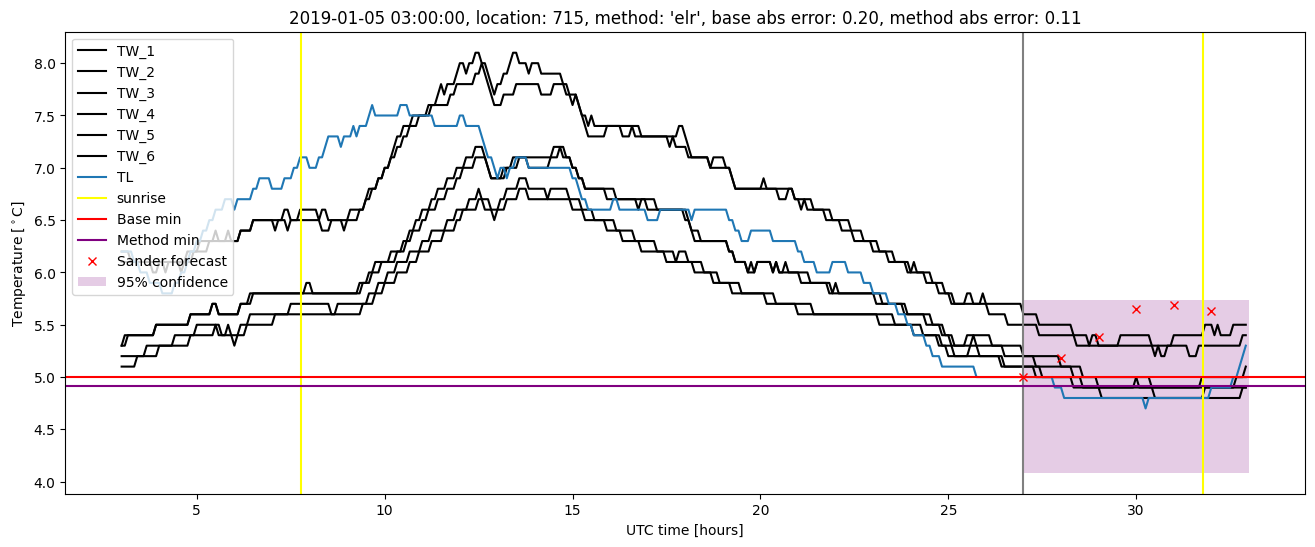
| elr |
all |
0.985 |
0.098 |
0.321 |
0.407 |
4.418 |
0.502 |
4.465 |
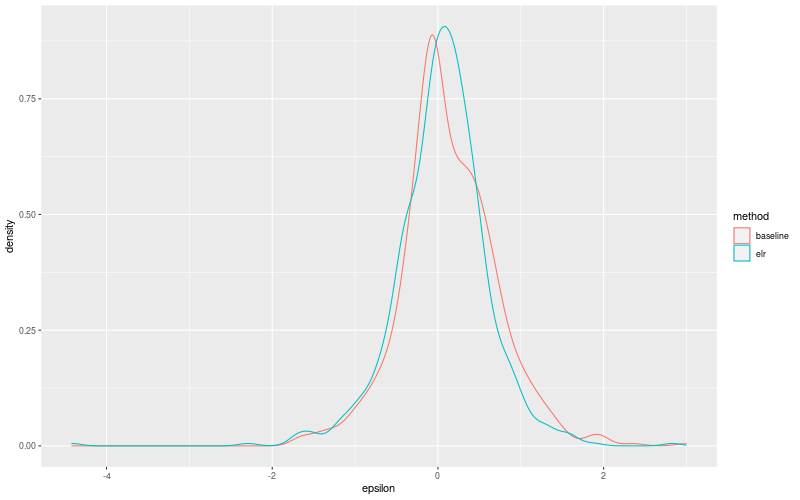
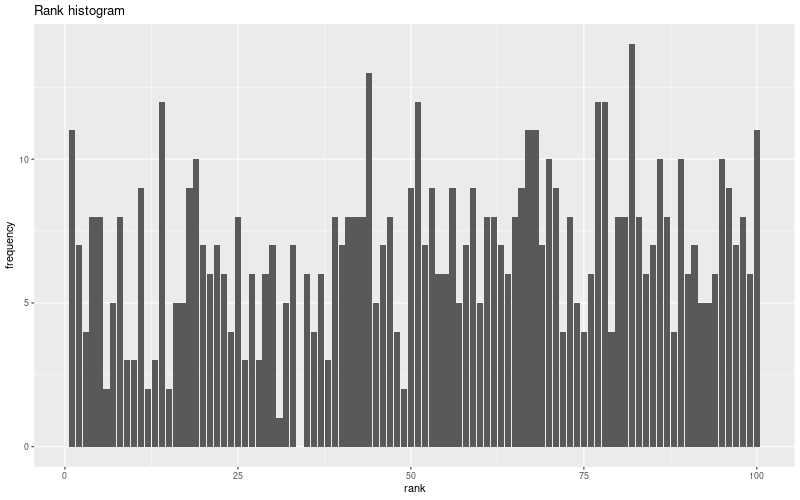
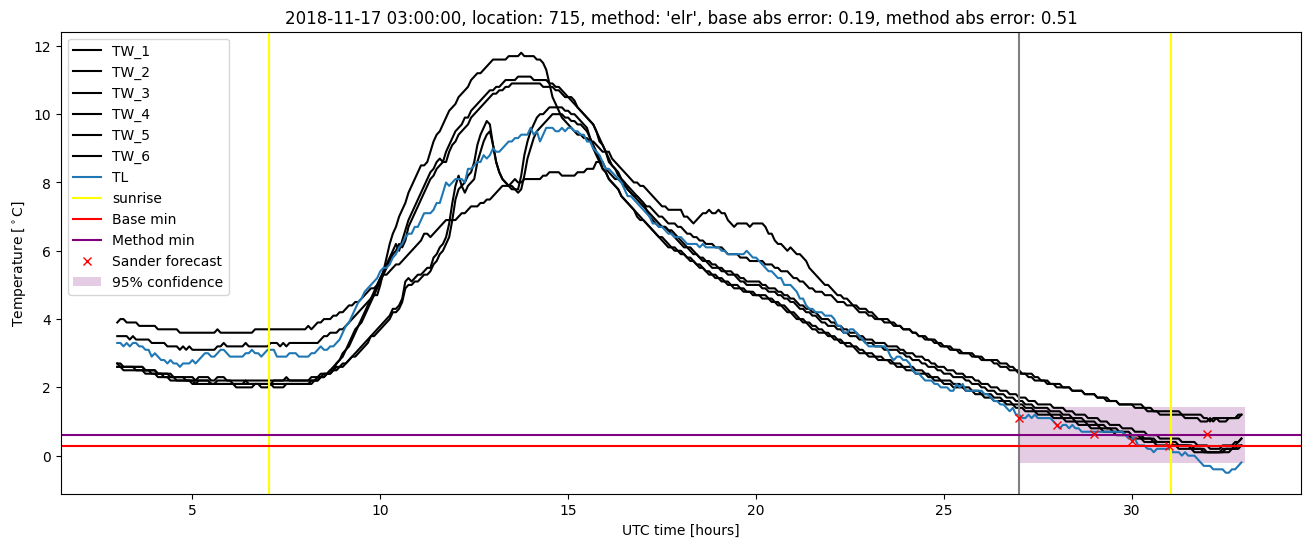
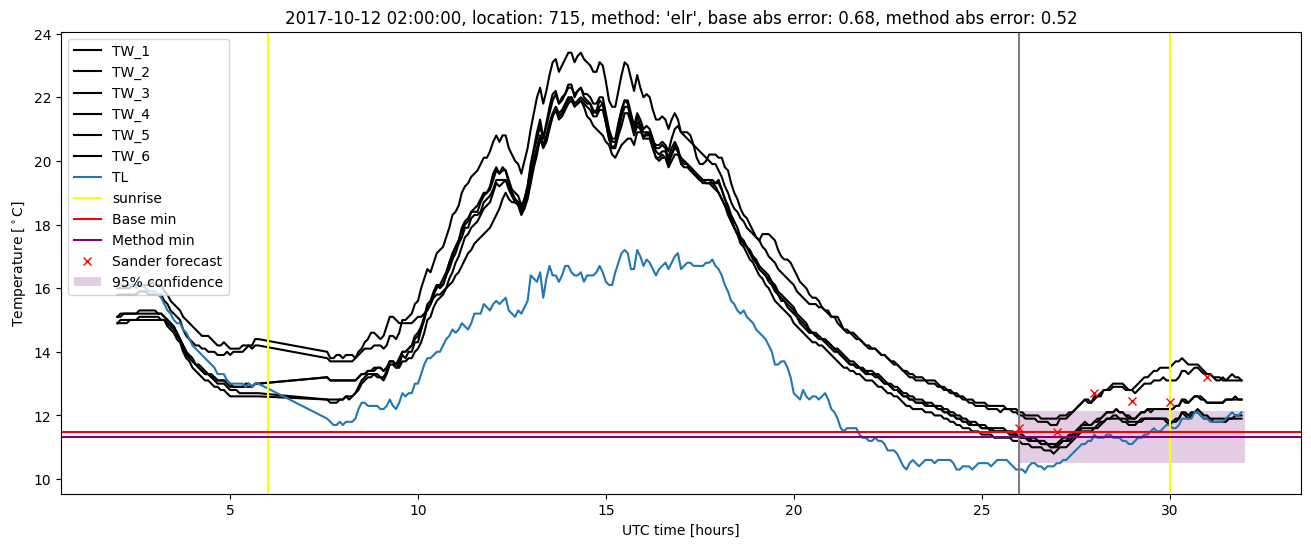
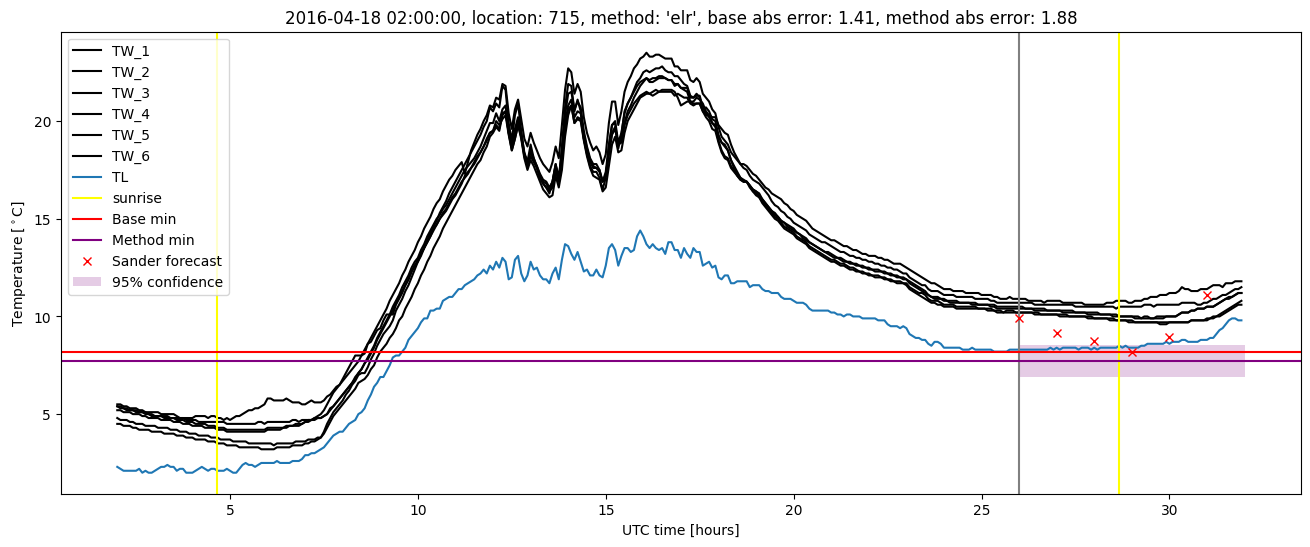
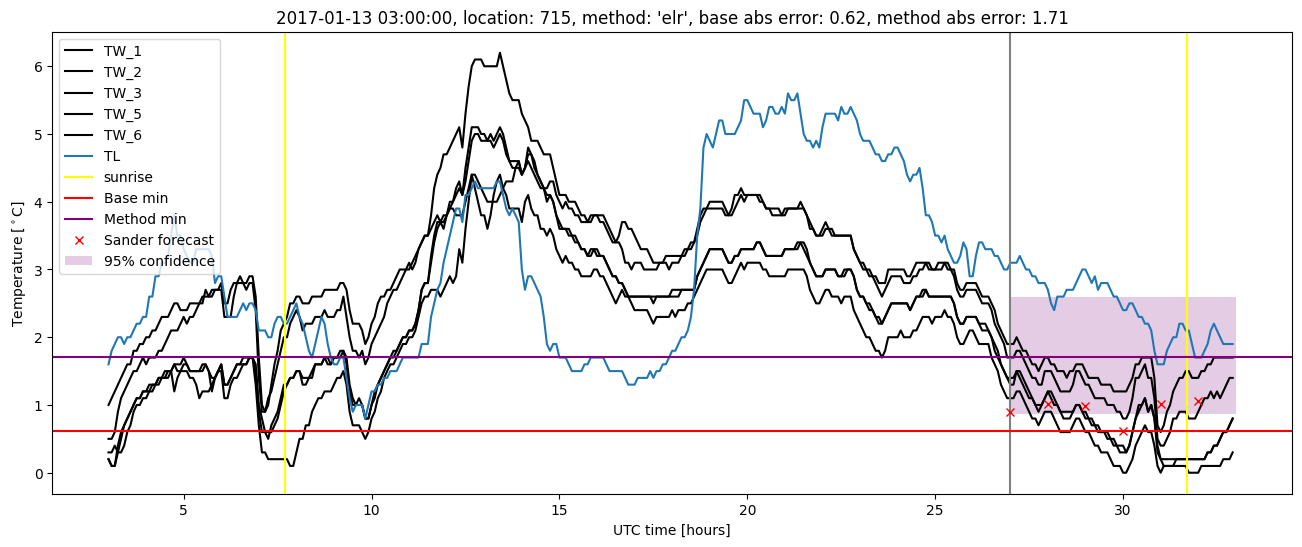
Extended logistic regression plots