GMS location: 714
Random forest results
| names |
period |
power |
significance |
meanSquareError |
absError |
maxError |
CRPS |
IGN |
| baseline |
winter 2016 |
0.984 |
0.056 |
0.302 |
0.412 |
1.862 |
NaN |
NaN |
| forest |
winter 2016 |
0.995 |
0.167 |
0.220 |
0.363 |
1.659 |
0.431 |
3.123 |
| baseline |
winter 2017 |
0.992 |
0.161 |
0.344 |
0.463 |
1.778 |
NaN |
NaN |
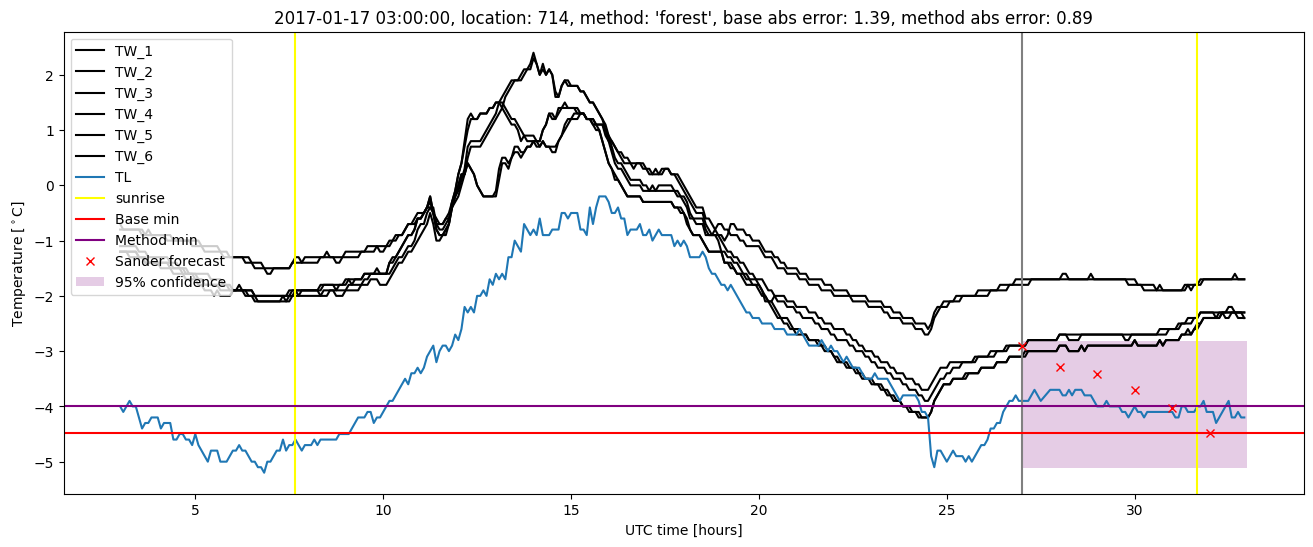
| forest |
winter 2017 |
0.984 |
0.097 |
0.250 |
0.383 |
1.440 |
0.440 |
4.910 |
| baseline |
winter 2018 |
0.985 |
0.111 |
0.392 |
0.472 |
2.364 |
NaN |
NaN |
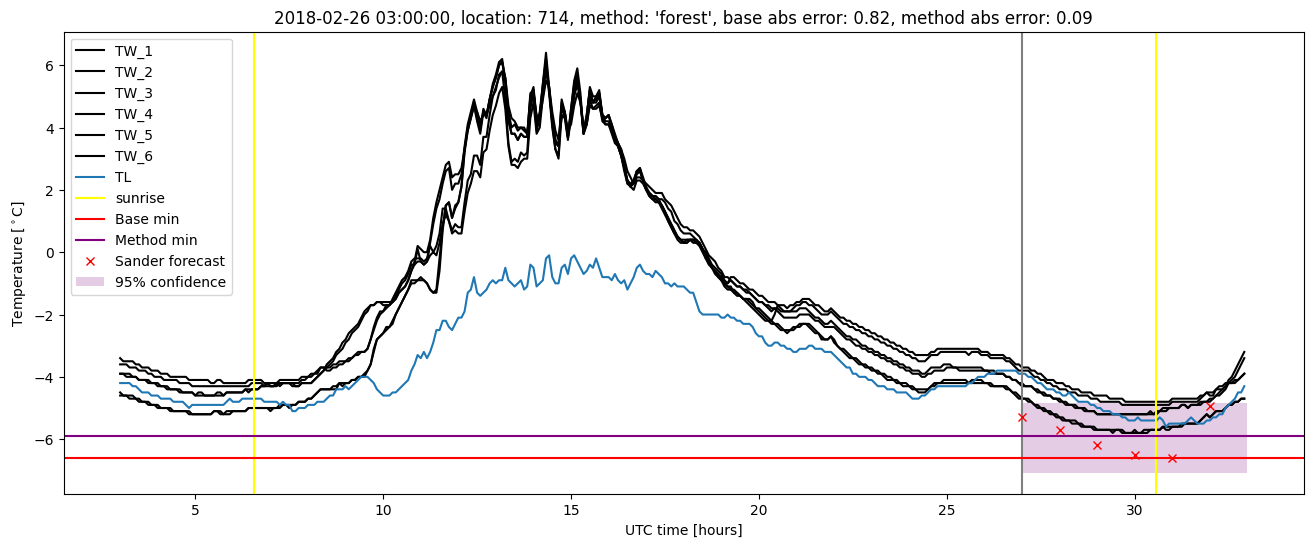
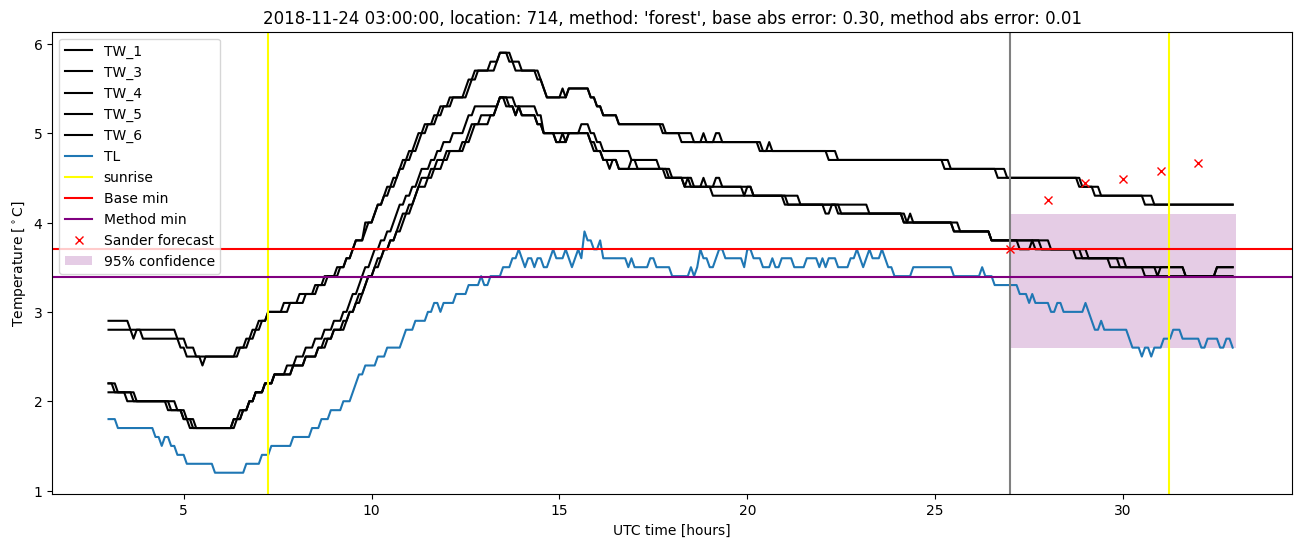
| forest |
winter 2018 |
0.993 |
0.111 |
0.326 |
0.402 |
2.584 |
0.435 |
3.478 |
| baseline |
winter 2019 |
0.974 |
0.000e+00 |
0.332 |
0.443 |
1.851 |
NaN |
NaN |
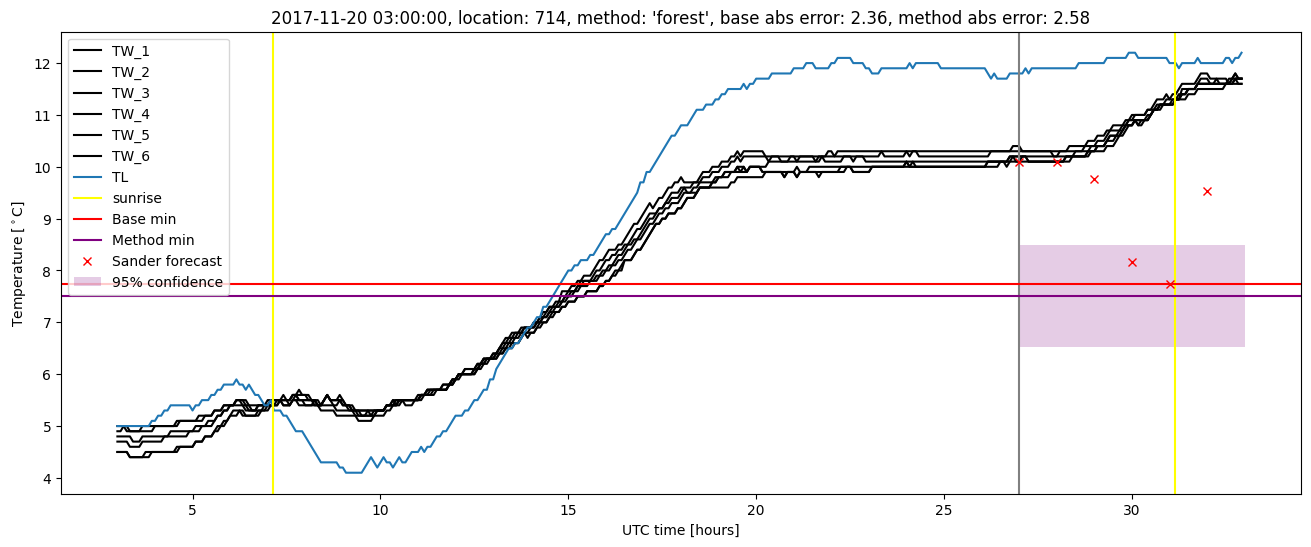
| forest |
winter 2019 |
0.974 |
0.083 |
0.226 |
0.365 |
1.561 |
0.424 |
3.322 |
| baseline |
all |
0.984 |
0.102 |
0.341 |
0.445 |
2.364 |
NaN |
NaN |
| forest |
all |
0.988 |
0.114 |
0.255 |
0.378 |
2.584 |
0.433 |
3.672 |
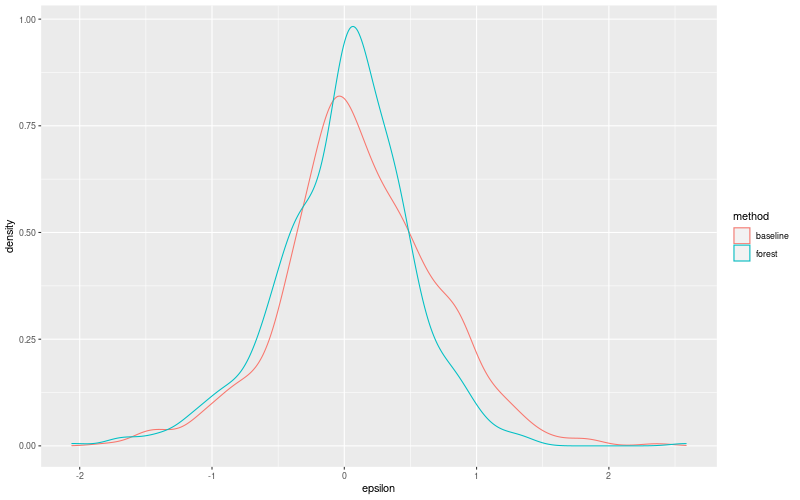
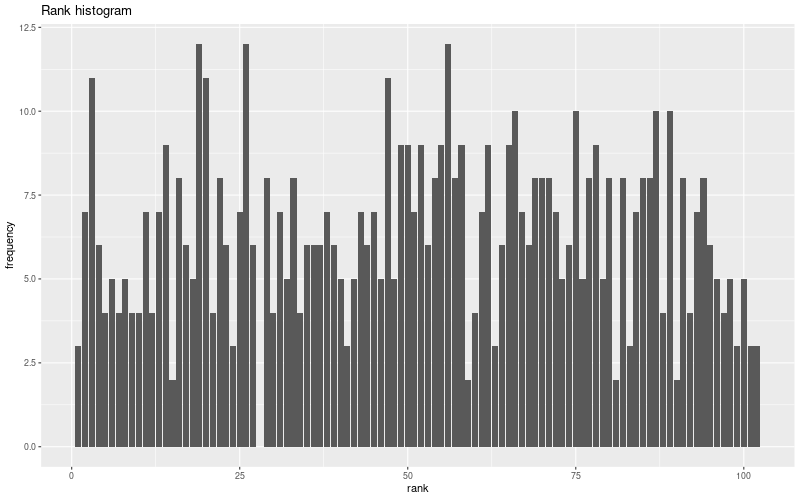
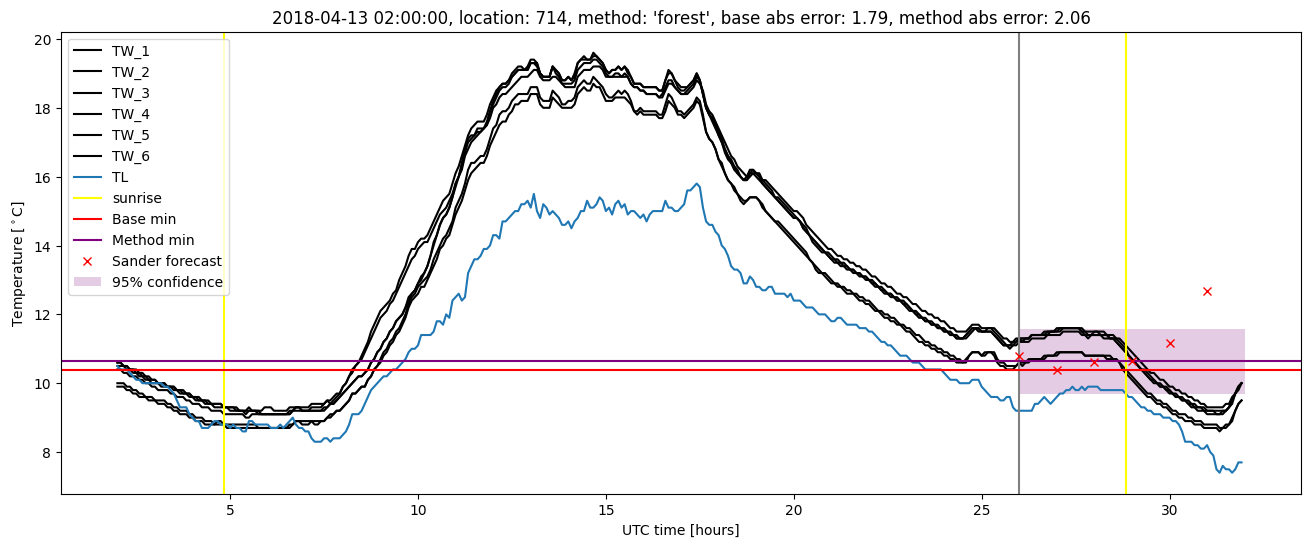
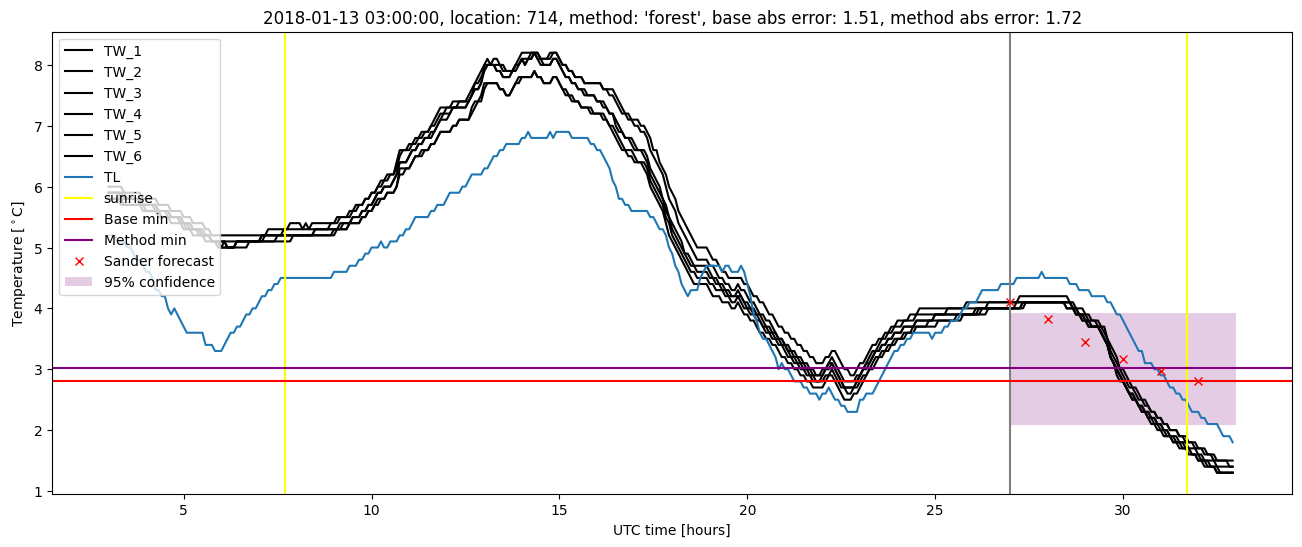
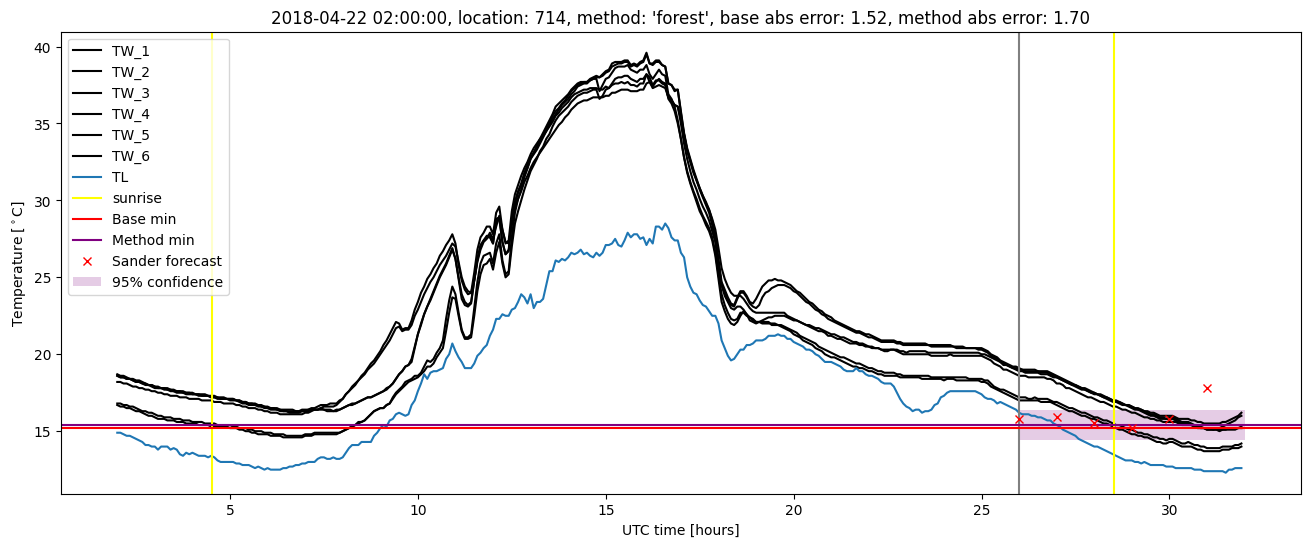
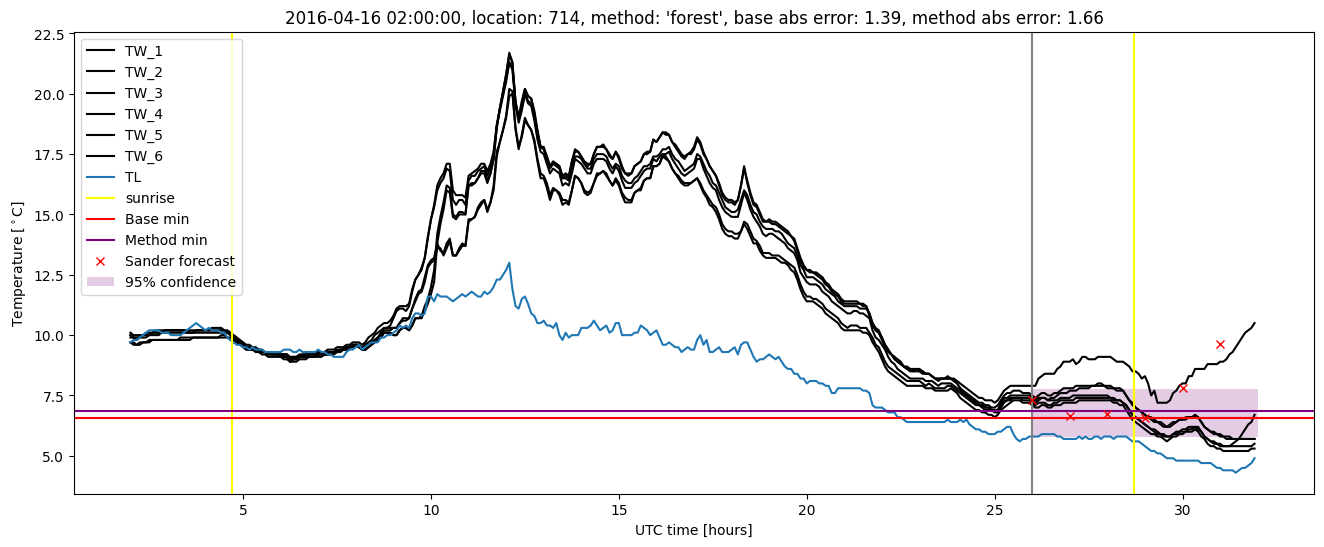
Random forest plots
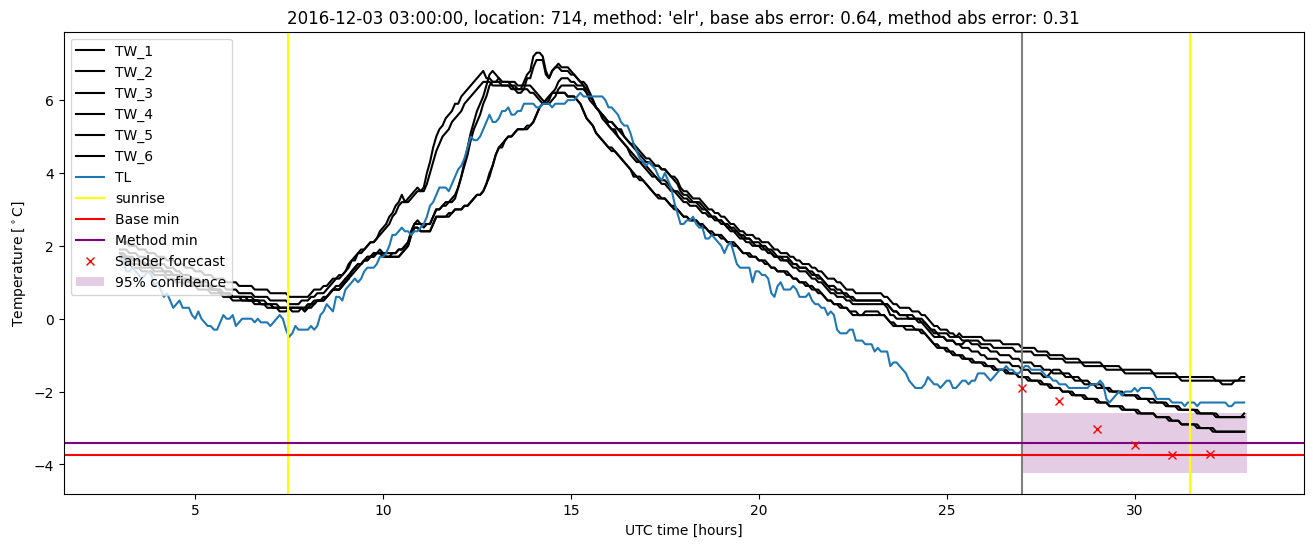
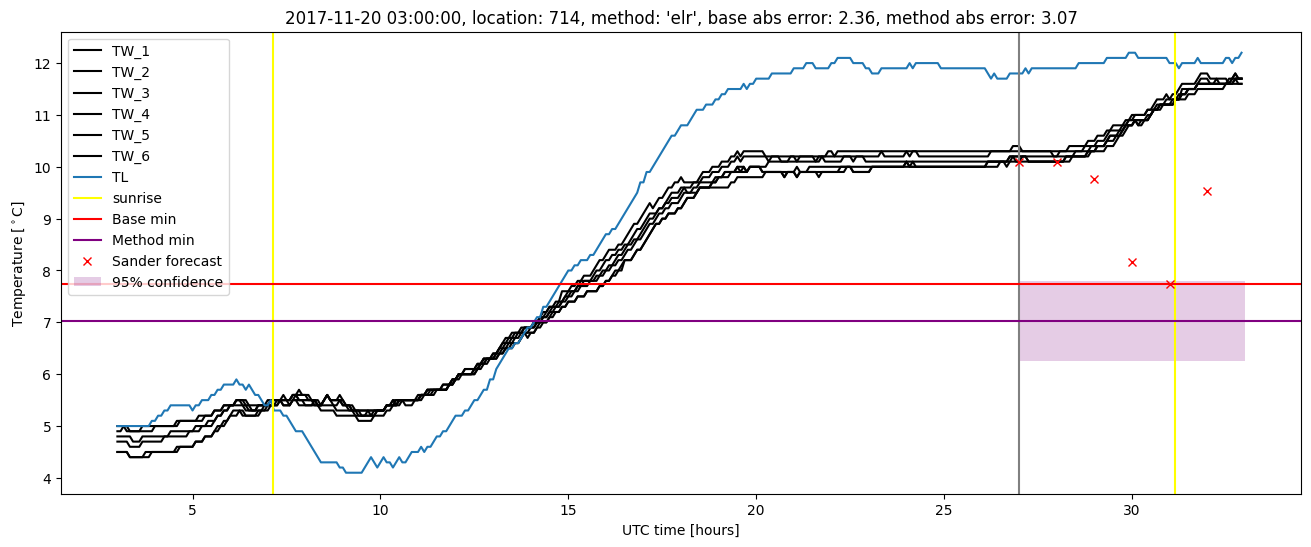
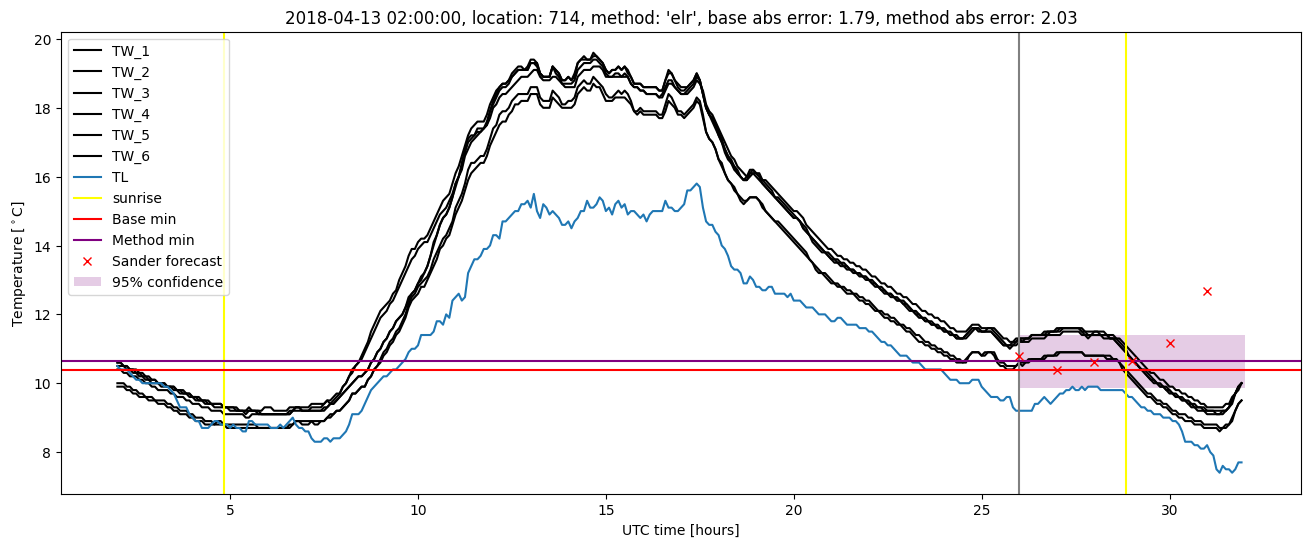
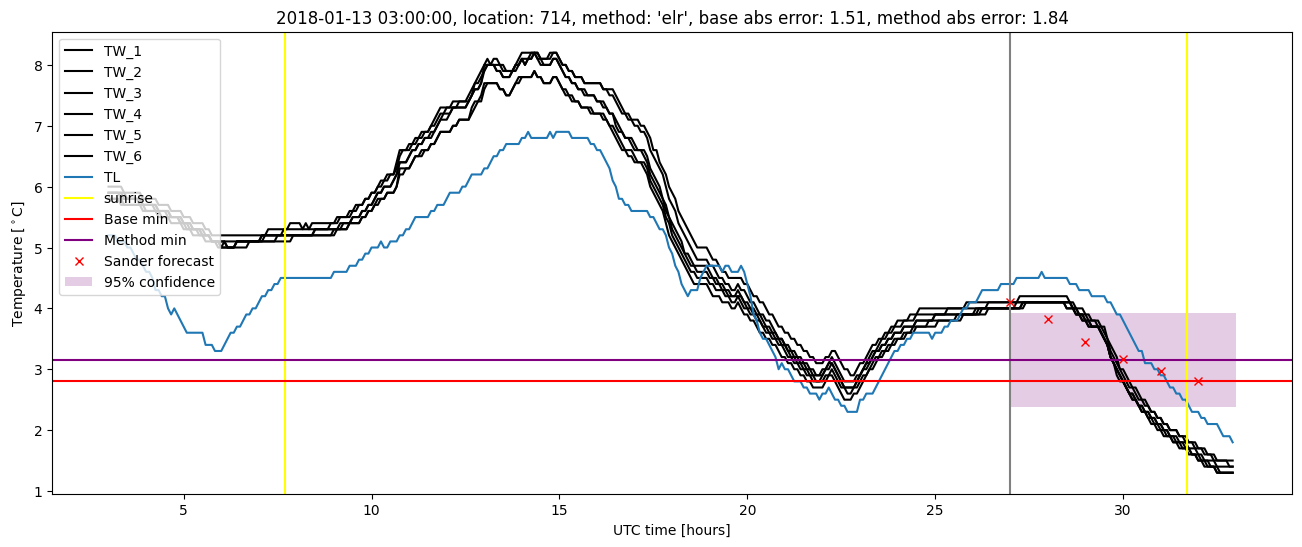
Extended logistic regression results
| names |
period |
power |
significance |
meanSquareError |
absError |
maxError |
CRPS |
IGN |
| baseline |
winter 2016 |
0.984 |
0.056 |
0.302 |
0.412 |
1.862 |
NaN |
NaN |
| elr |
winter 2016 |
0.995 |
0.167 |
0.233 |
0.377 |
1.656 |
0.499 |
4.729 |
| baseline |
winter 2017 |
0.992 |
0.161 |
0.344 |
0.463 |
1.778 |
NaN |
NaN |
| elr |
winter 2017 |
0.984 |
0.097 |
0.260 |
0.408 |
1.521 |
0.508 |
4.837 |
| baseline |
winter 2018 |
0.985 |
0.111 |
0.392 |
0.472 |
2.364 |
NaN |
NaN |
| elr |
winter 2018 |
0.985 |
0.148 |
0.348 |
0.415 |
3.072 |
0.501 |
5.752 |
| baseline |
winter 2019 |
0.974 |
0.000e+00 |
0.332 |
0.443 |
1.851 |
NaN |
NaN |
| elr |
winter 2019 |
0.974 |
0.000e+00 |
0.257 |
0.401 |
1.715 |
0.492 |
4.562 |
| baseline |
all |
0.984 |
0.102 |
0.341 |
0.445 |
2.364 |
NaN |
NaN |
| elr |
all |
0.986 |
0.114 |
0.273 |
0.399 |
3.072 |
0.500 |
4.980 |
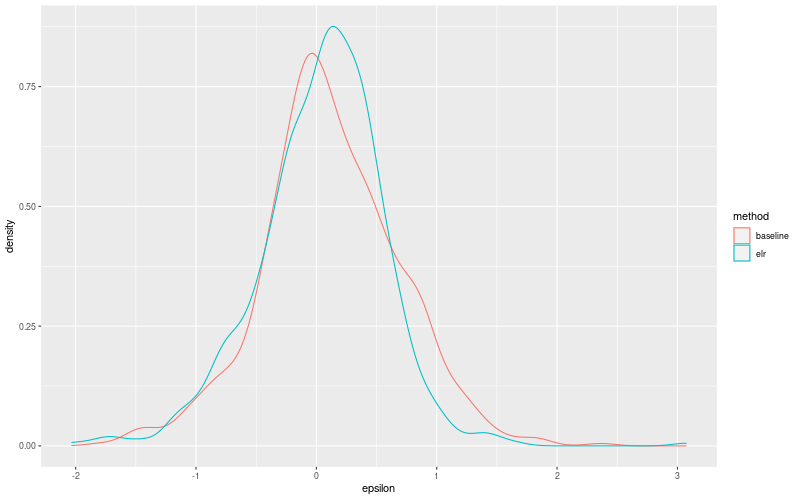
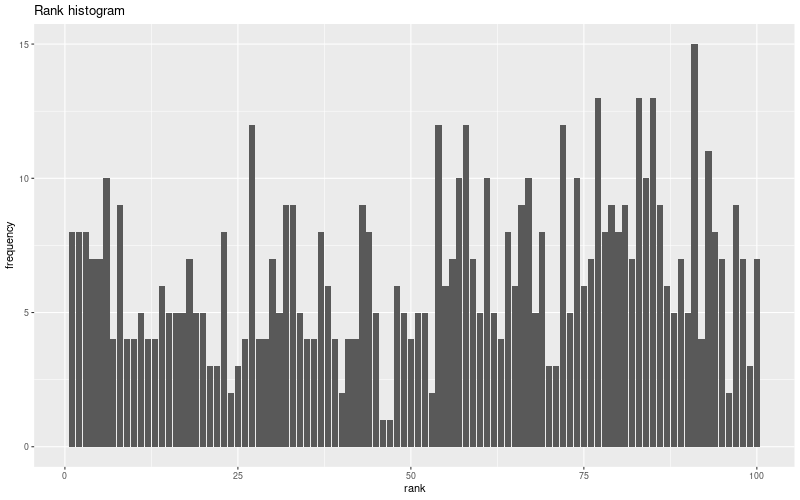
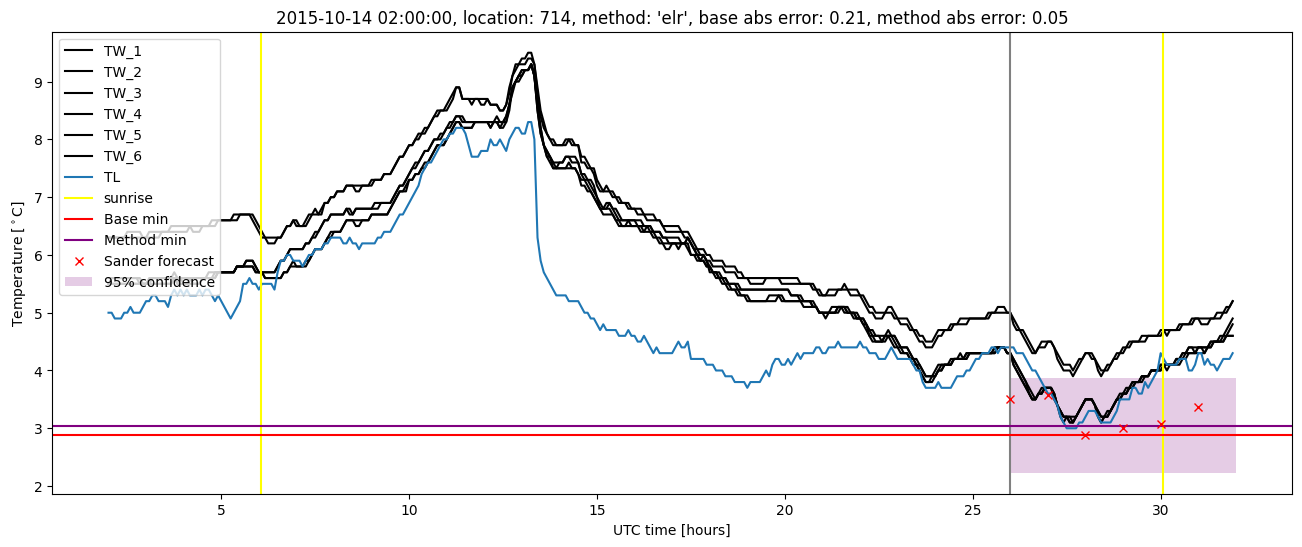
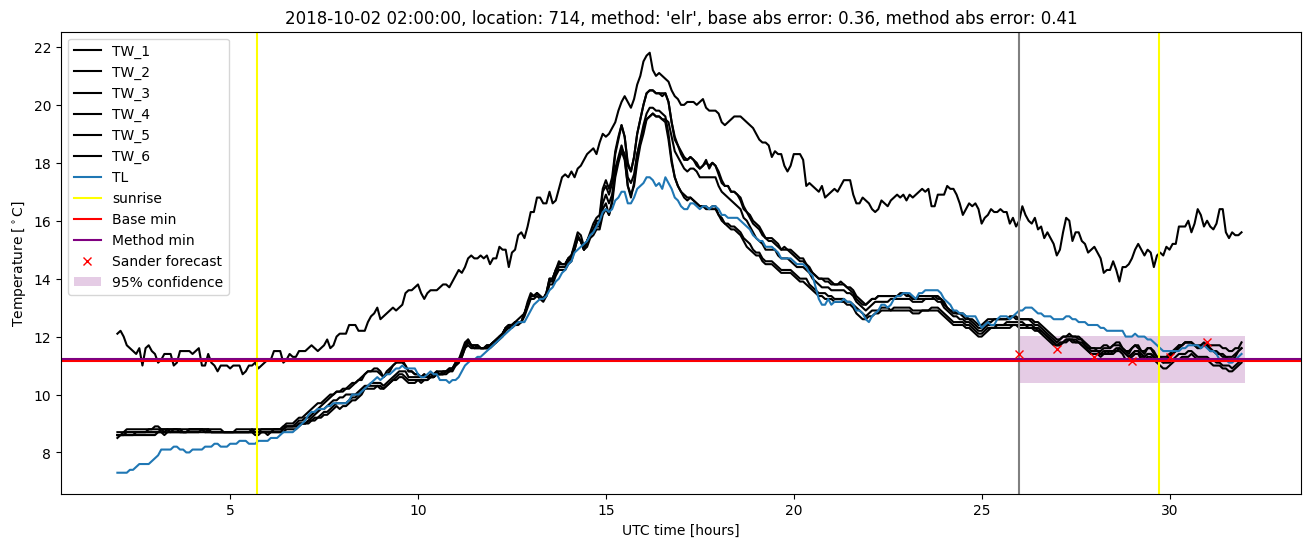
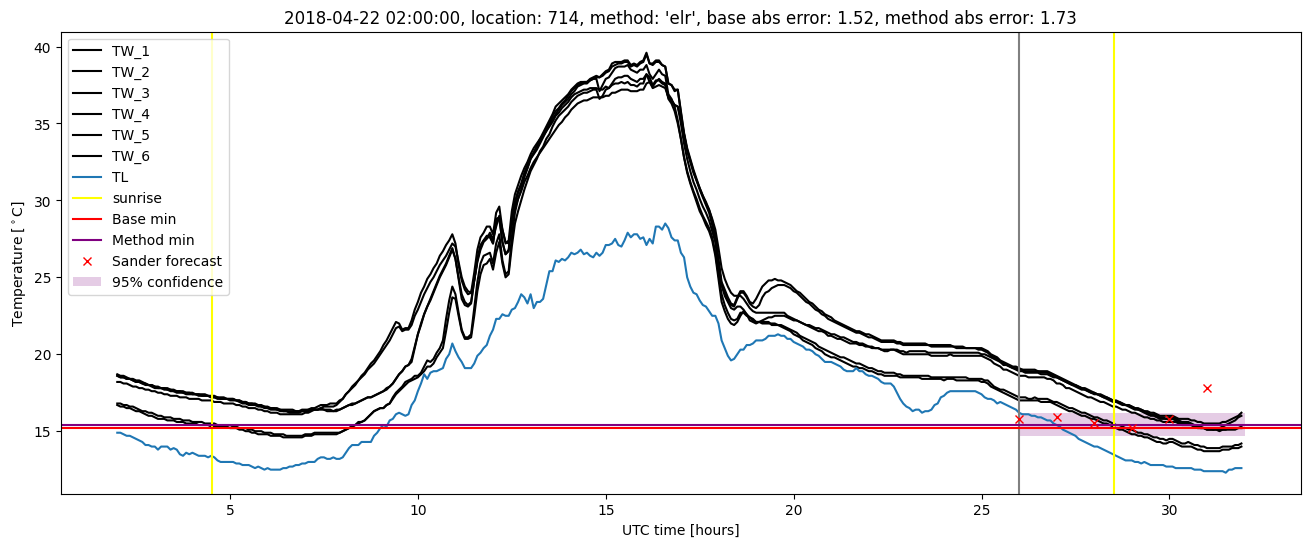
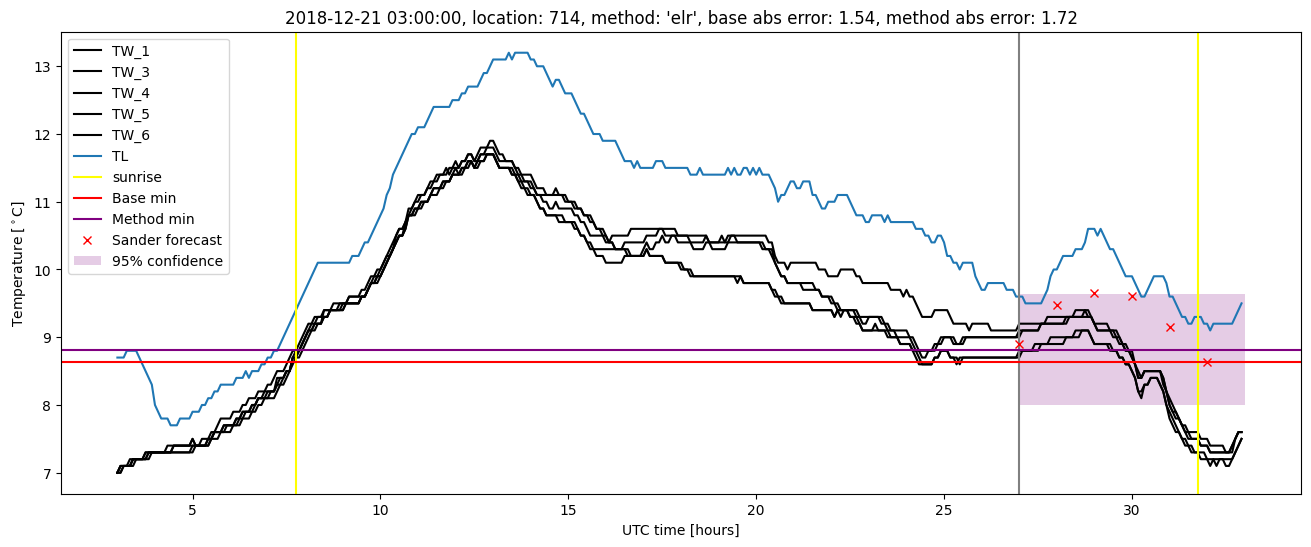
Extended logistic regression plots