GMS location: 713
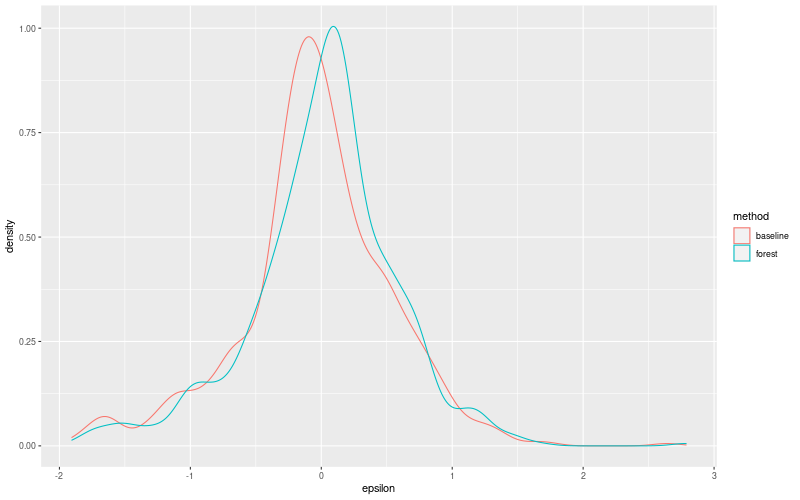
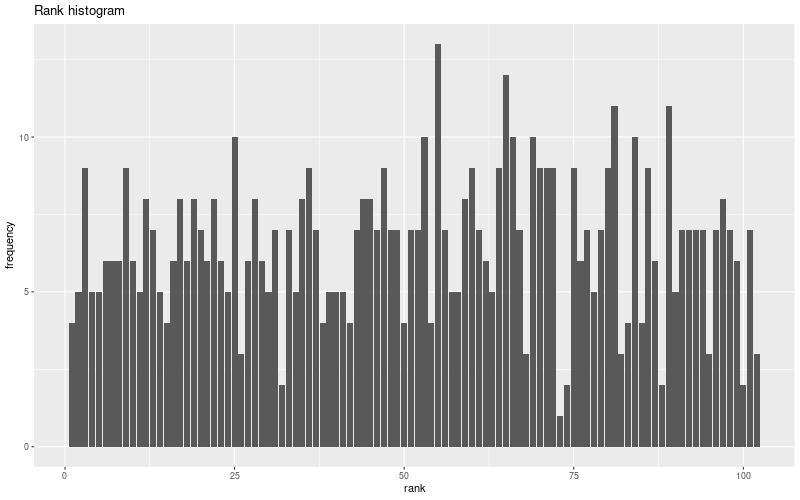
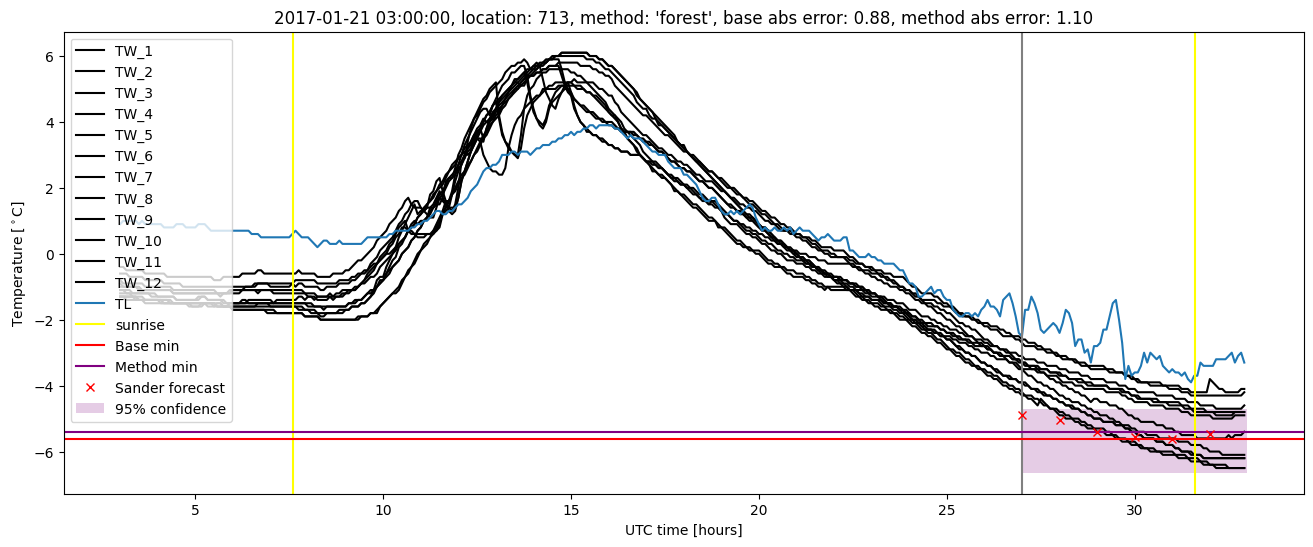
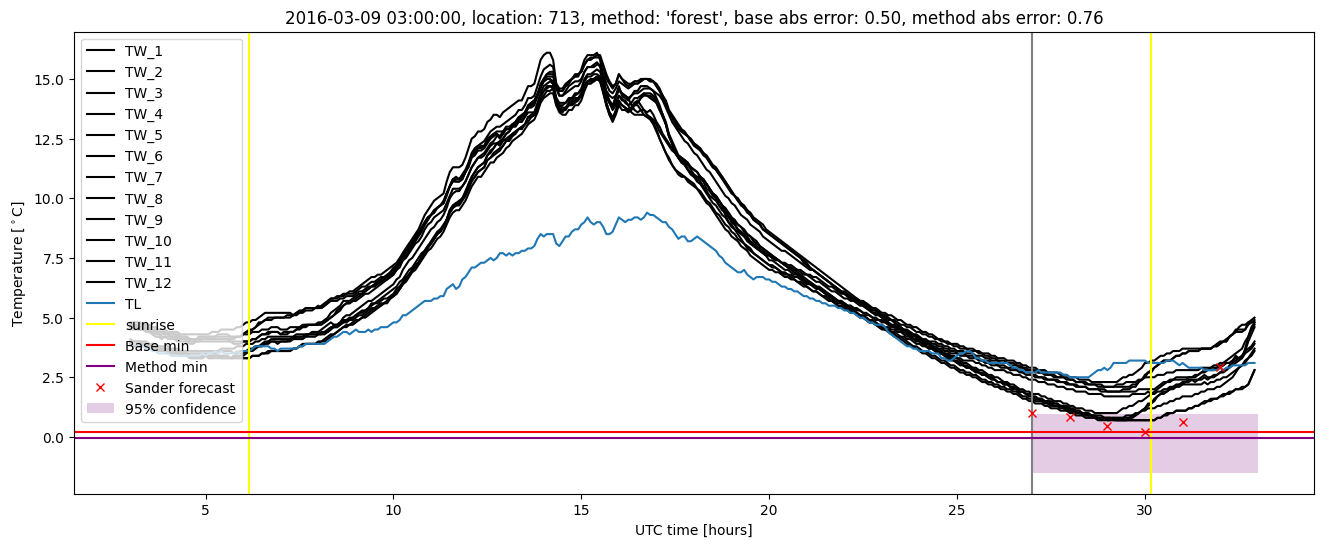
Random forest results
| names |
period |
power |
significance |
meanSquareError |
absError |
maxError |
CRPS |
IGN |
| baseline |
winter 2016 |
0.989 |
0.000e+00 |
0.297 |
0.402 |
1.751 |
NaN |
NaN |
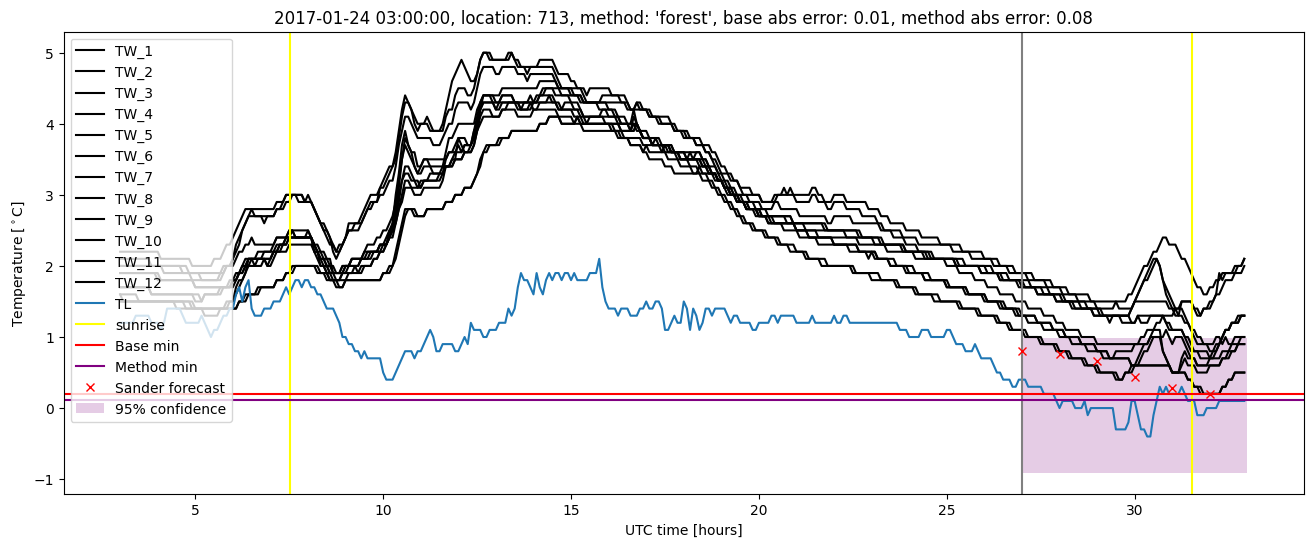
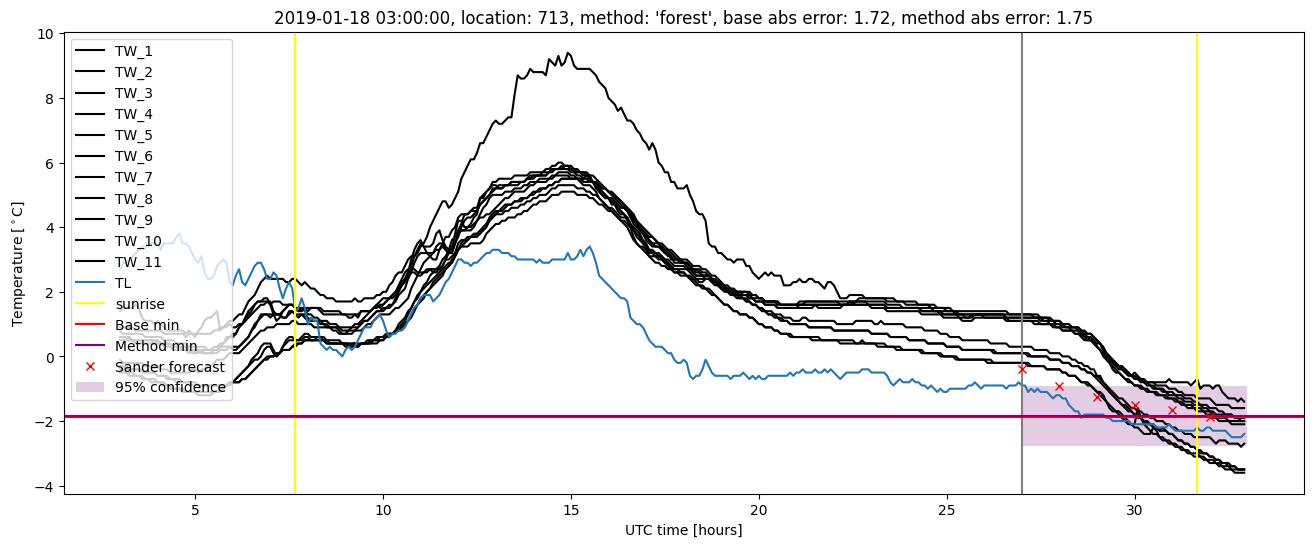
| forest |
winter 2016 |
0.984 |
0.000e+00 |
0.290 |
0.402 |
1.720 |
0.492 |
2.767 |
| baseline |
winter 2017 |
0.984 |
0.067 |
0.336 |
0.441 |
1.729 |
NaN |
NaN |
| forest |
winter 2017 |
0.976 |
0.000e+00 |
0.317 |
0.428 |
1.657 |
0.469 |
2.848 |
| baseline |
winter 2018 |
0.986 |
0.062 |
0.317 |
0.399 |
2.640 |
NaN |
NaN |
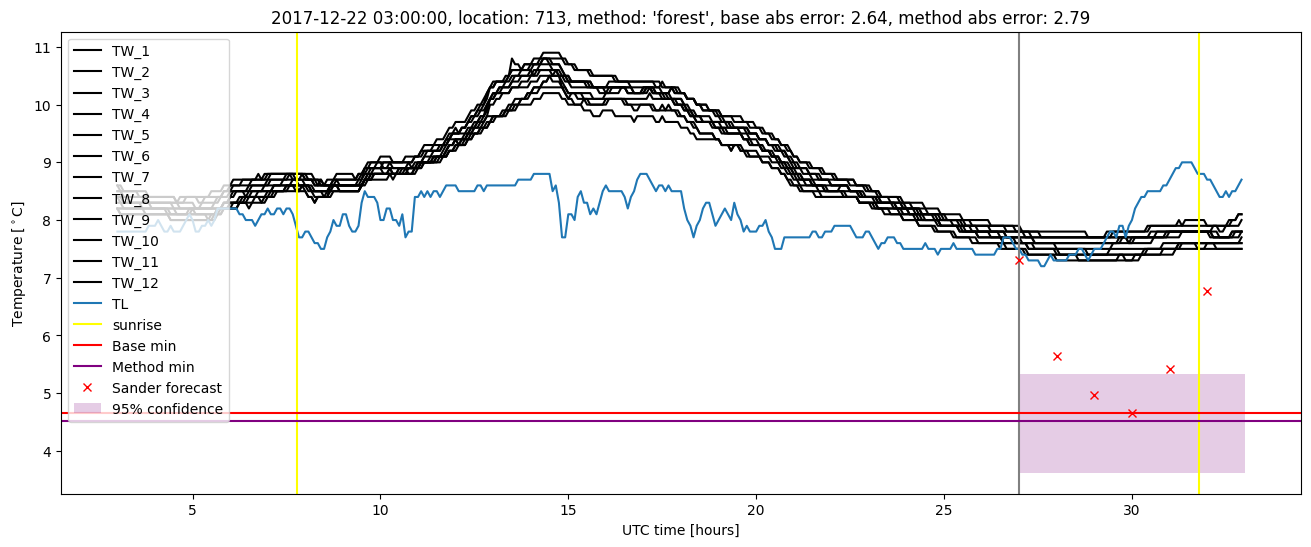
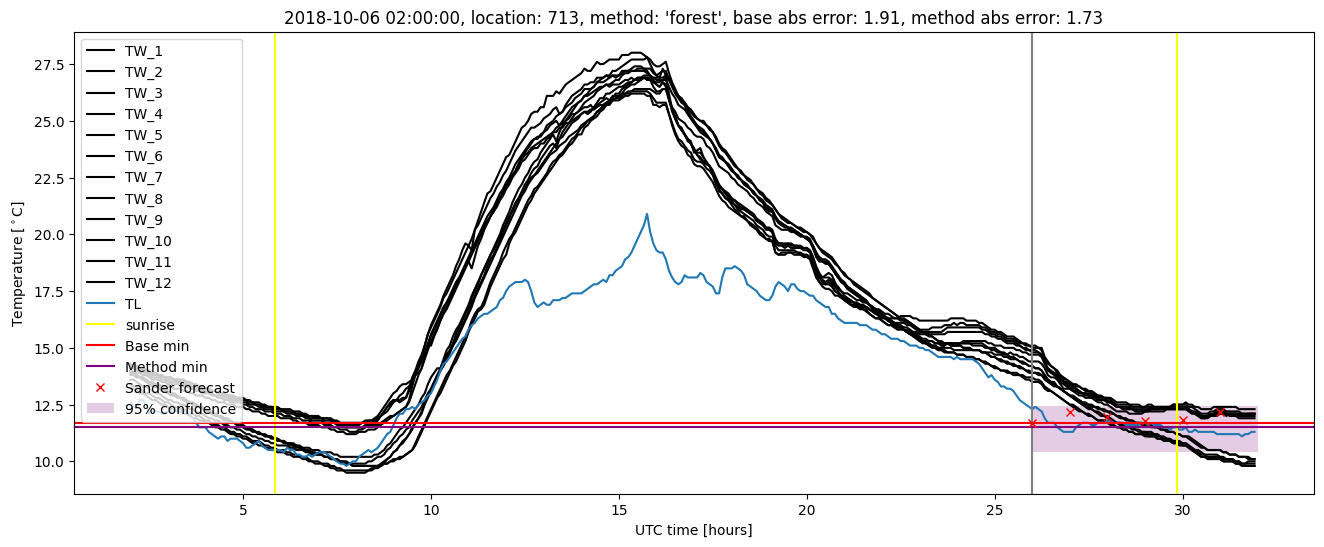
| forest |
winter 2018 |
0.986 |
0.094 |
0.301 |
0.392 |
2.787 |
0.498 |
3.191 |
| baseline |
winter 2019 |
0.992 |
0.154 |
0.442 |
0.479 |
1.905 |
NaN |
NaN |
| forest |
winter 2019 |
0.992 |
0.154 |
0.392 |
0.450 |
1.867 |
0.490 |
2.913 |
| baseline |
all |
0.988 |
0.065 |
0.340 |
0.425 |
2.640 |
NaN |
NaN |
| forest |
all |
0.984 |
0.054 |
0.319 |
0.415 |
2.787 |
0.488 |
2.926 |
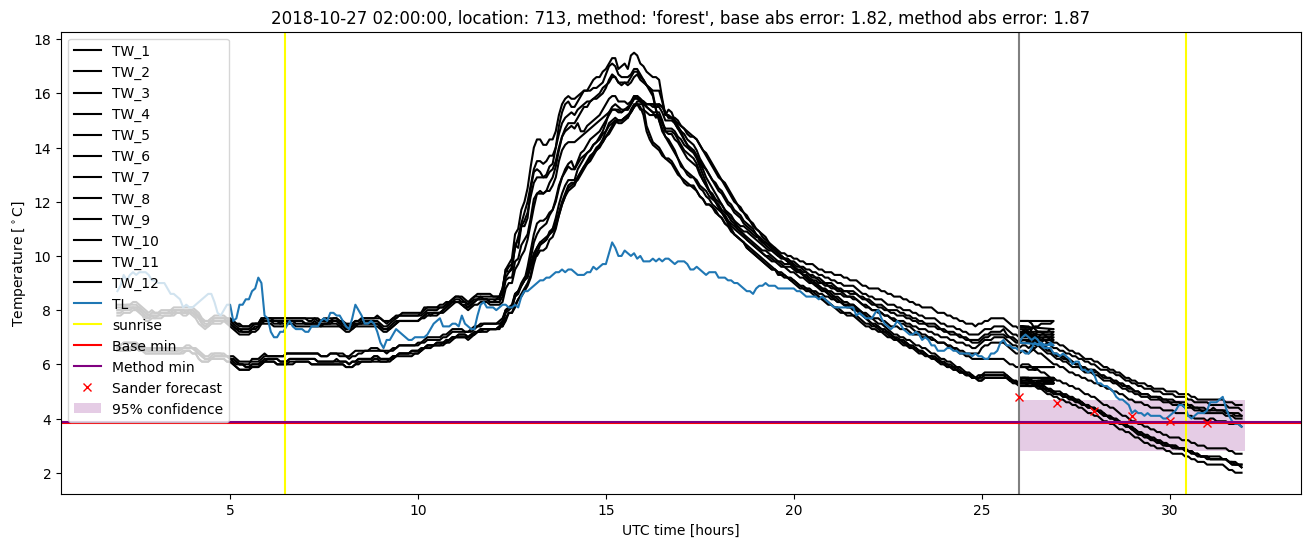
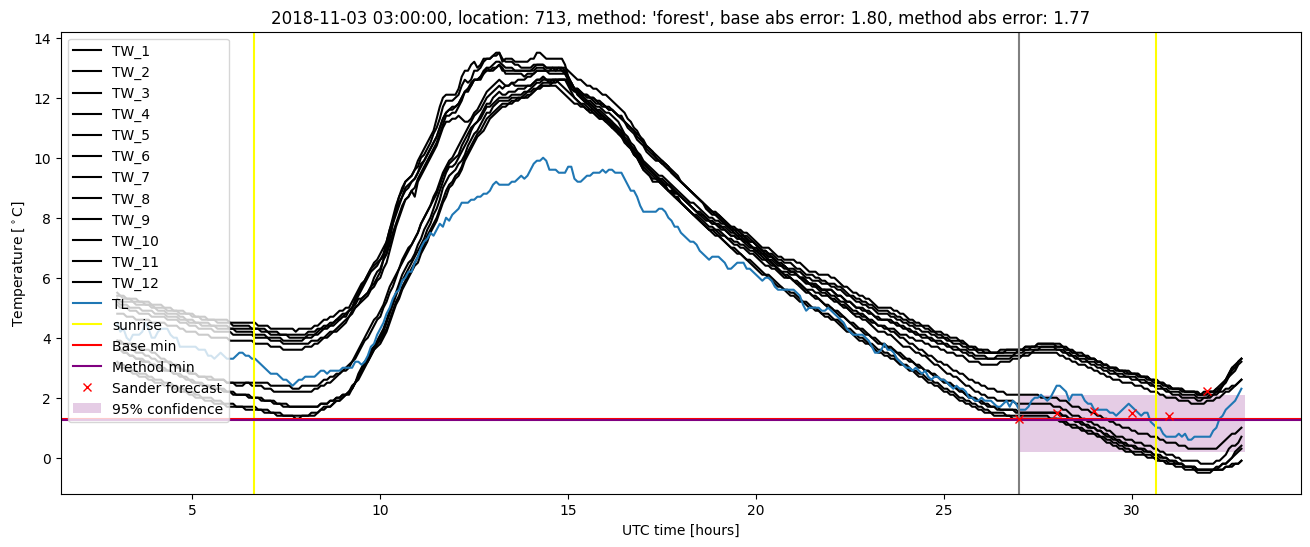
Random forest plots
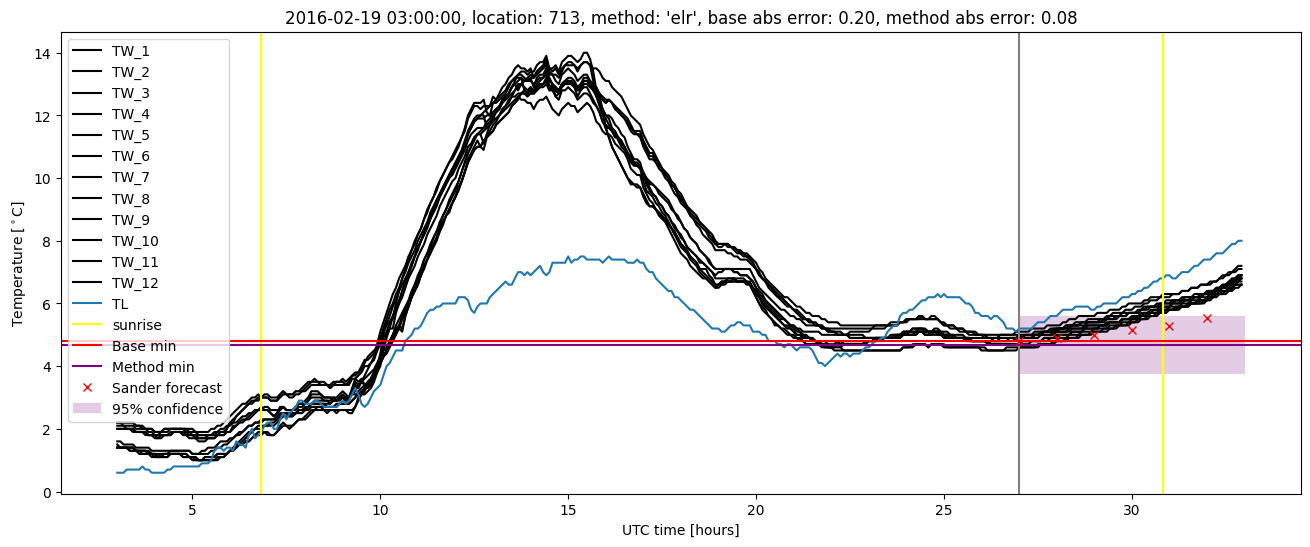
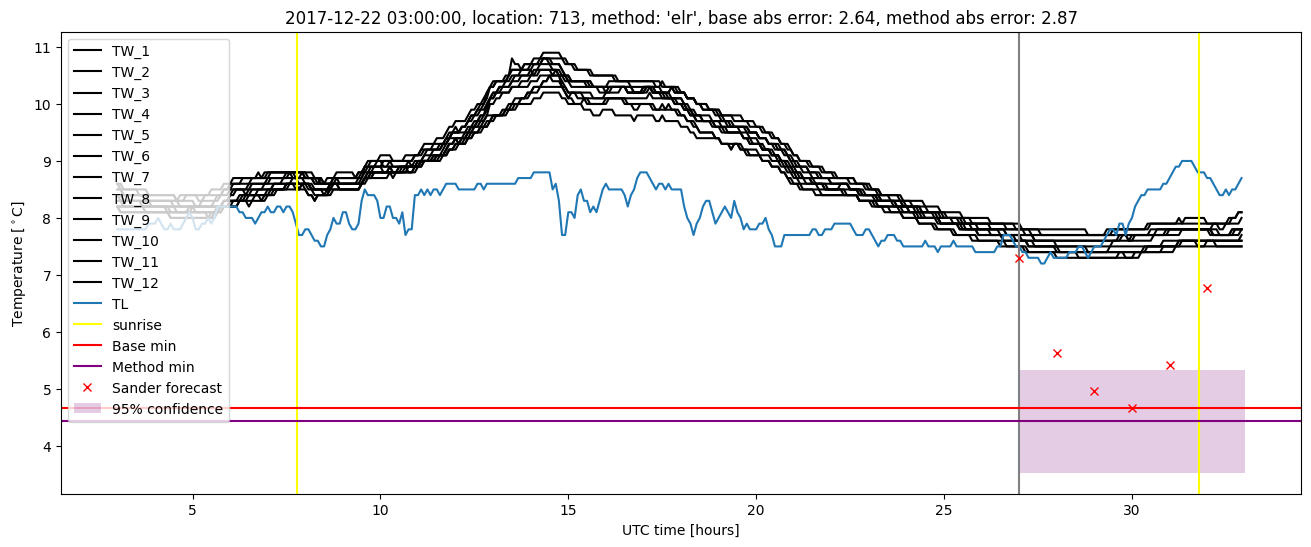
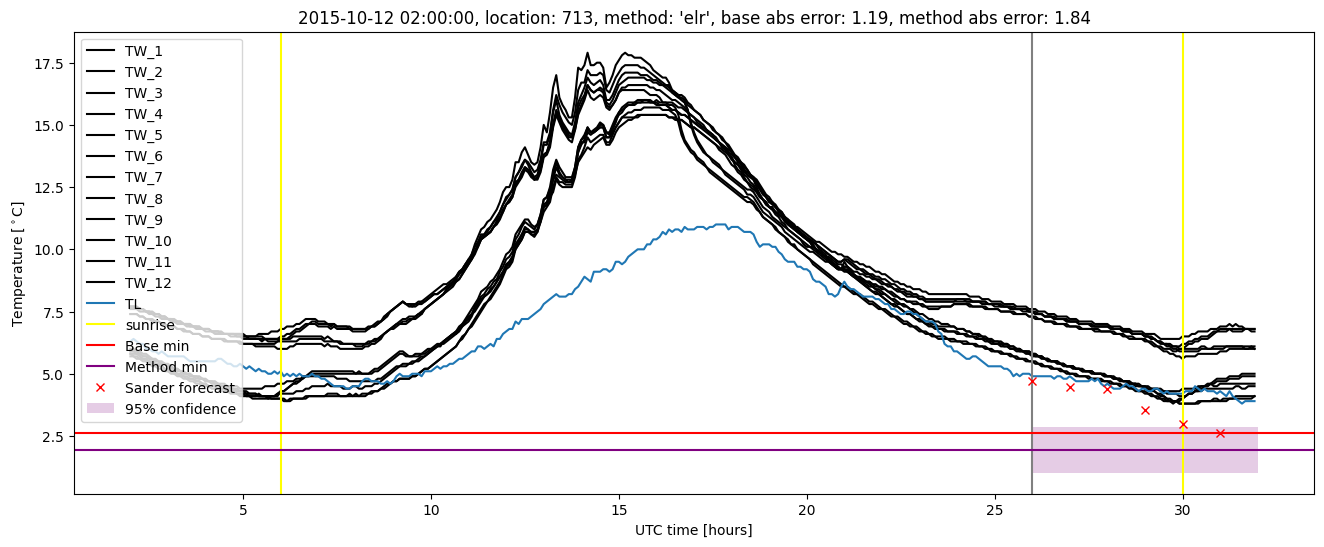
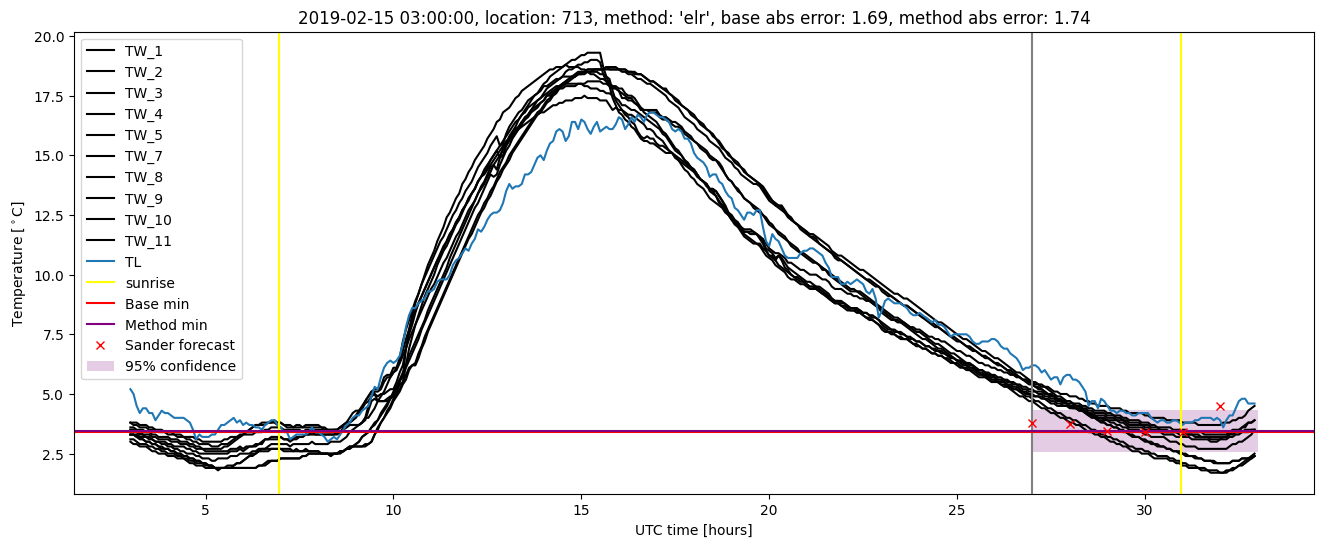
Extended logistic regression results
| names |
period |
power |
significance |
meanSquareError |
absError |
maxError |
CRPS |
IGN |
| baseline |
winter 2016 |
0.989 |
0.000e+00 |
0.297 |
0.402 |
1.751 |
NaN |
NaN |
| elr |
winter 2016 |
0.979 |
0.000e+00 |
0.327 |
0.434 |
1.844 |
0.574 |
4.016 |
| baseline |
winter 2017 |
0.984 |
0.067 |
0.336 |
0.441 |
1.729 |
NaN |
NaN |
| elr |
winter 2017 |
0.976 |
0.033 |
0.348 |
0.458 |
1.592 |
0.528 |
3.901 |
| baseline |
winter 2018 |
0.986 |
0.062 |
0.317 |
0.399 |
2.640 |
NaN |
NaN |
| elr |
winter 2018 |
0.979 |
0.062 |
0.320 |
0.407 |
2.867 |
0.553 |
4.082 |
| baseline |
winter 2019 |
0.992 |
0.154 |
0.442 |
0.479 |
1.905 |
NaN |
NaN |
| elr |
winter 2019 |
0.992 |
0.154 |
0.429 |
0.471 |
1.950 |
0.522 |
3.956 |
| baseline |
all |
0.988 |
0.065 |
0.340 |
0.425 |
2.640 |
NaN |
NaN |
| elr |
all |
0.981 |
0.054 |
0.350 |
0.440 |
2.867 |
0.548 |
3.995 |
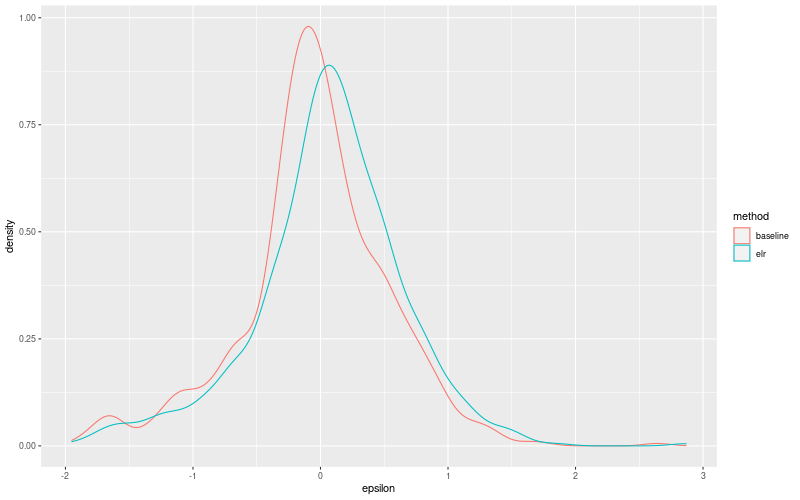
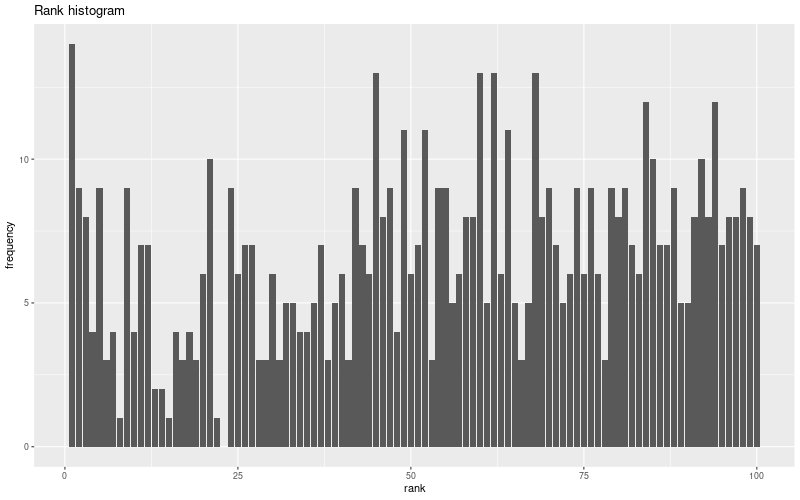
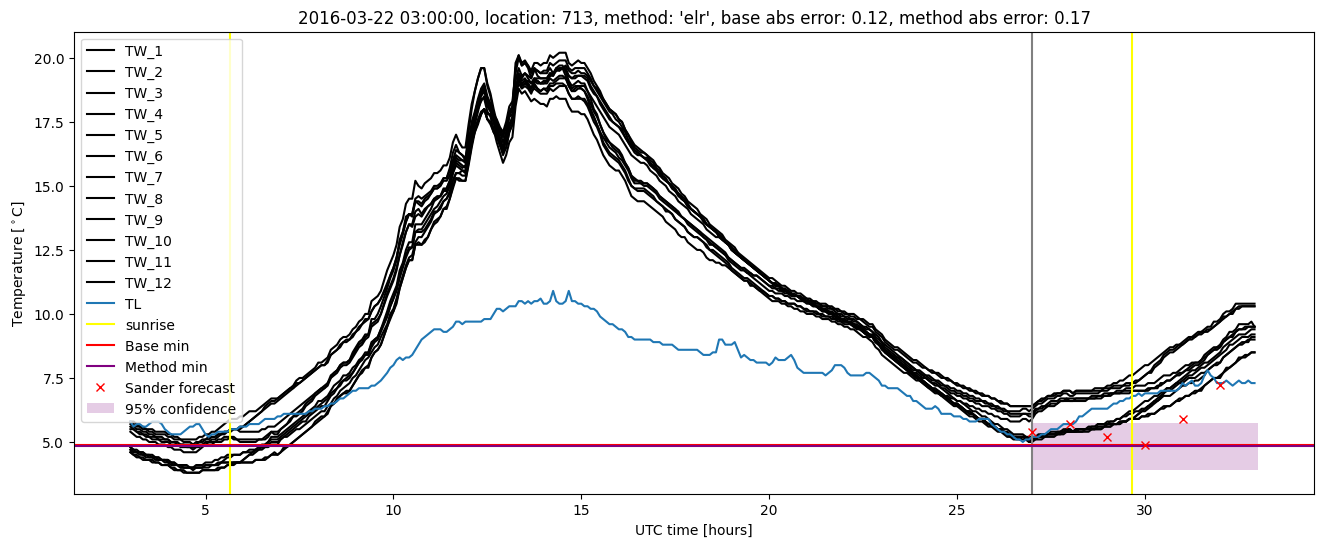
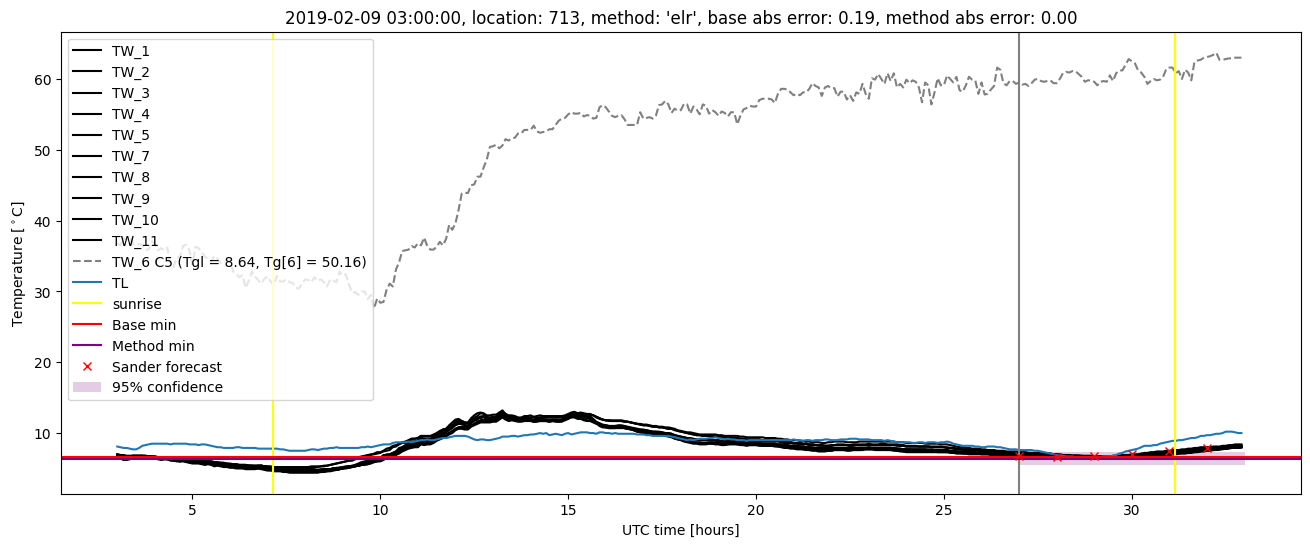
Extended logistic regression plots