GMS location: 712
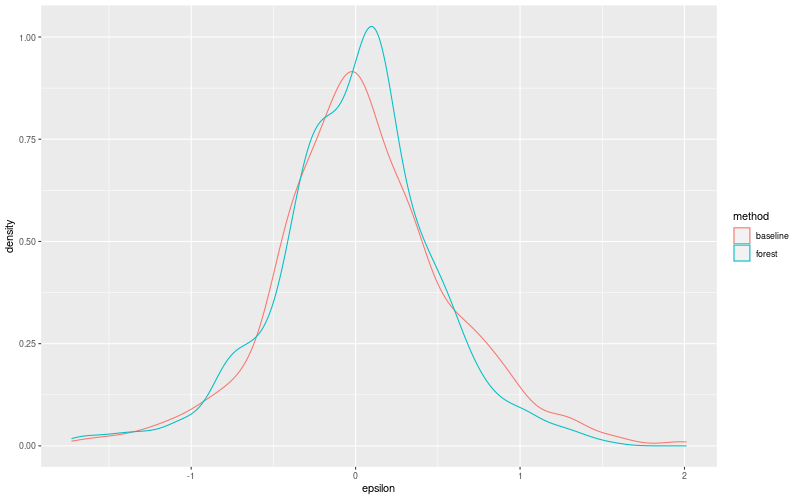
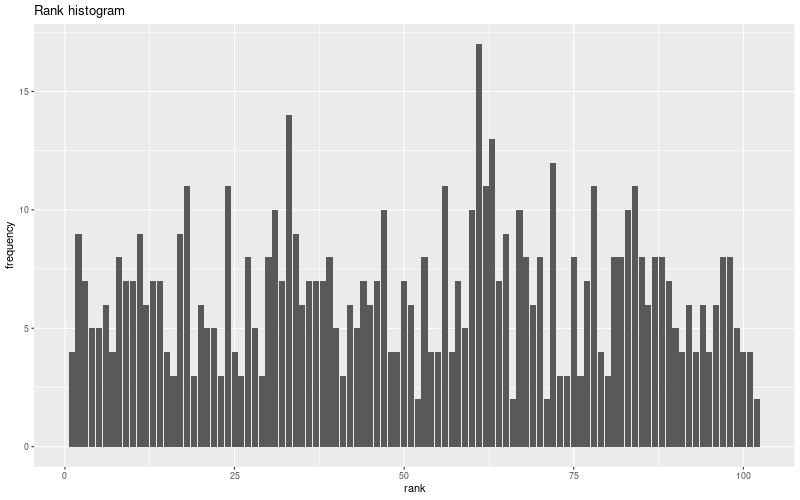
Random forest results
| names |
period |
power |
significance |
meanSquareError |
absError |
maxError |
CRPS |
IGN |
| baseline |
winter 2016 |
0.995 |
0.000e+00 |
0.288 |
0.405 |
1.636 |
NaN |
NaN |
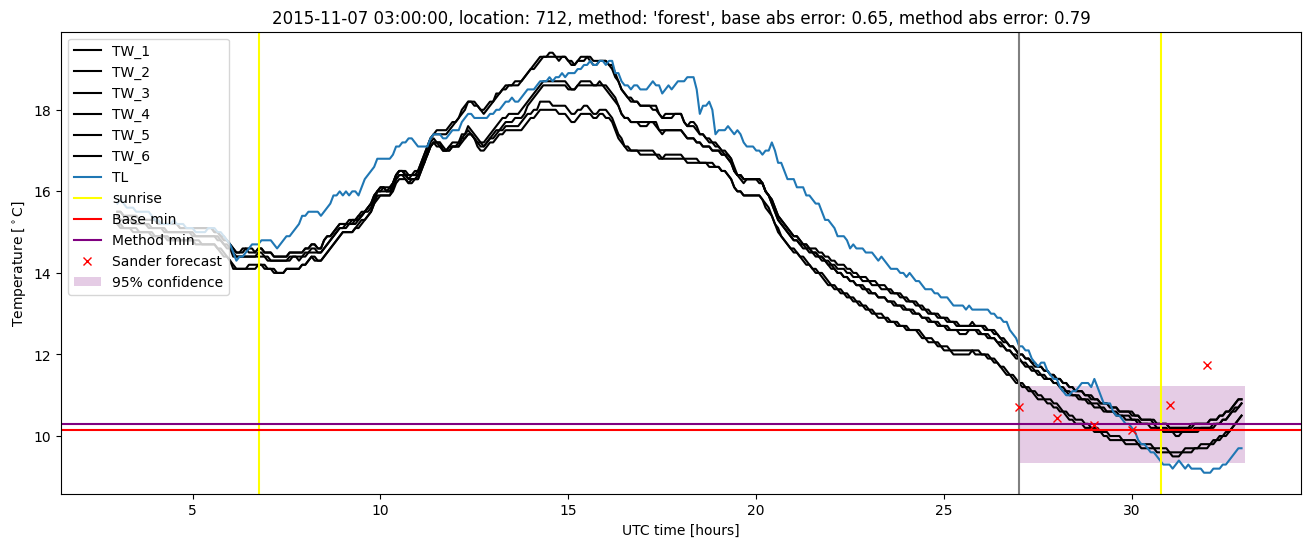
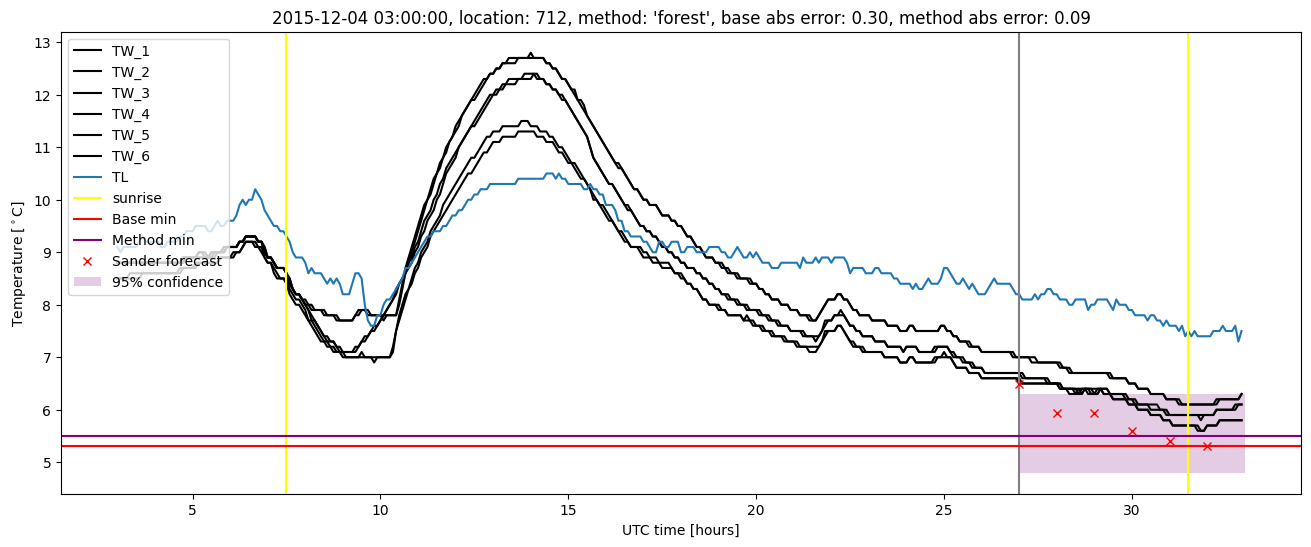
| forest |
winter 2016 |
1.000 |
0.000e+00 |
0.231 |
0.361 |
1.691 |
0.461 |
4.911 |
| baseline |
winter 2017 |
0.968 |
0.100 |
0.325 |
0.437 |
2.010 |
NaN |
NaN |
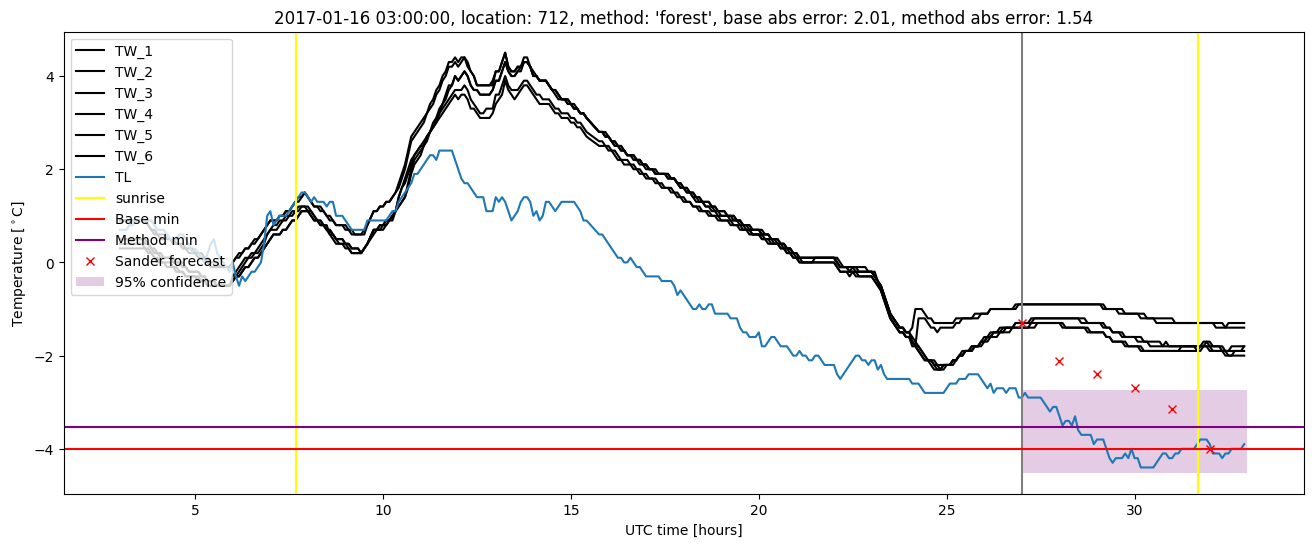
| forest |
winter 2017 |
0.976 |
0.033 |
0.249 |
0.381 |
1.536 |
0.470 |
4.931 |
| baseline |
winter 2018 |
0.986 |
0.115 |
0.279 |
0.410 |
1.726 |
NaN |
NaN |
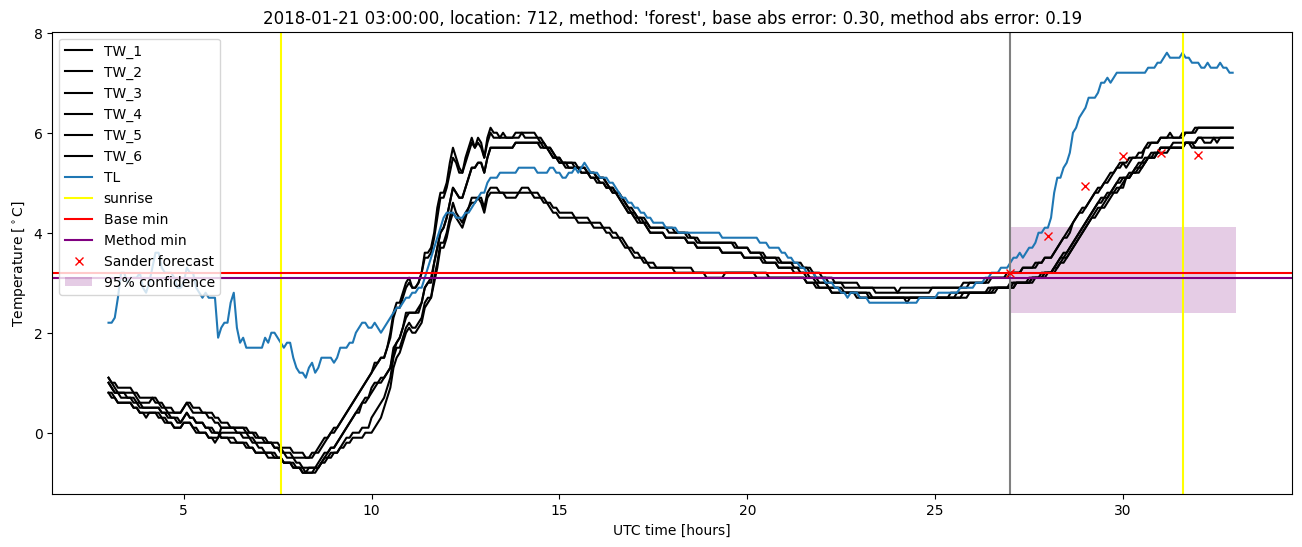
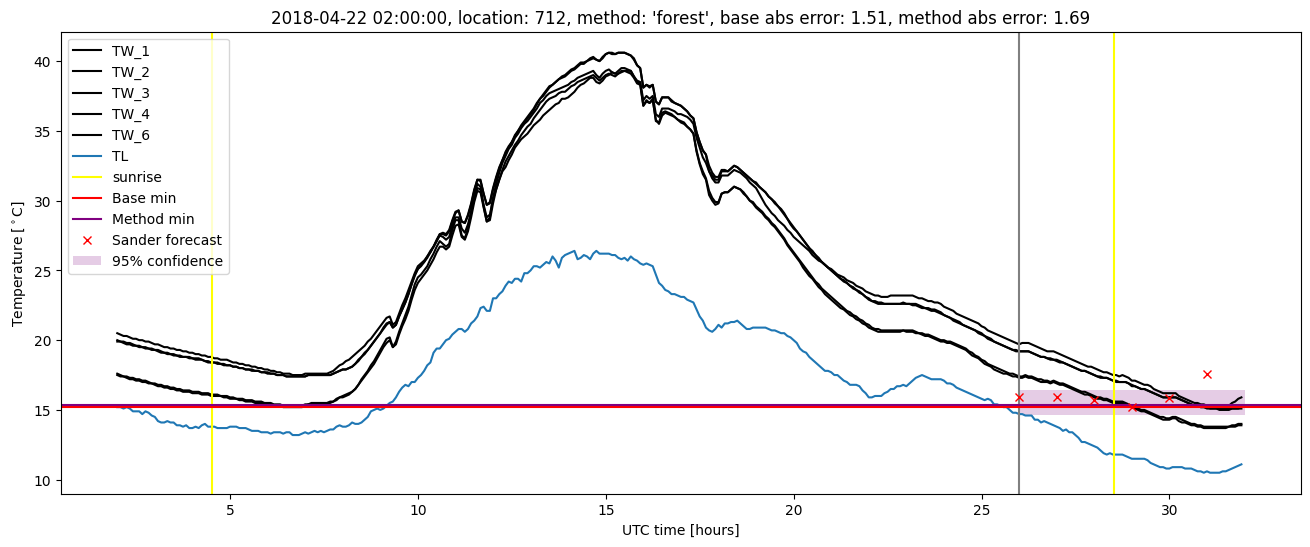
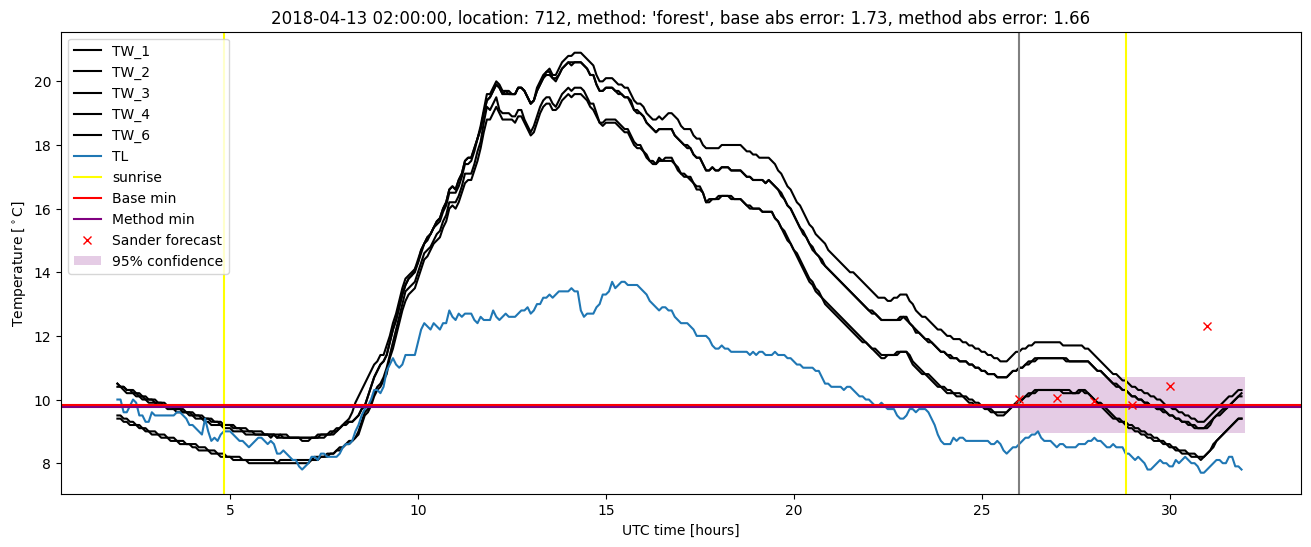
| forest |
winter 2018 |
0.986 |
0.115 |
0.235 |
0.373 |
1.685 |
0.463 |
4.126 |
| baseline |
winter 2019 |
0.993 |
0.000e+00 |
0.237 |
0.334 |
1.950 |
NaN |
NaN |
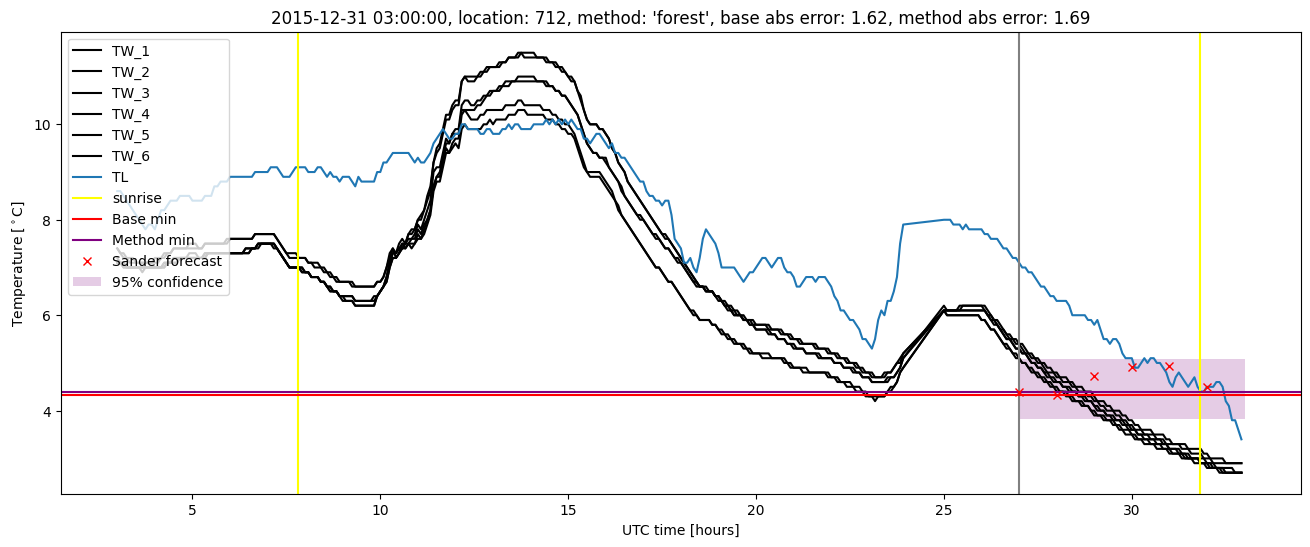
| forest |
winter 2019 |
0.993 |
0.083 |
0.218 |
0.343 |
1.536 |
0.460 |
4.693 |
| baseline |
all |
0.986 |
0.071 |
0.283 |
0.398 |
2.010 |
NaN |
NaN |
| forest |
all |
0.990 |
0.059 |
0.234 |
0.365 |
1.691 |
0.463 |
4.666 |
Random forest plots

Extended logistic regression results
| names |
period |
power |
significance |
meanSquareError |
absError |
maxError |
CRPS |
IGN |
| baseline |
winter 2016 |
0.995 |
0.000e+00 |
0.288 |
0.405 |
1.636 |
NaN |
NaN |
| elr |
winter 2016 |
1.000 |
0.000e+00 |
0.228 |
0.365 |
1.672 |
0.510 |
6.045 |
| baseline |
winter 2017 |
0.968 |
0.100 |
0.325 |
0.437 |
2.010 |
NaN |
NaN |
| elr |
winter 2017 |
0.976 |
0.067 |
0.257 |
0.399 |
1.683 |
0.533 |
7.392 |
| baseline |
winter 2018 |
0.986 |
0.115 |
0.279 |
0.410 |
1.726 |
NaN |
NaN |
| elr |
winter 2018 |
0.986 |
0.115 |
0.232 |
0.377 |
1.714 |
0.496 |
5.123 |
| baseline |
winter 2019 |
0.993 |
0.000e+00 |
0.237 |
0.334 |
1.950 |
NaN |
NaN |
| elr |
winter 2019 |
0.993 |
0.083 |
0.238 |
0.352 |
1.820 |
0.496 |
5.732 |
| baseline |
all |
0.986 |
0.071 |
0.283 |
0.398 |
2.010 |
NaN |
NaN |
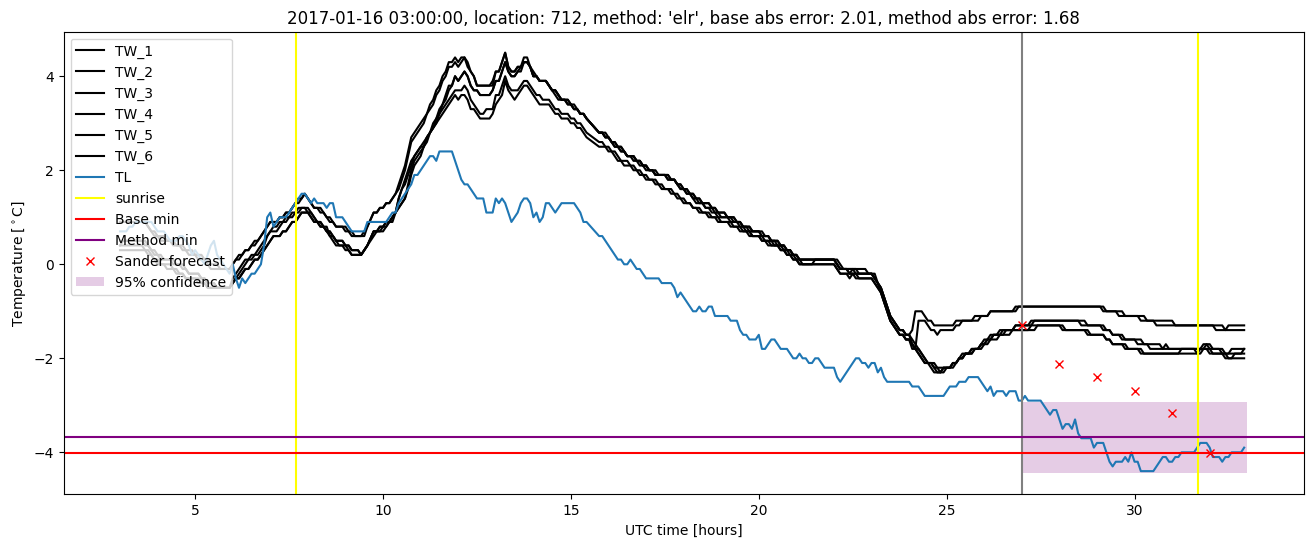
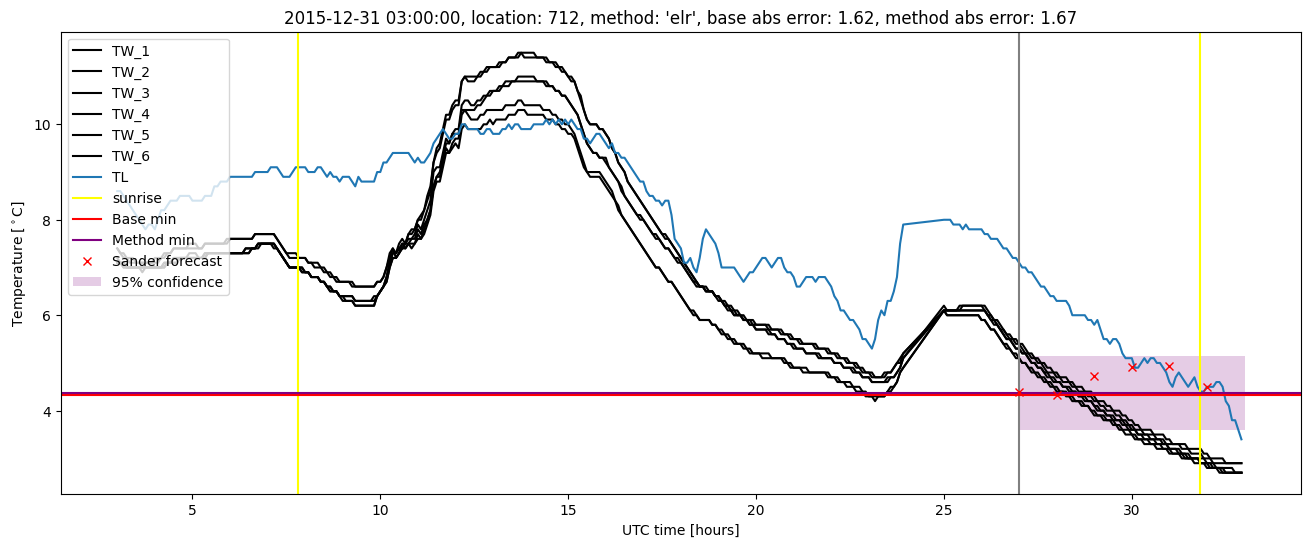
| elr |
all |
0.990 |
0.071 |
0.238 |
0.373 |
1.820 |
0.509 |
6.048 |
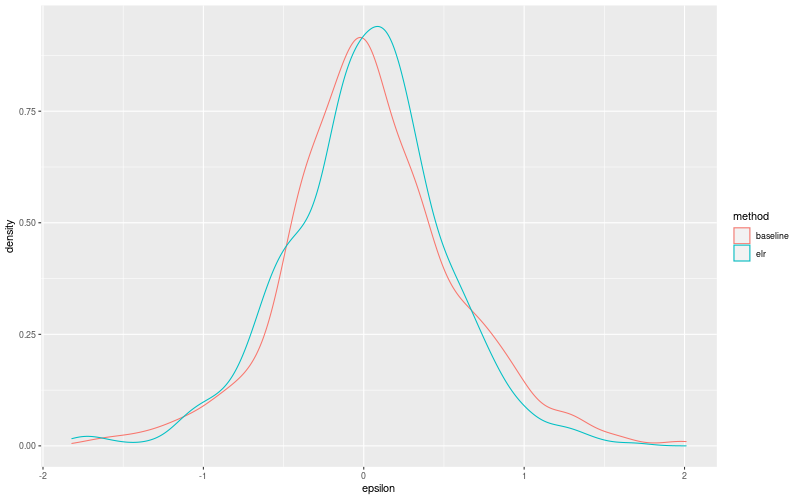
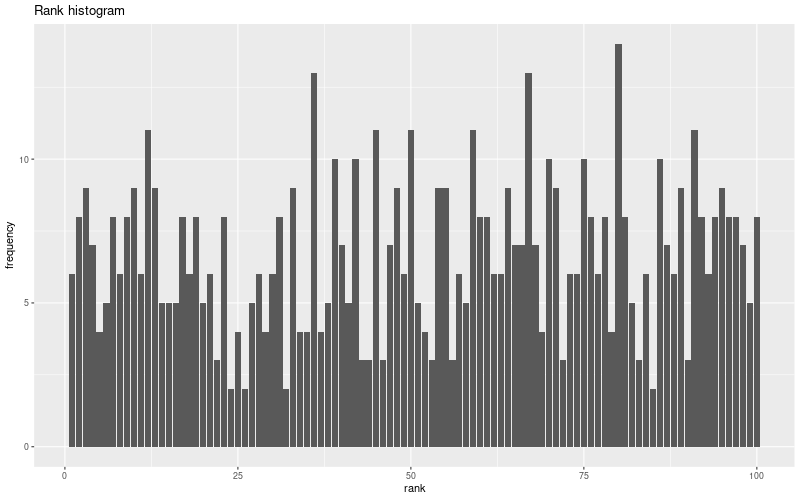
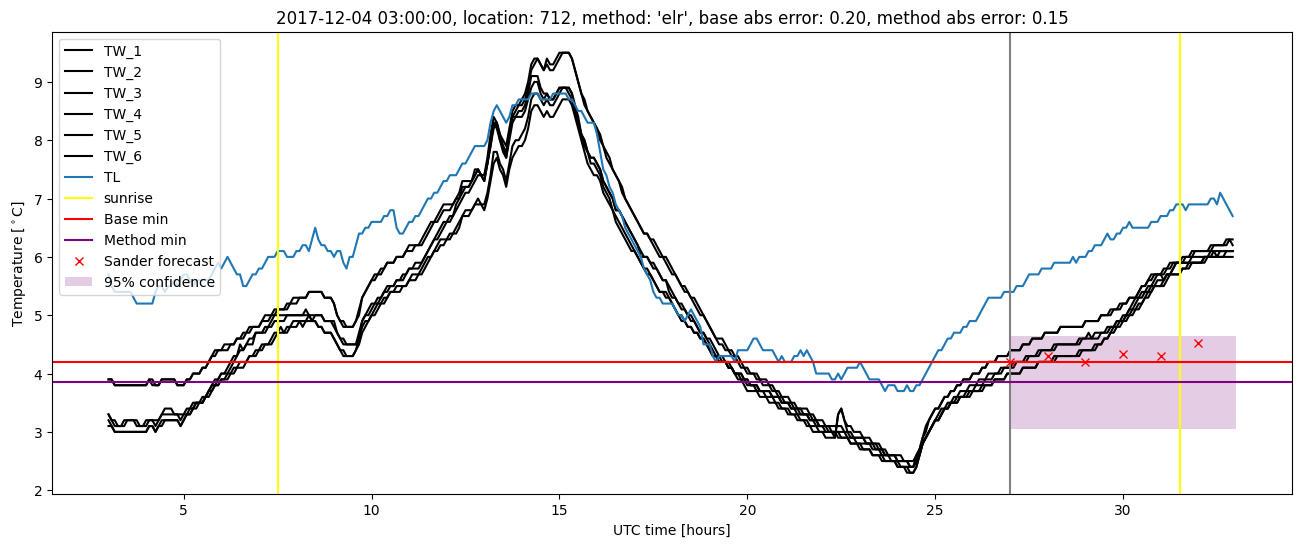
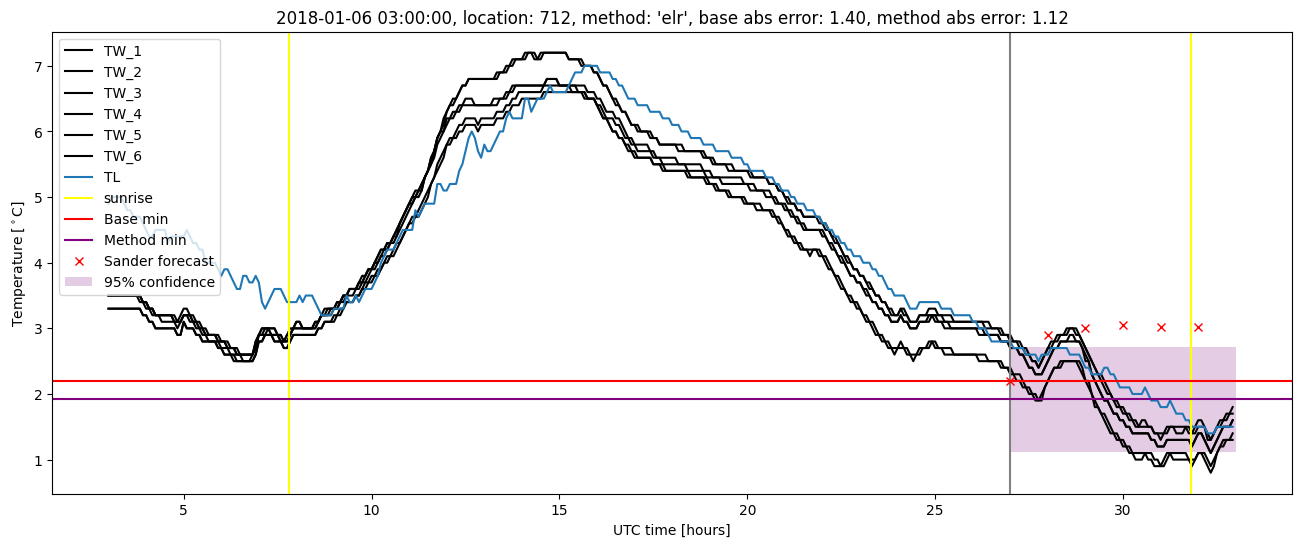
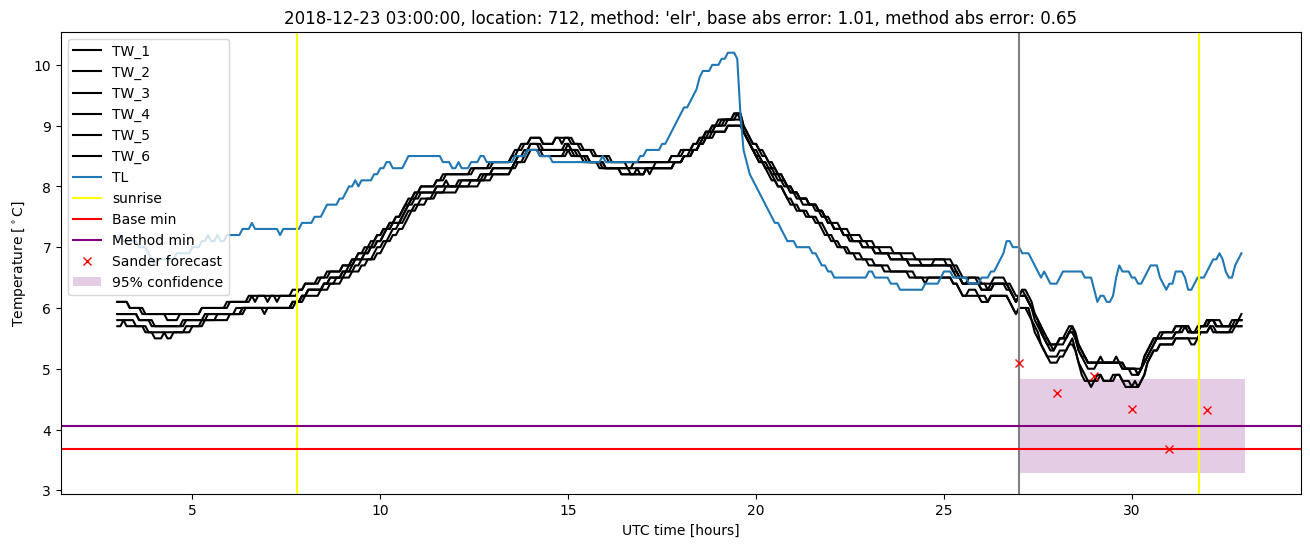
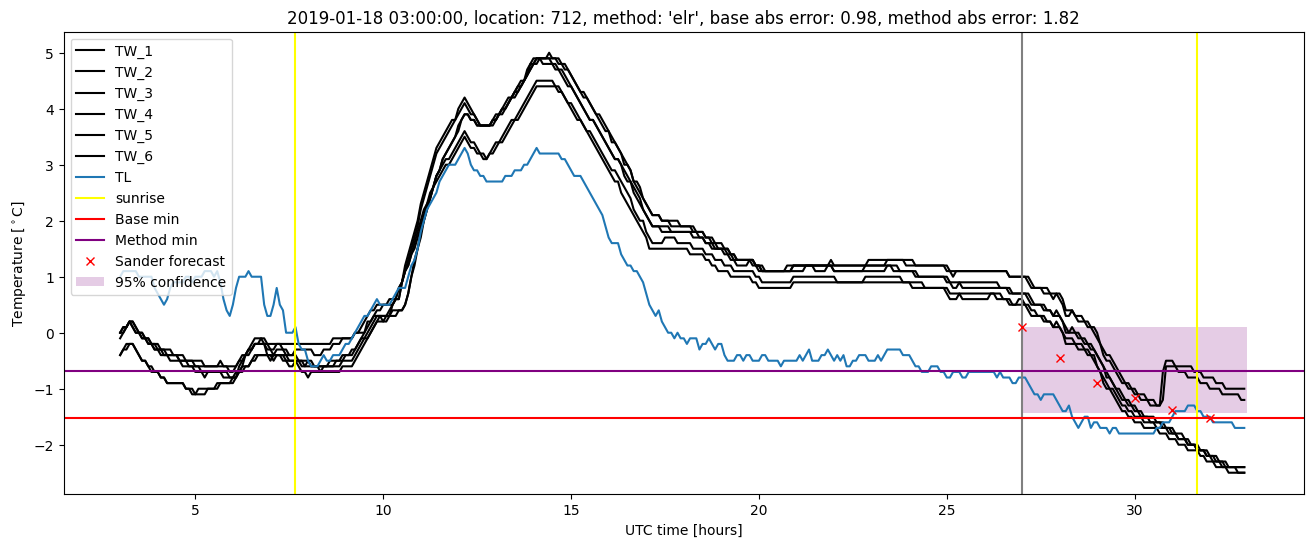
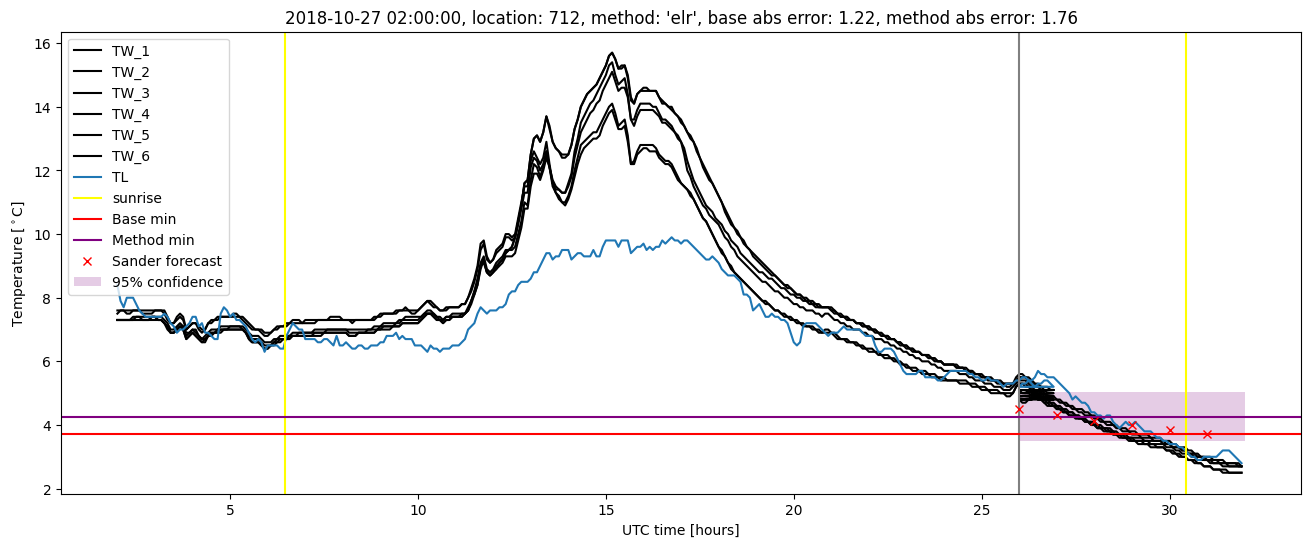
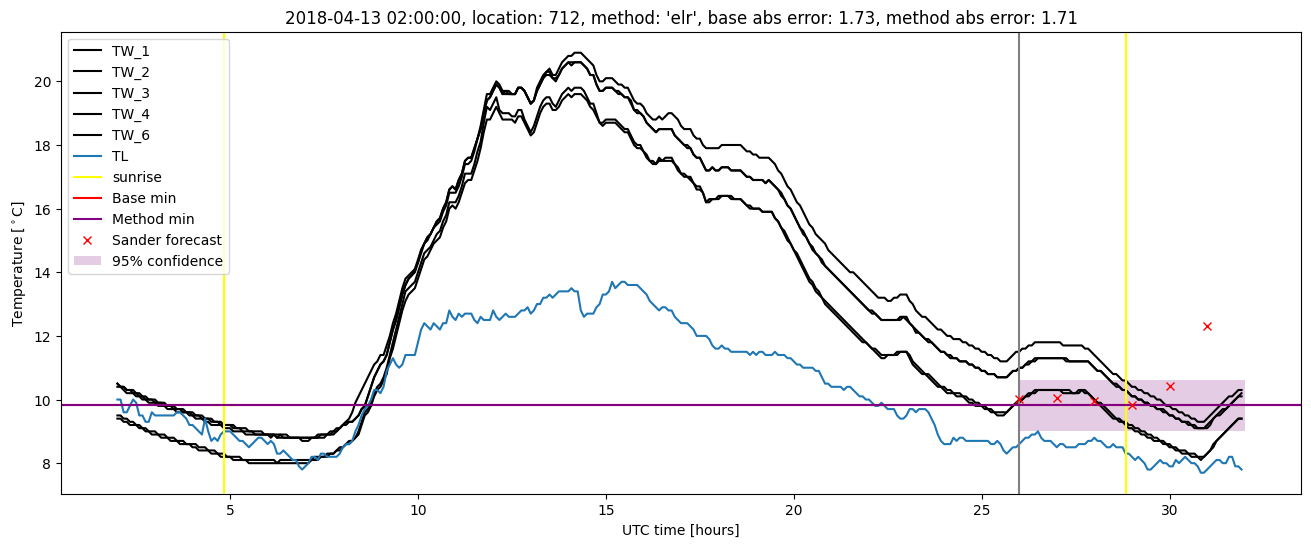
Extended logistic regression plots