GMS location: 711
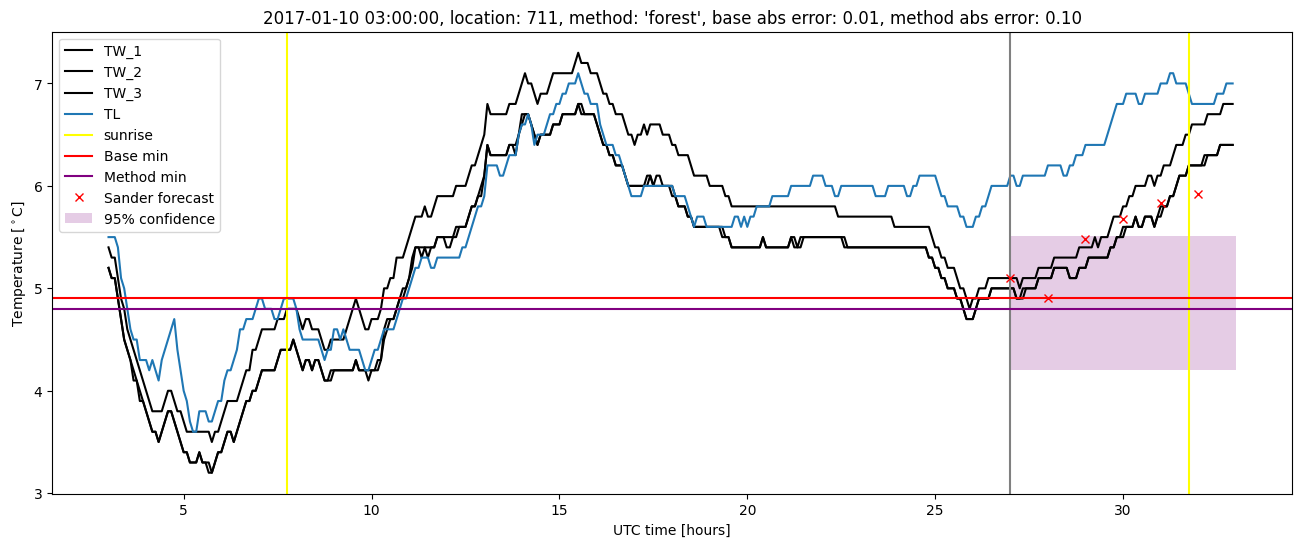
Random forest results
| names |
period |
power |
significance |
meanSquareError |
absError |
maxError |
CRPS |
IGN |
| baseline |
winter 2016 |
0.995 |
0.000e+00 |
0.282 |
0.394 |
1.746 |
NaN |
NaN |
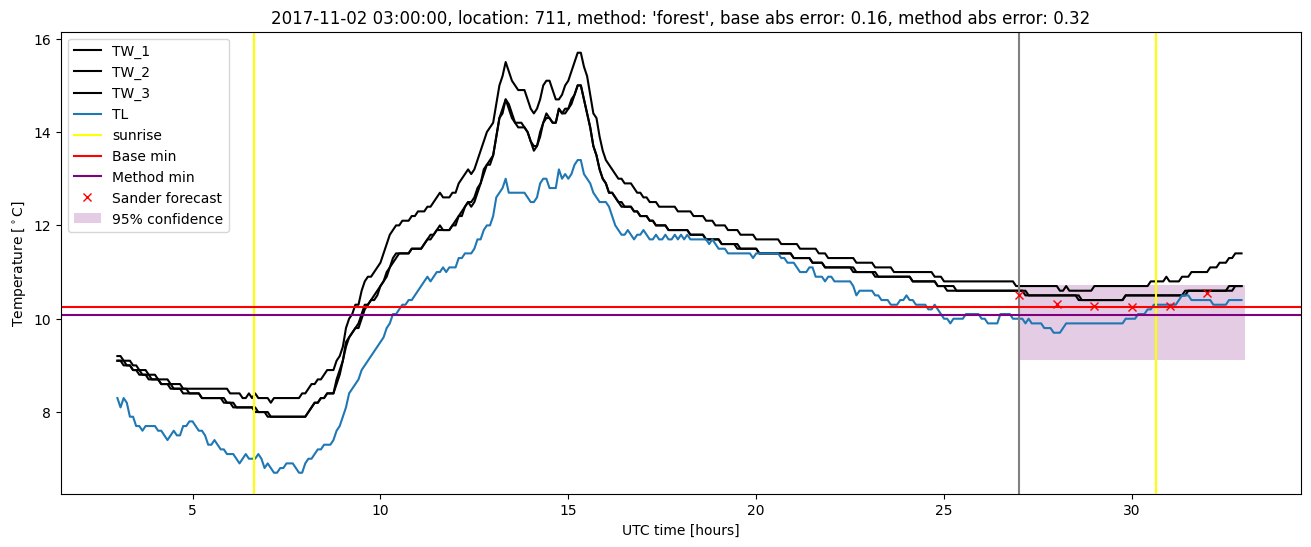
| forest |
winter 2016 |
1.000 |
0.083 |
0.226 |
0.364 |
1.726 |
0.476 |
4.288 |
| baseline |
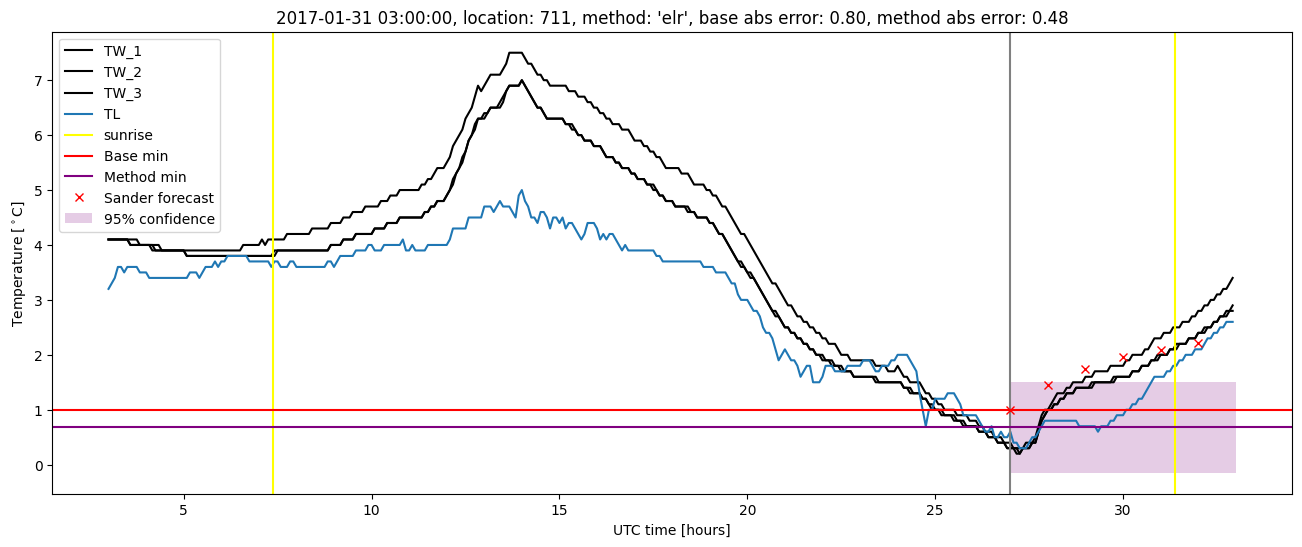
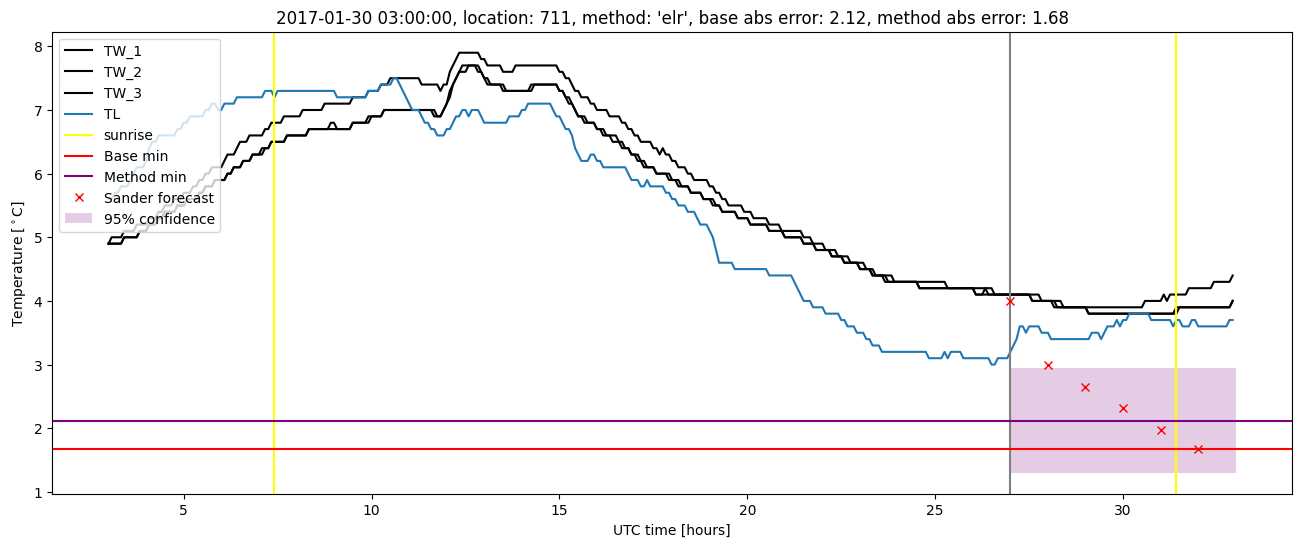
winter 2017 |
0.970 |
0.050 |
0.336 |
0.440 |
2.123 |
NaN |
NaN |
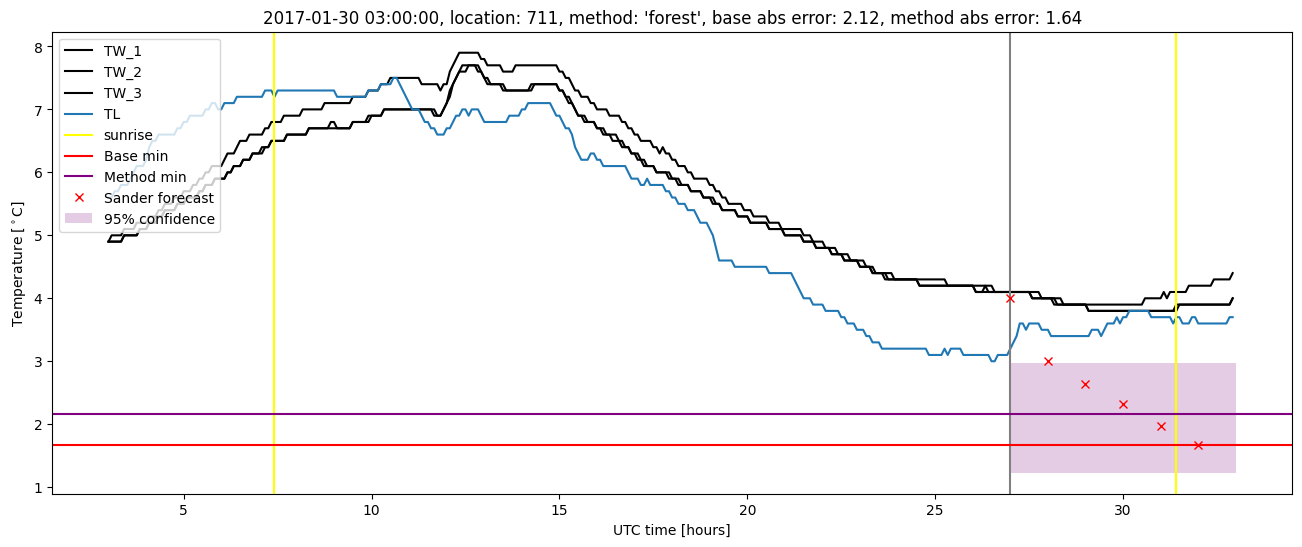
| forest |
winter 2017 |
0.993 |
0.000e+00 |
0.225 |
0.364 |
1.645 |
0.473 |
4.932 |
| baseline |
winter 2018 |
0.982 |
0.050 |
0.341 |
0.449 |
1.880 |
NaN |
NaN |
| forest |
winter 2018 |
1.000 |
0.100 |
0.238 |
0.370 |
1.492 |
0.464 |
4.043 |
| baseline |
winter 2019 |
0.987 |
0.100 |
0.263 |
0.366 |
2.296 |
NaN |
NaN |
| forest |
winter 2019 |
0.987 |
0.000e+00 |
0.204 |
0.335 |
1.612 |
0.466 |
4.227 |
| baseline |
all |
0.985 |
0.048 |
0.304 |
0.411 |
2.296 |
NaN |
NaN |
| forest |
all |
0.995 |
0.048 |
0.224 |
0.359 |
1.726 |
0.470 |
4.350 |
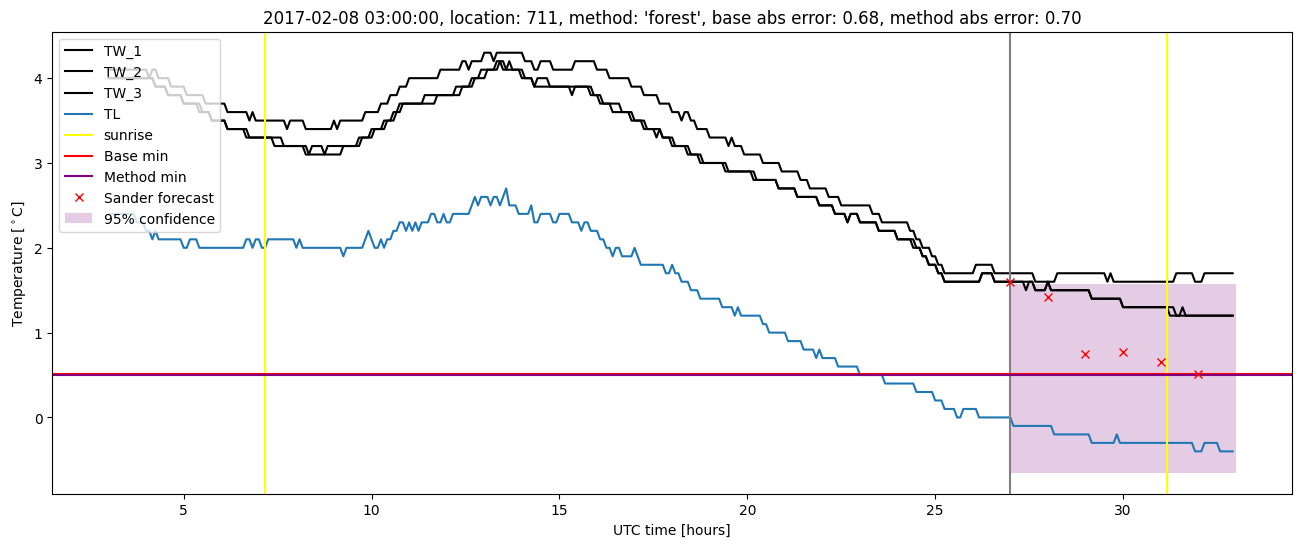
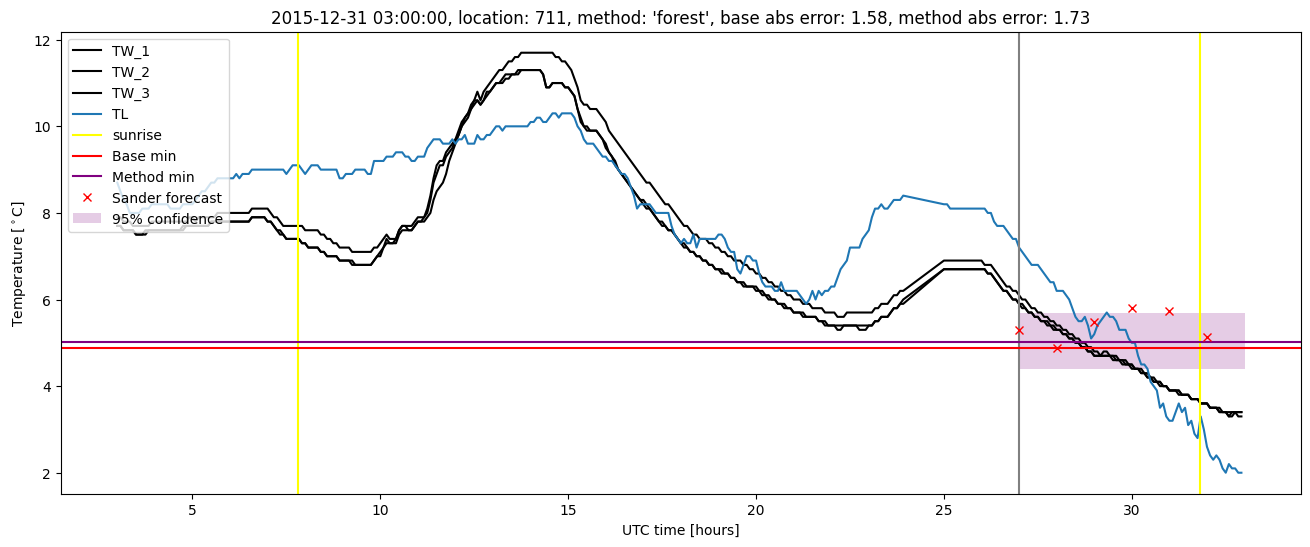
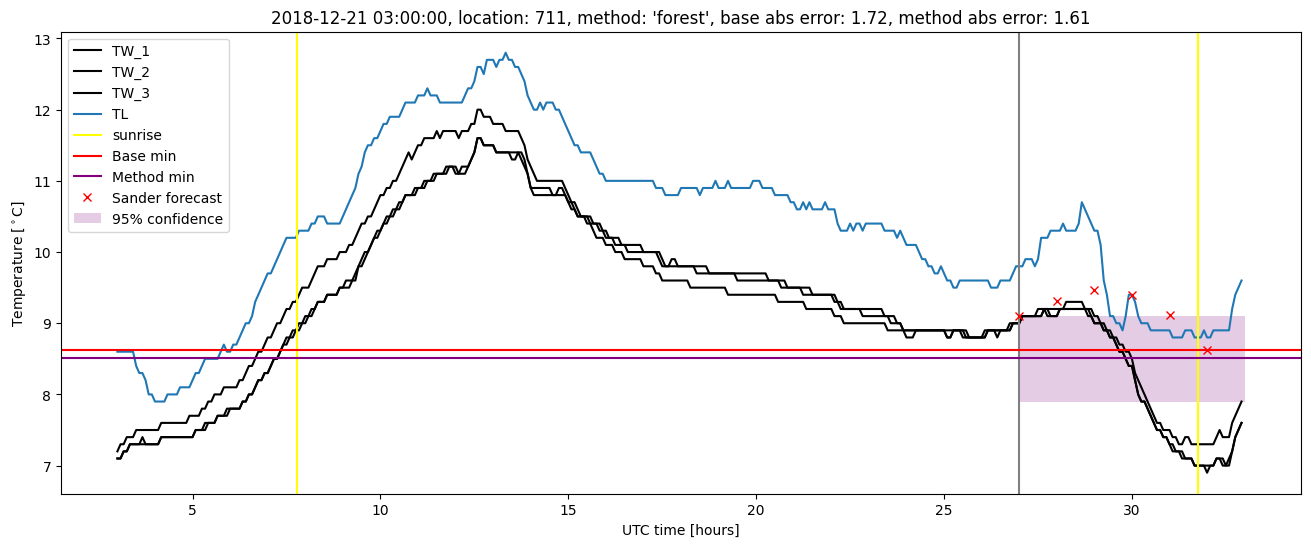
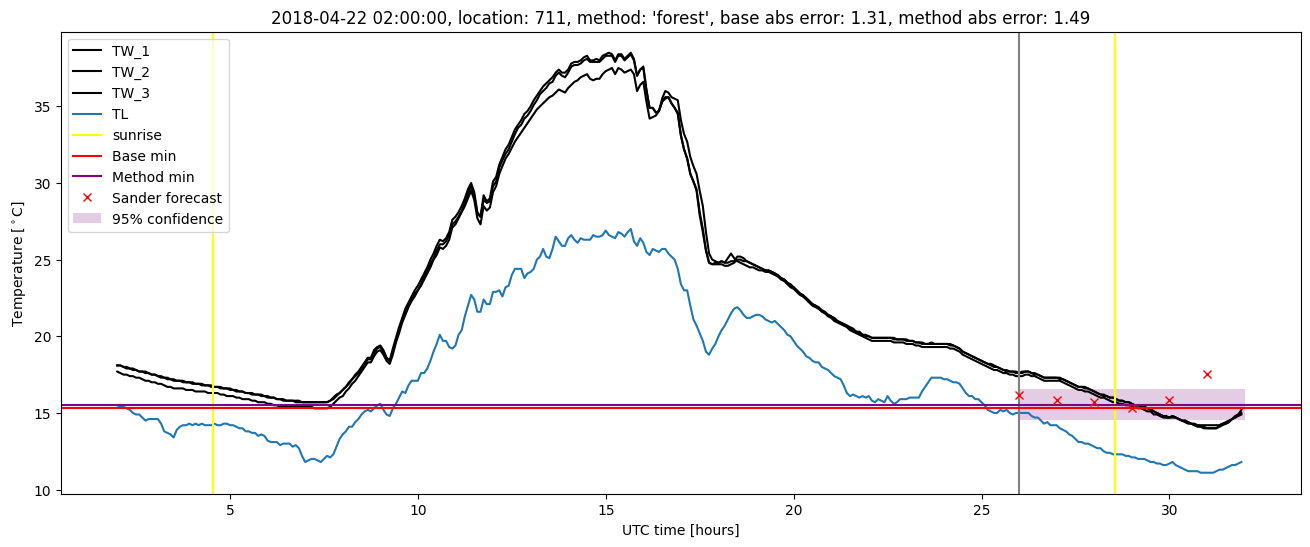
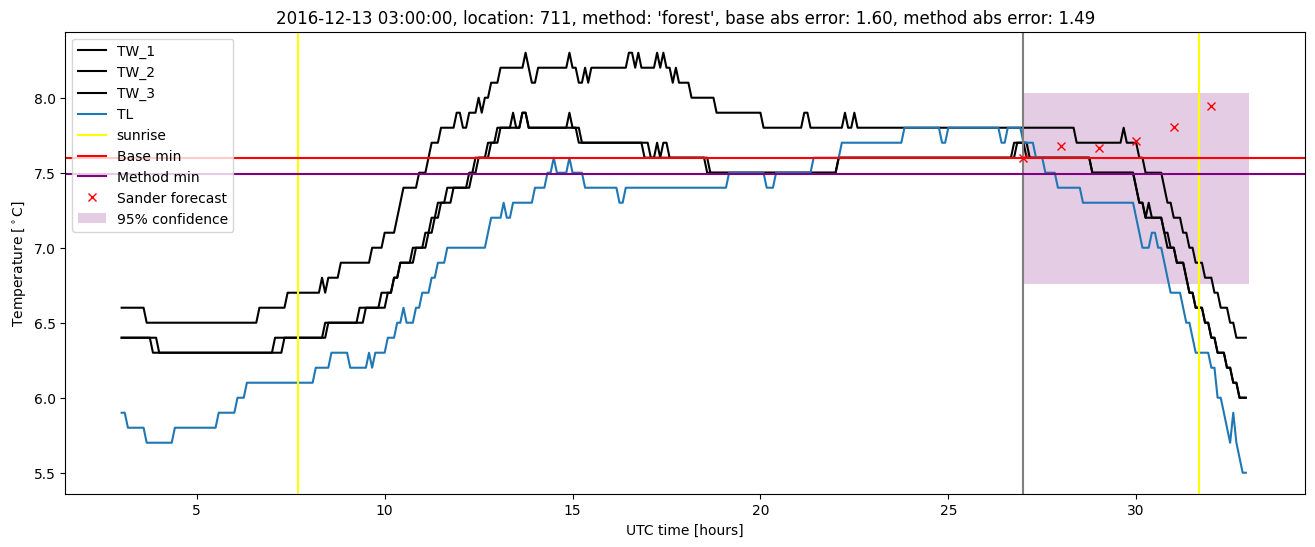
Random forest plots
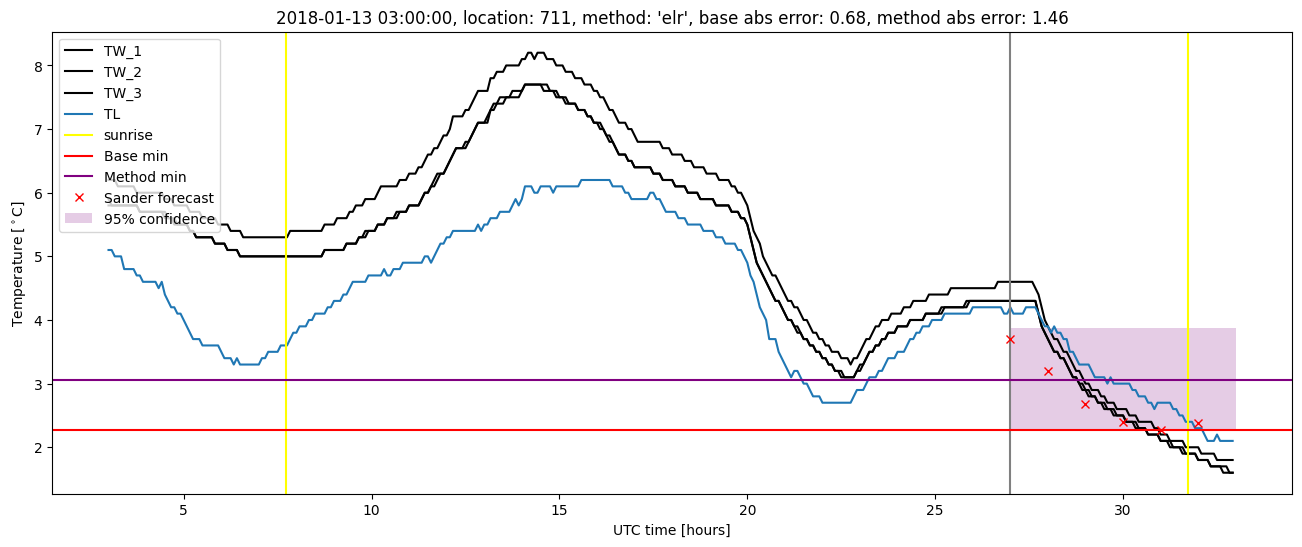
Extended logistic regression results
| names |
period |
power |
significance |
meanSquareError |
absError |
maxError |
CRPS |
IGN |
| baseline |
winter 2016 |
0.995 |
0.000e+00 |
0.282 |
0.394 |
1.746 |
NaN |
NaN |
| elr |
winter 2016 |
1.000 |
0.083 |
0.229 |
0.372 |
1.777 |
0.530 |
5.329 |
| baseline |
winter 2017 |
0.970 |
0.050 |
0.336 |
0.440 |
2.123 |
NaN |
NaN |
| elr |
winter 2017 |
0.993 |
0.050 |
0.250 |
0.386 |
1.680 |
0.523 |
5.104 |
| baseline |
winter 2018 |
0.982 |
0.050 |
0.341 |
0.449 |
1.880 |
NaN |
NaN |
| elr |
winter 2018 |
1.000 |
0.100 |
0.270 |
0.406 |
1.634 |
0.512 |
5.400 |
| baseline |
winter 2019 |
0.987 |
0.100 |
0.263 |
0.366 |
2.296 |
NaN |
NaN |
| elr |
winter 2019 |
0.987 |
0.100 |
0.215 |
0.353 |
1.511 |
0.497 |
4.498 |
| baseline |
all |
0.985 |
0.048 |
0.304 |
0.411 |
2.296 |
NaN |
NaN |
| elr |
all |
0.995 |
0.081 |
0.241 |
0.379 |
1.777 |
0.516 |
5.104 |
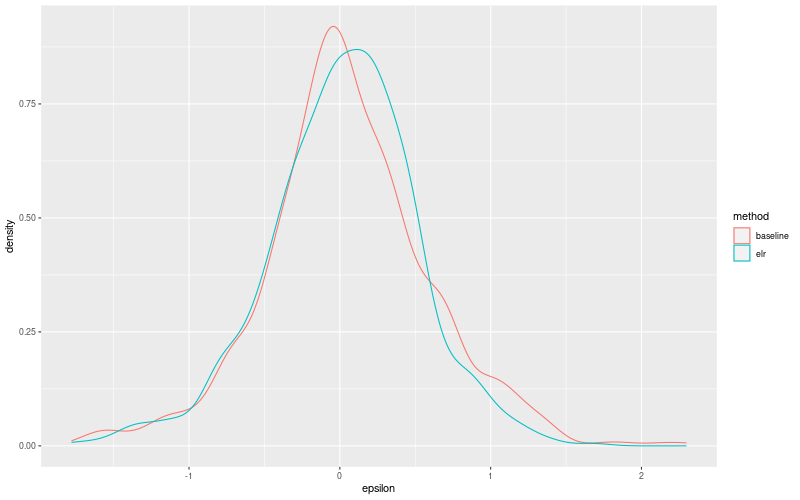
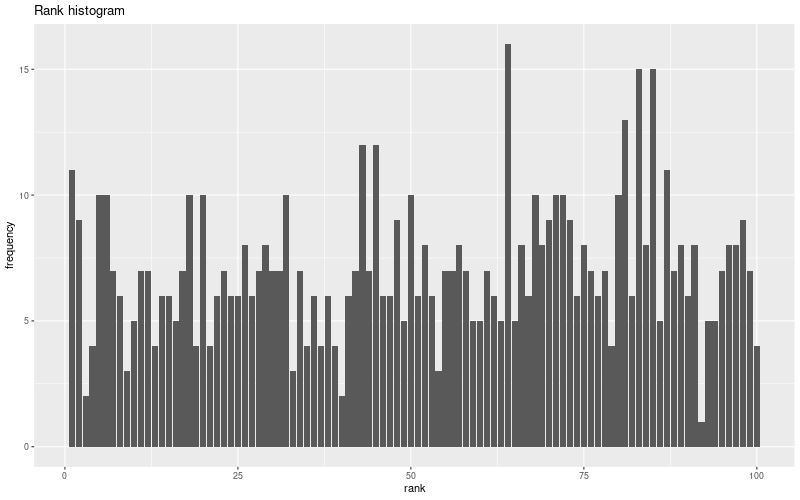
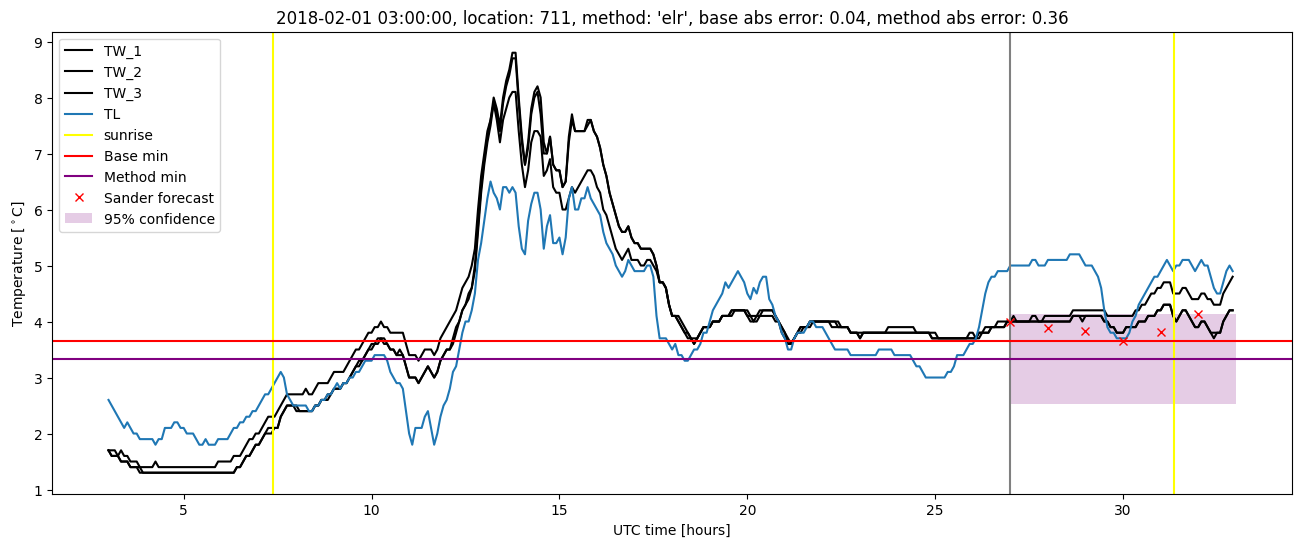
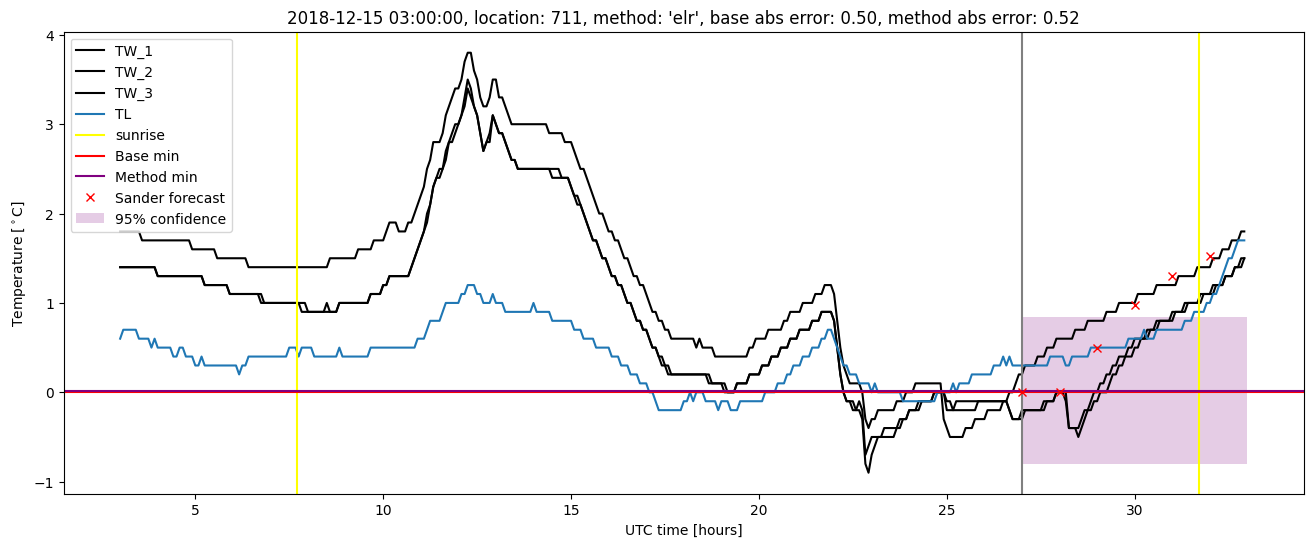
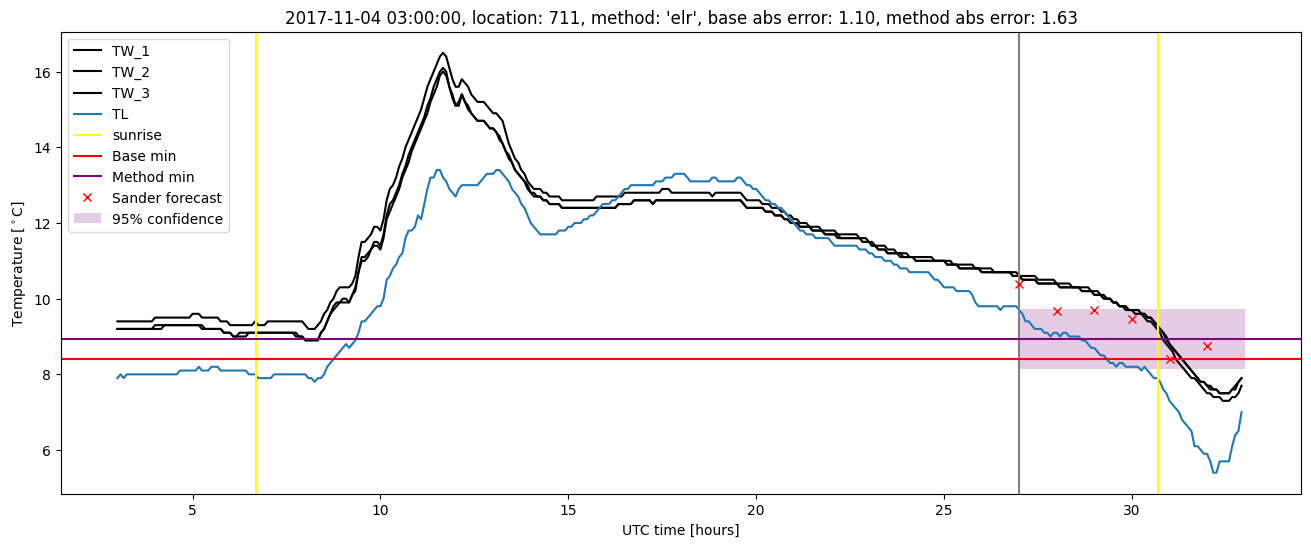
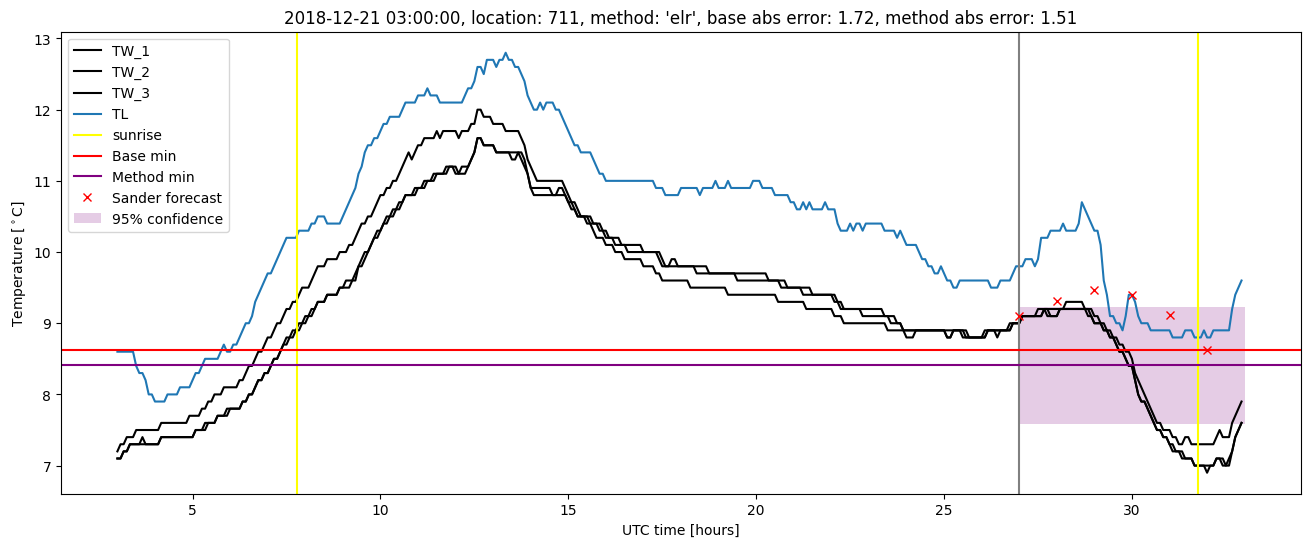
Extended logistic regression plots