GMS location: 612
Random forest results
| names |
period |
power |
significance |
meanSquareError |
absError |
maxError |
CRPS |
IGN |
| baseline |
winter 2016 |
0.982 |
0.033 |
0.405 |
0.456 |
2.371 |
NaN |
NaN |
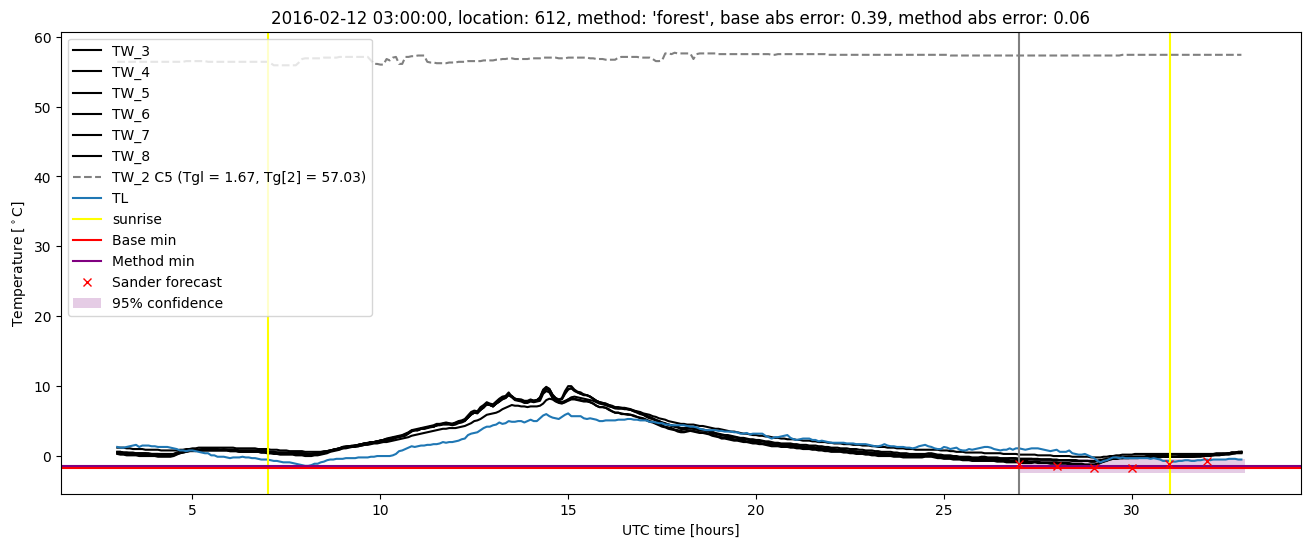
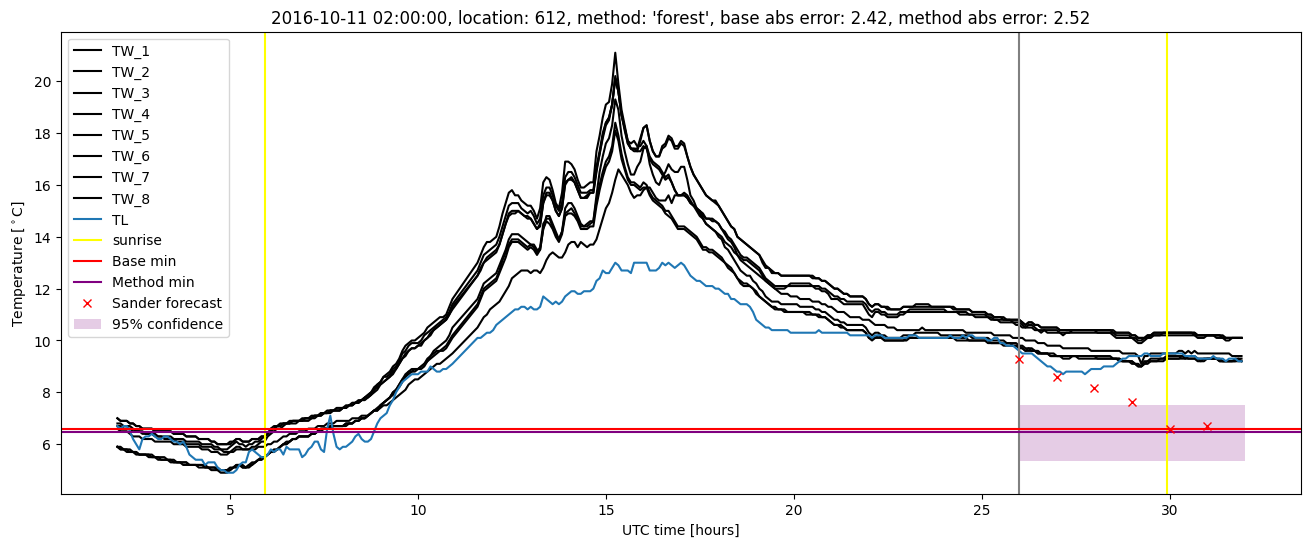
| forest |
winter 2016 |
0.982 |
0.033 |
0.327 |
0.407 |
2.143 |
0.522 |
3.317 |
| baseline |
winter 2017 |
0.964 |
0.049 |
0.535 |
0.533 |
3.299 |
NaN |
NaN |
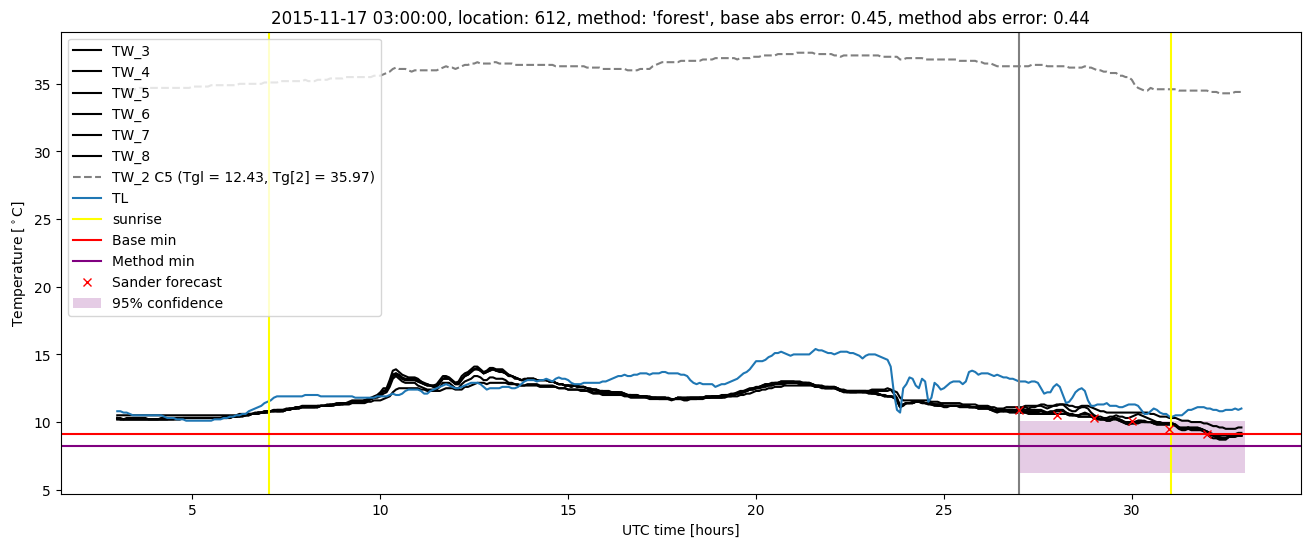
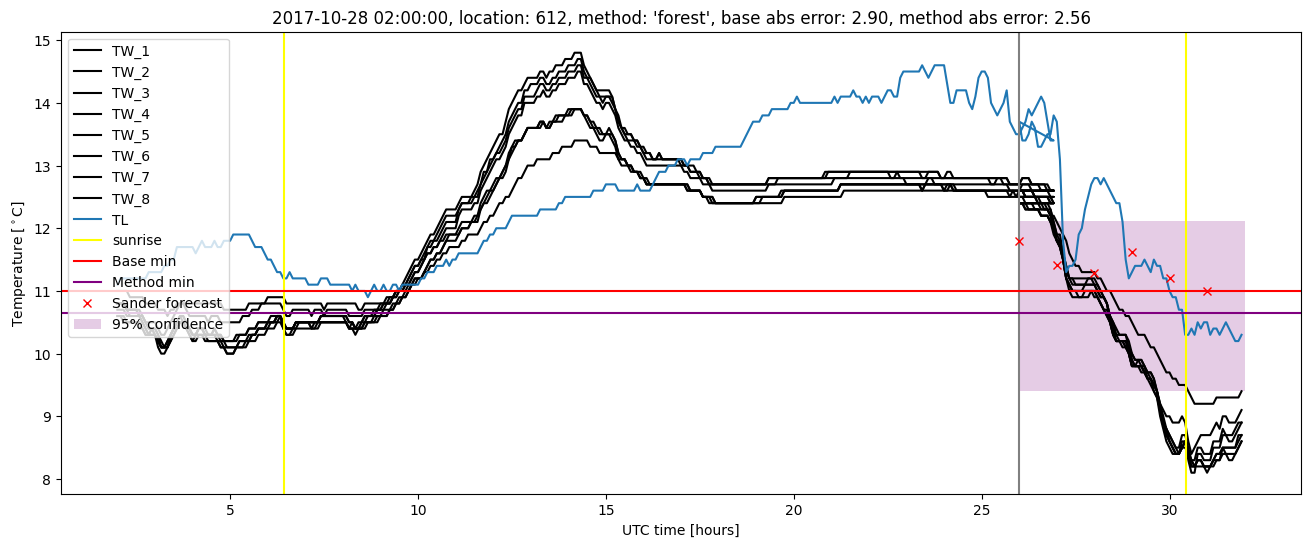
| forest |
winter 2017 |
0.964 |
0.073 |
0.415 |
0.465 |
2.521 |
0.503 |
3.279 |
| baseline |
winter 2018 |
0.986 |
0.081 |
0.450 |
0.474 |
2.895 |
NaN |
NaN |
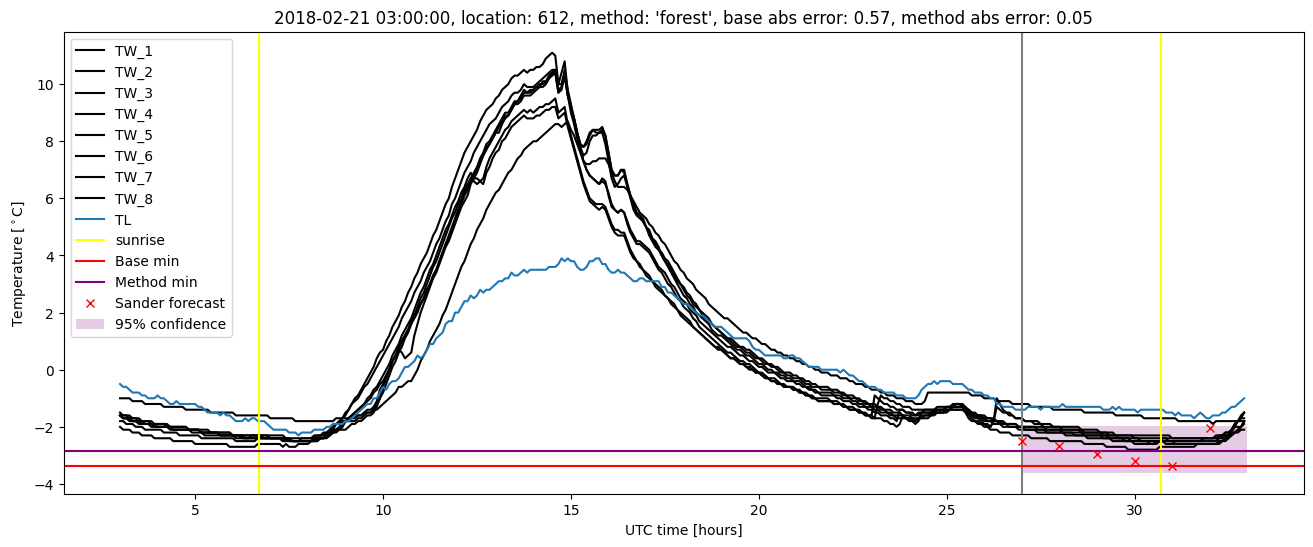
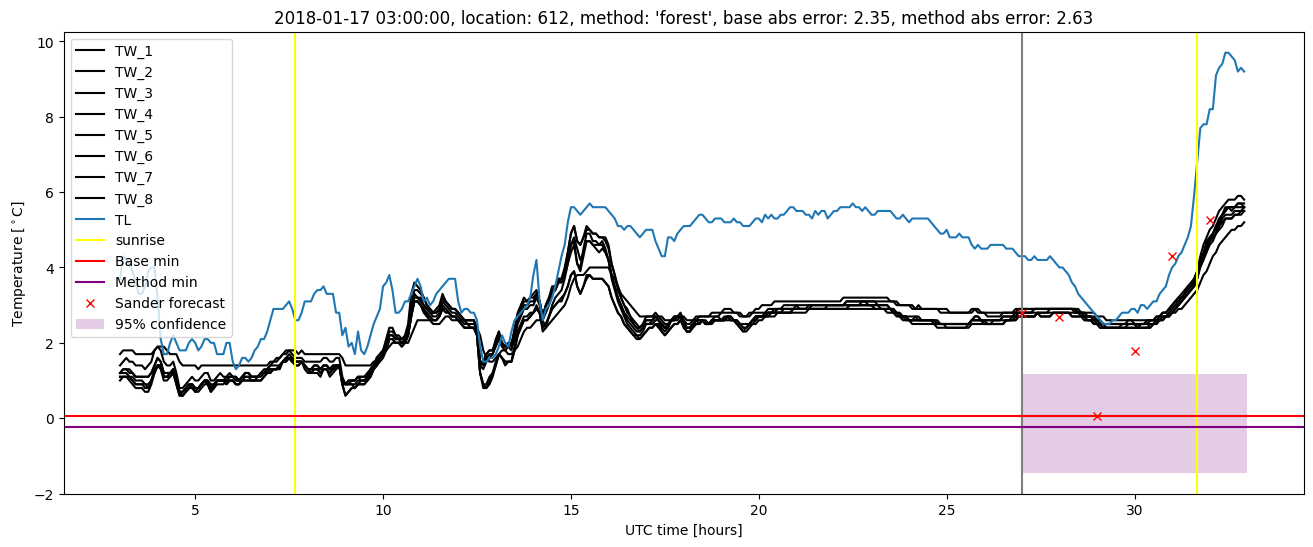
| forest |
winter 2018 |
0.965 |
0.054 |
0.400 |
0.455 |
2.630 |
0.538 |
3.407 |
| baseline |
winter 2019 |
1.000 |
0.250 |
0.235 |
0.343 |
1.762 |
NaN |
NaN |
| forest |
winter 2019 |
1.000 |
0.250 |
0.171 |
0.309 |
1.329 |
0.530 |
2.701 |
| baseline |
all |
0.984 |
0.075 |
0.410 |
0.454 |
3.299 |
NaN |
NaN |
| forest |
all |
0.978 |
0.075 |
0.333 |
0.412 |
2.630 |
0.524 |
3.200 |
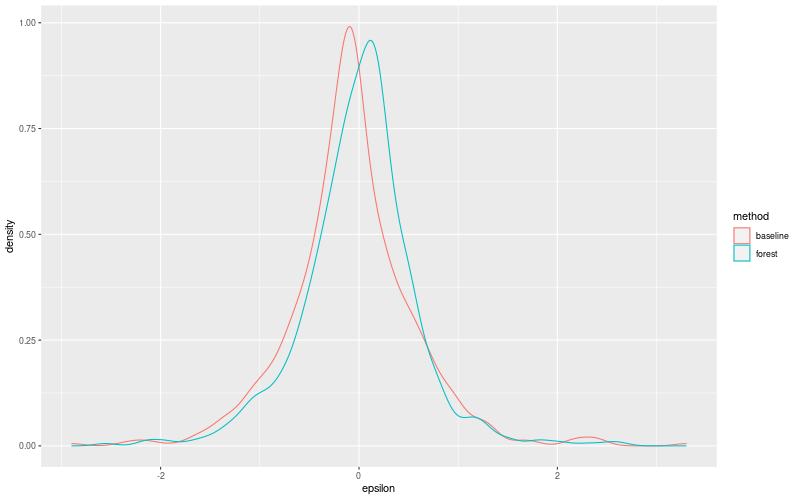
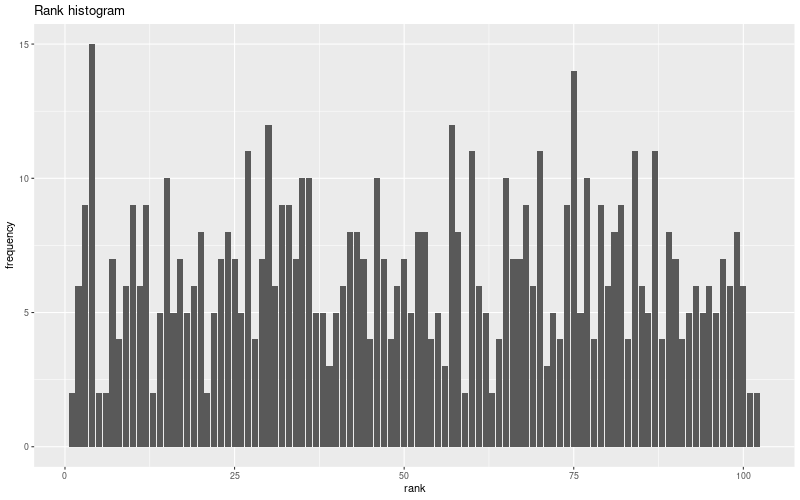
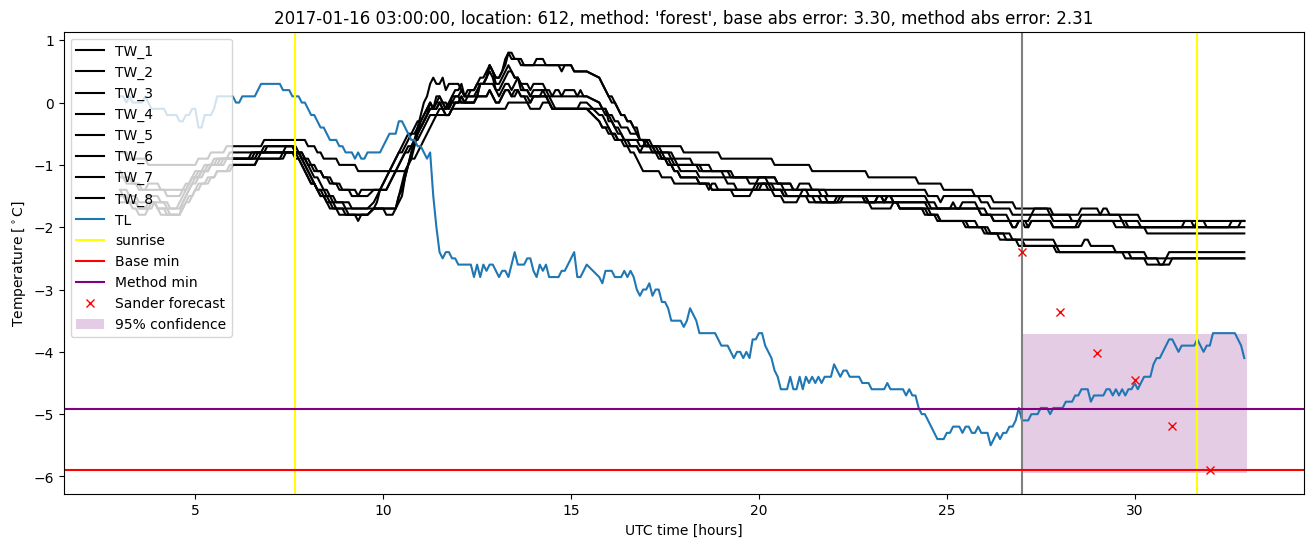
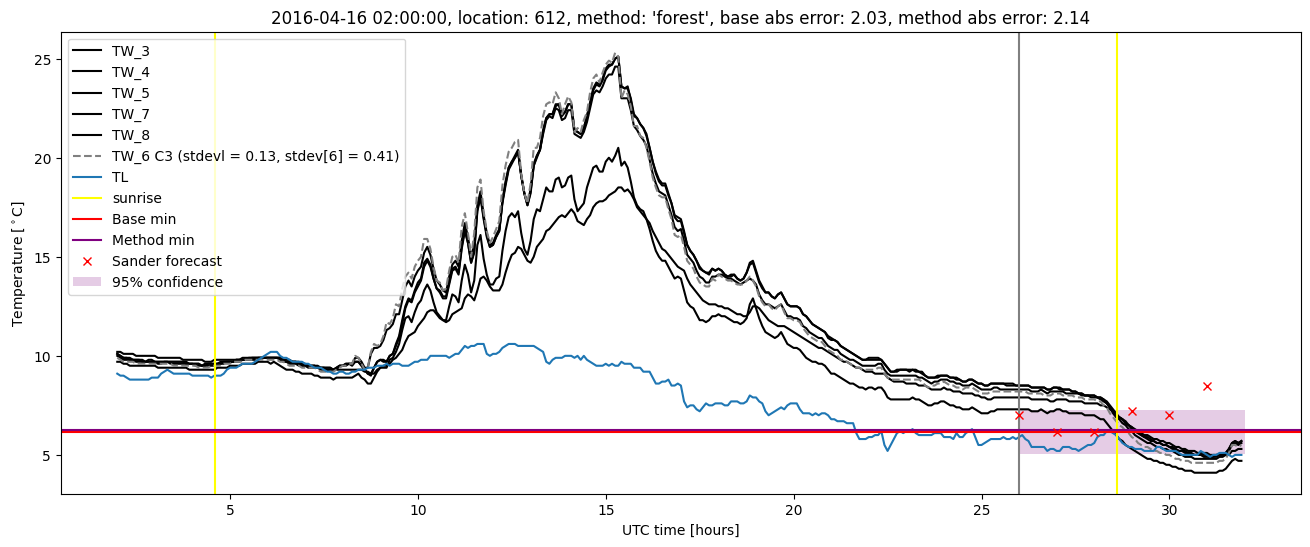
Random forest plots
Extended logistic regression results
| names |
period |
power |
significance |
meanSquareError |
absError |
maxError |
CRPS |
IGN |
| baseline |
winter 2016 |
0.982 |
0.033 |
0.405 |
0.456 |
2.371 |
NaN |
NaN |
| elr |
winter 2016 |
0.982 |
0.033 |
0.357 |
0.442 |
2.112 |
0.624 |
4.663 |
| baseline |
winter 2017 |
0.964 |
0.049 |
0.535 |
0.533 |
3.299 |
NaN |
NaN |
| elr |
winter 2017 |
0.973 |
0.073 |
0.450 |
0.485 |
2.779 |
0.556 |
3.900 |
| baseline |
winter 2018 |
0.986 |
0.081 |
0.450 |
0.474 |
2.895 |
NaN |
NaN |
| elr |
winter 2018 |
0.972 |
0.054 |
0.432 |
0.479 |
2.574 |
0.617 |
4.674 |
| baseline |
winter 2019 |
1.000 |
0.250 |
0.235 |
0.343 |
1.762 |
NaN |
NaN |
| elr |
winter 2019 |
1.000 |
0.250 |
0.223 |
0.386 |
1.313 |
0.559 |
3.013 |
| baseline |
all |
0.984 |
0.075 |
0.410 |
0.454 |
3.299 |
NaN |
NaN |
| elr |
all |
0.982 |
0.075 |
0.369 |
0.450 |
2.779 |
0.593 |
4.139 |
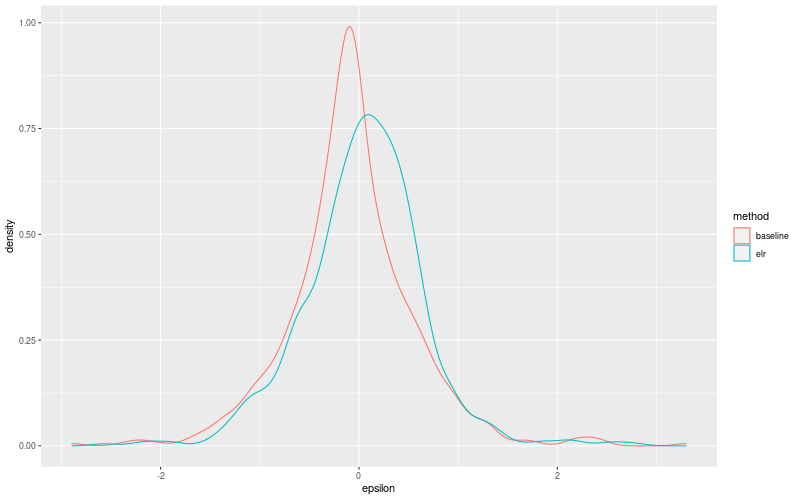
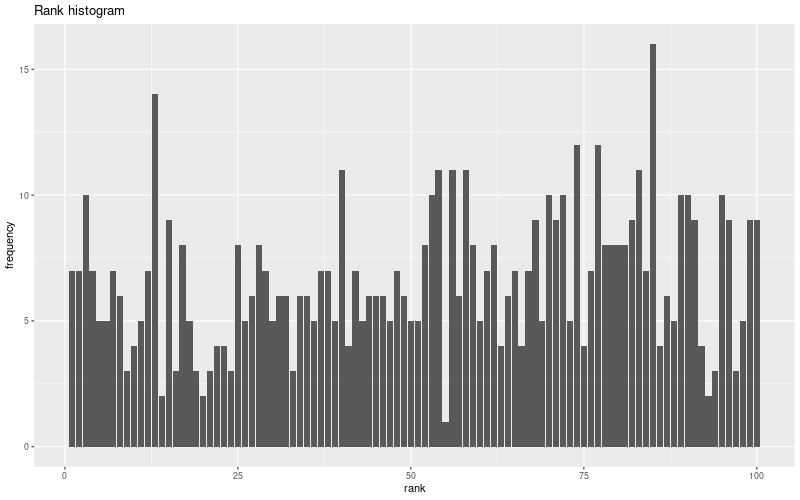
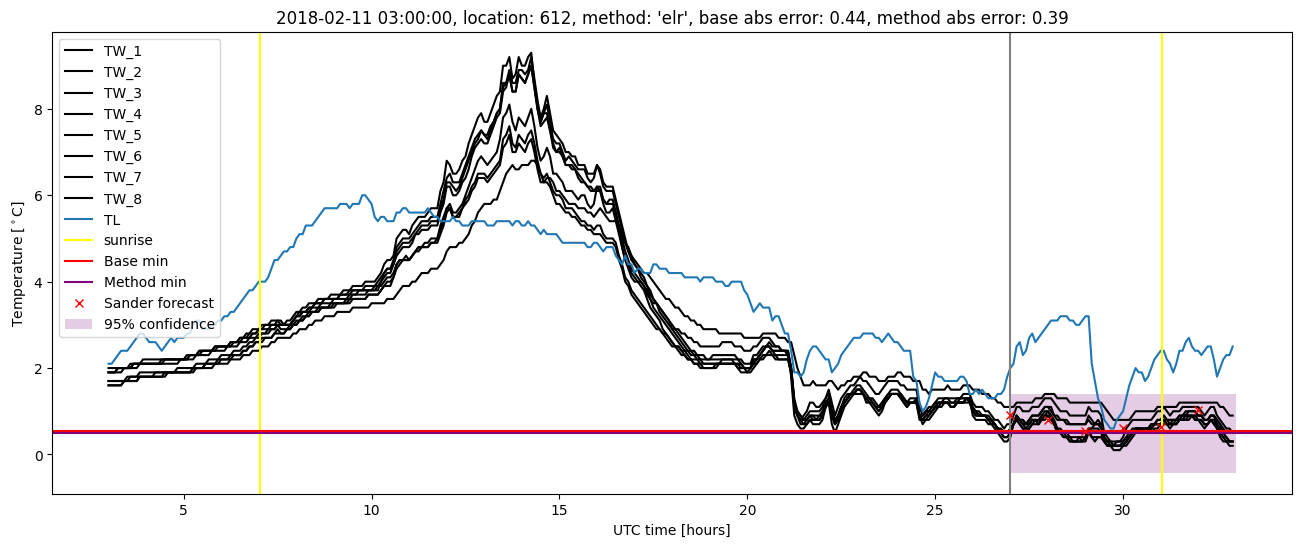
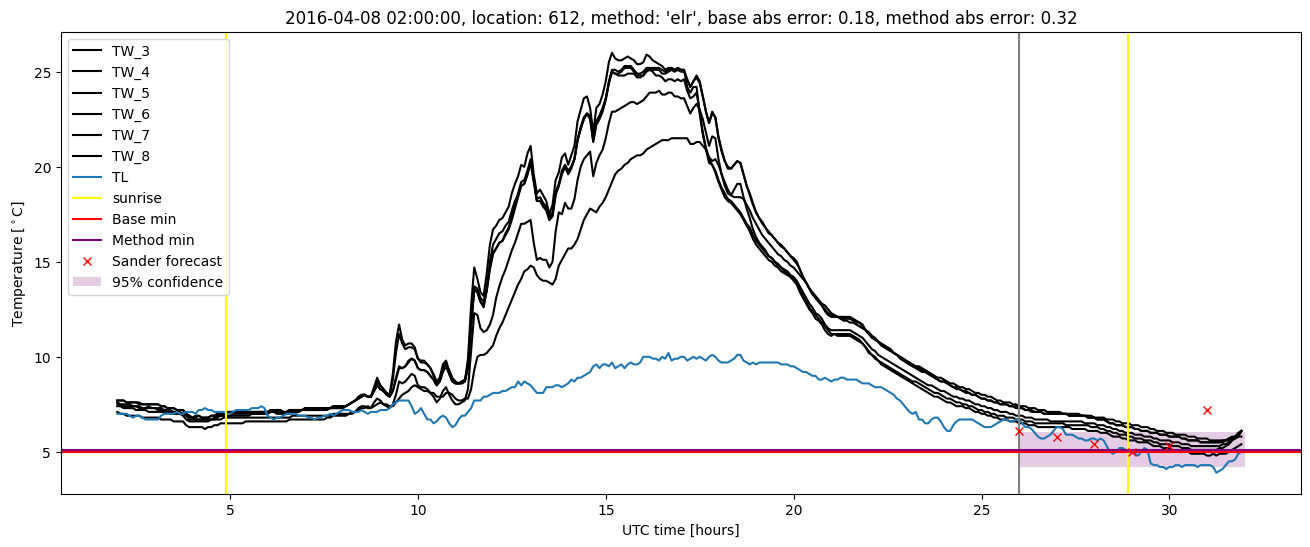
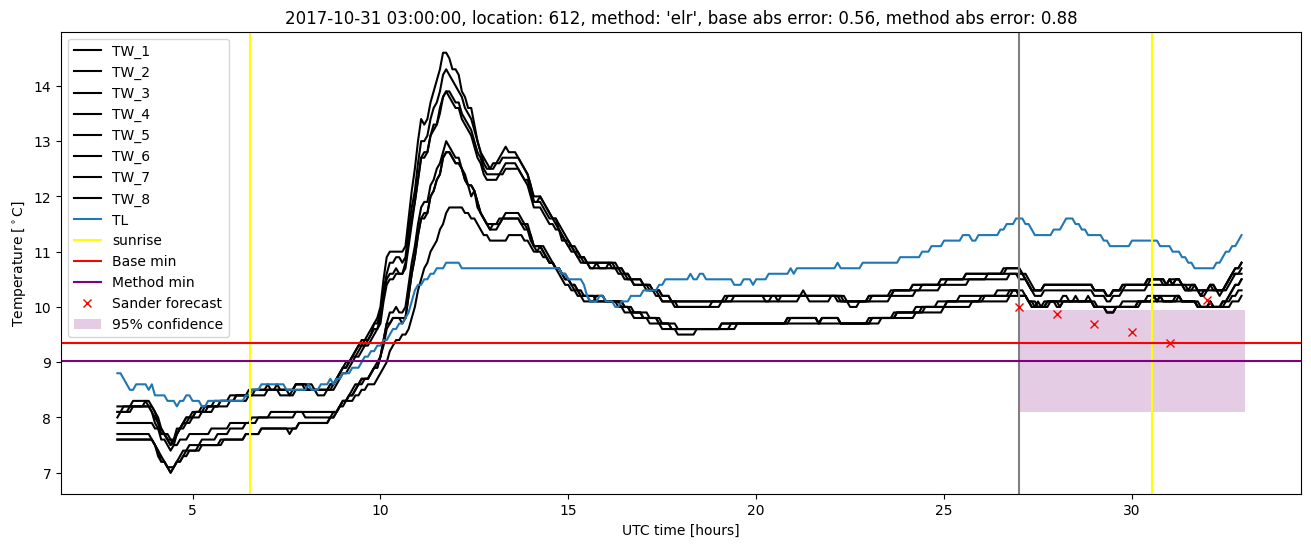
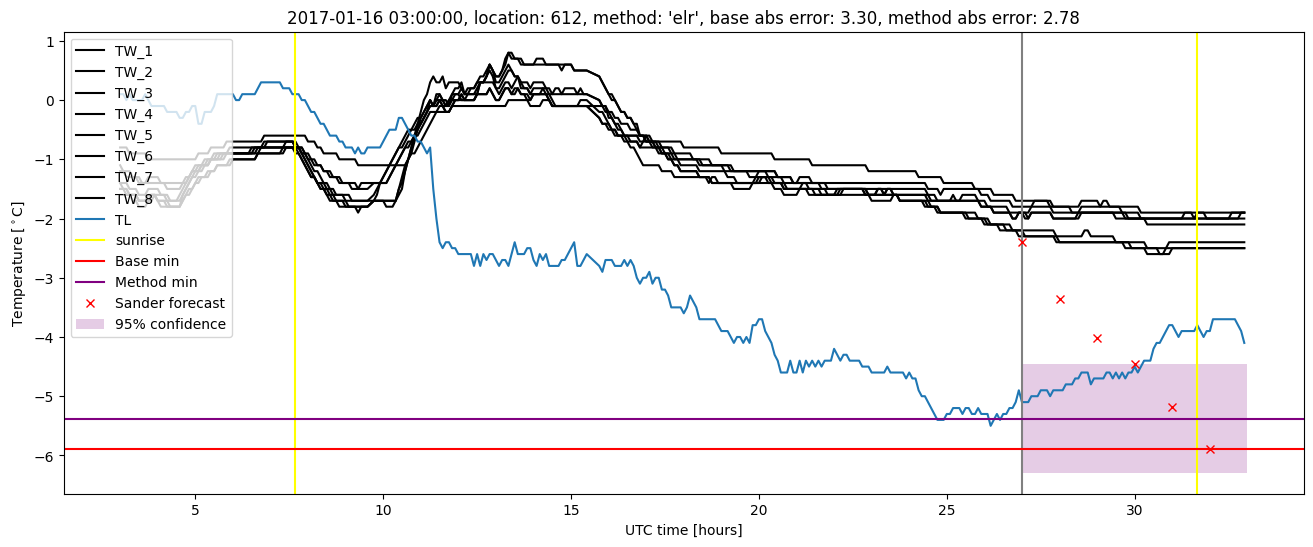
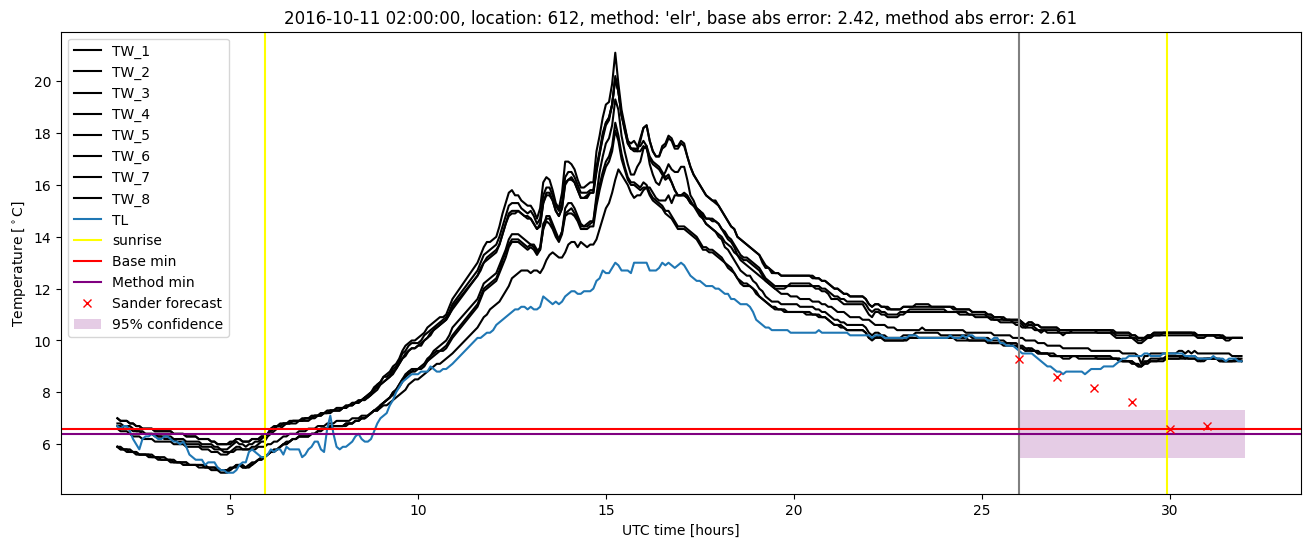
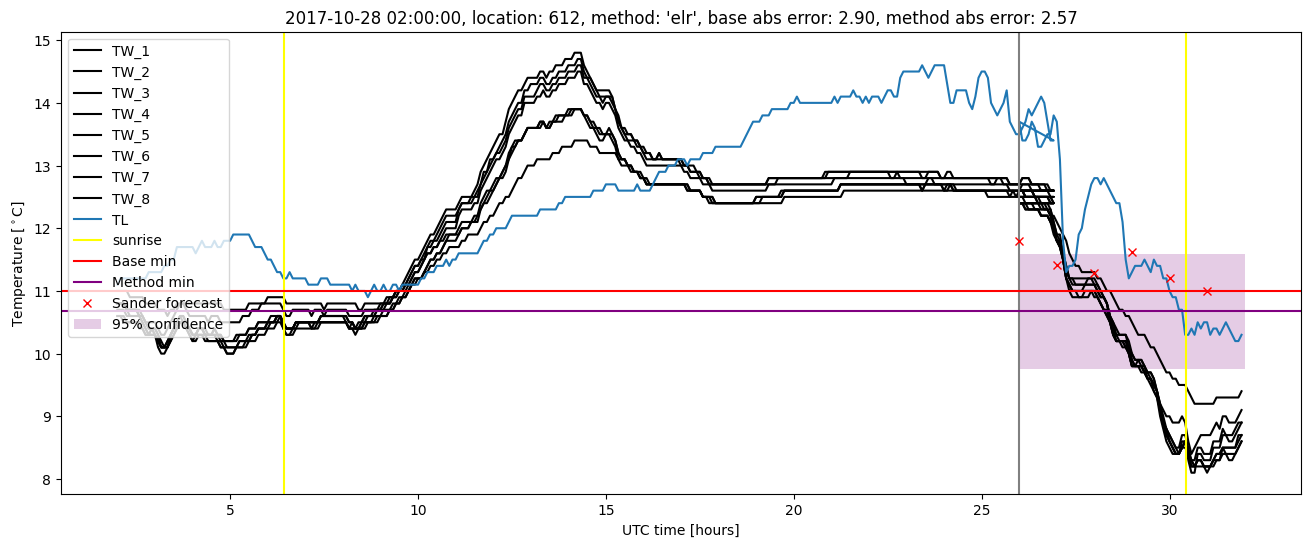
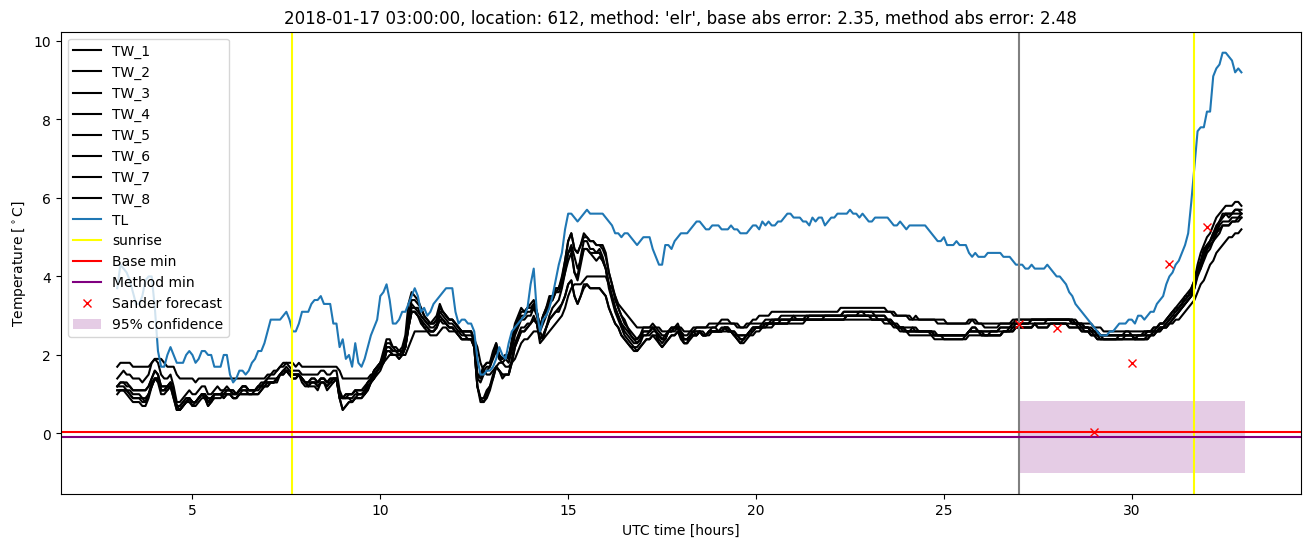
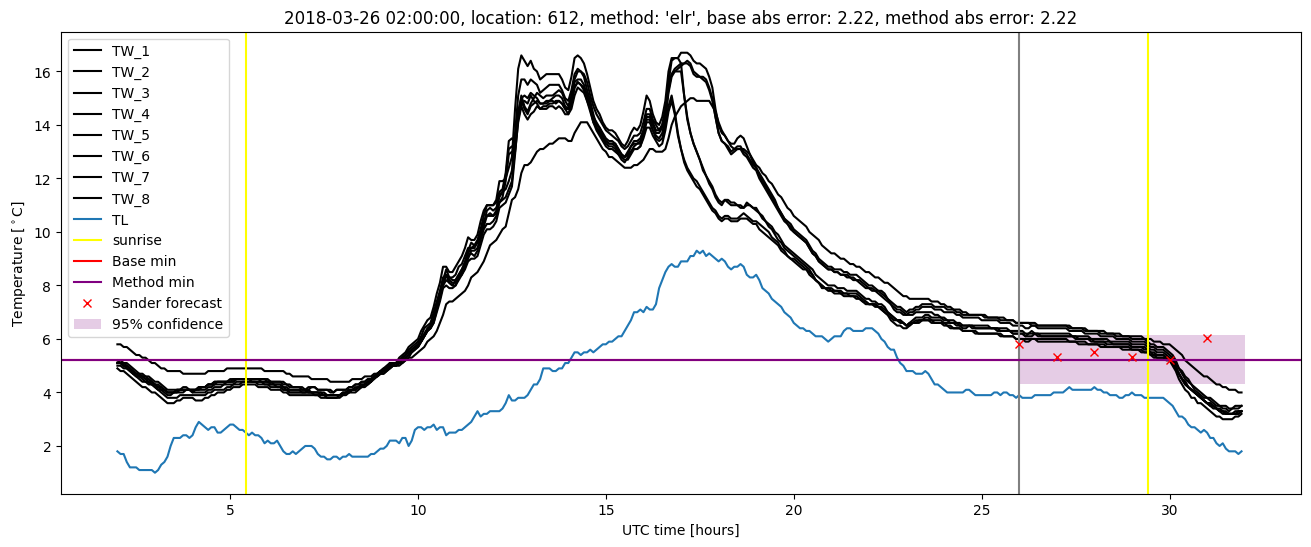
Extended logistic regression plots