GMS location: 611
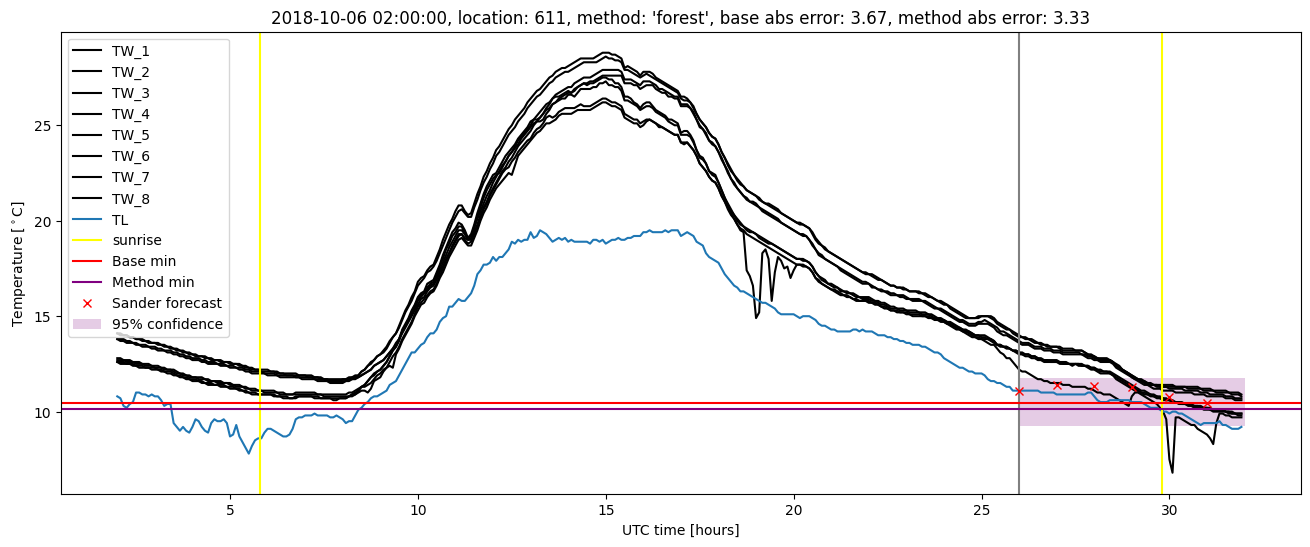
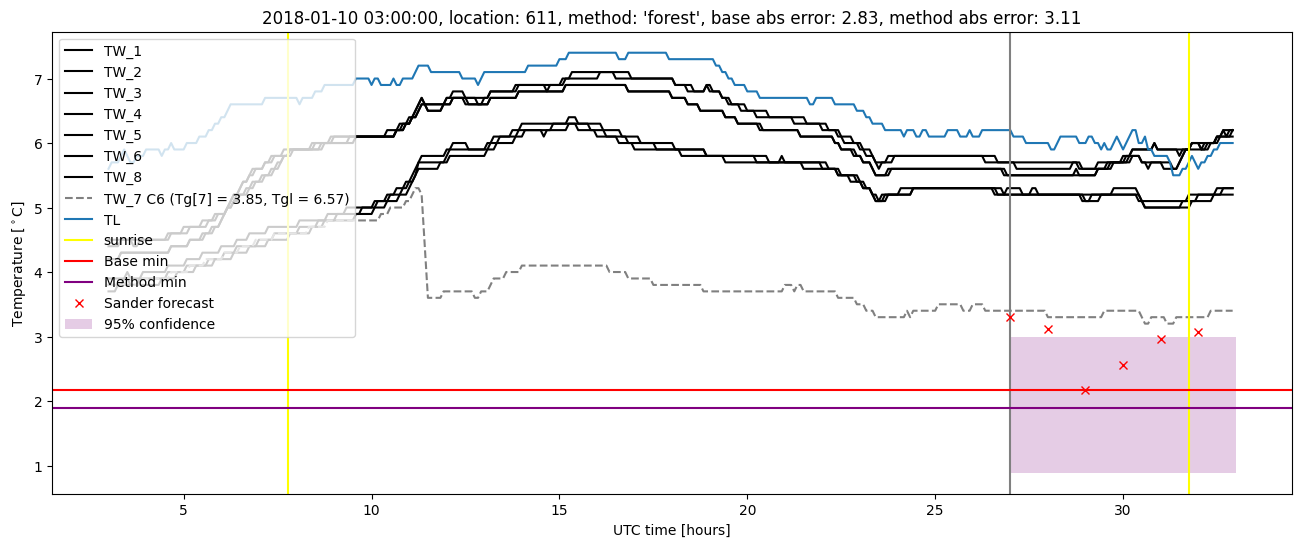
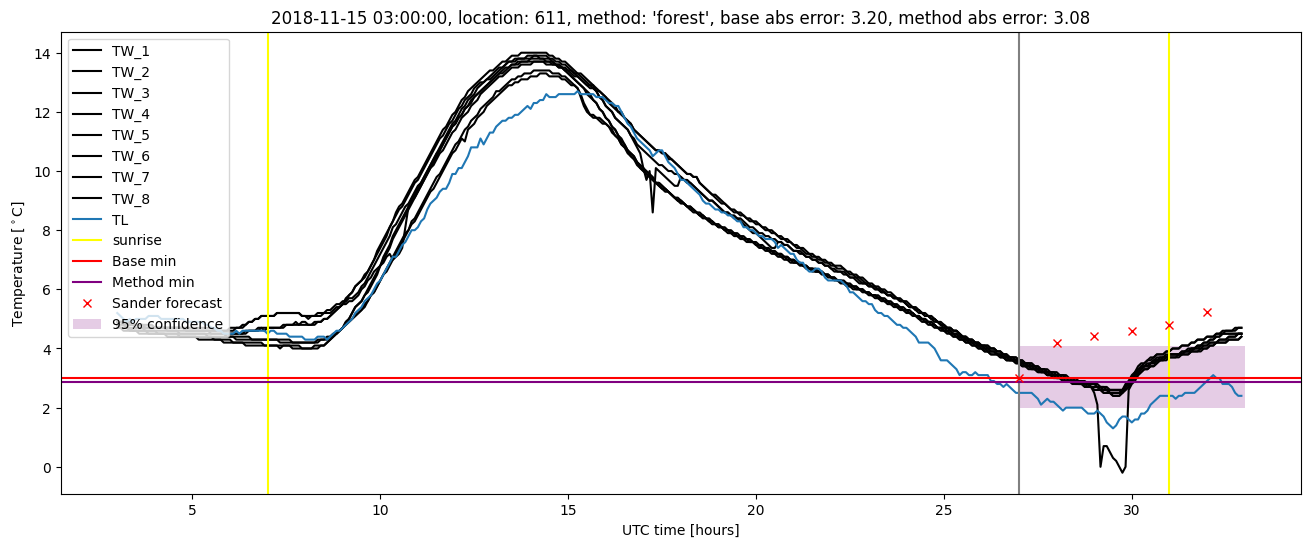
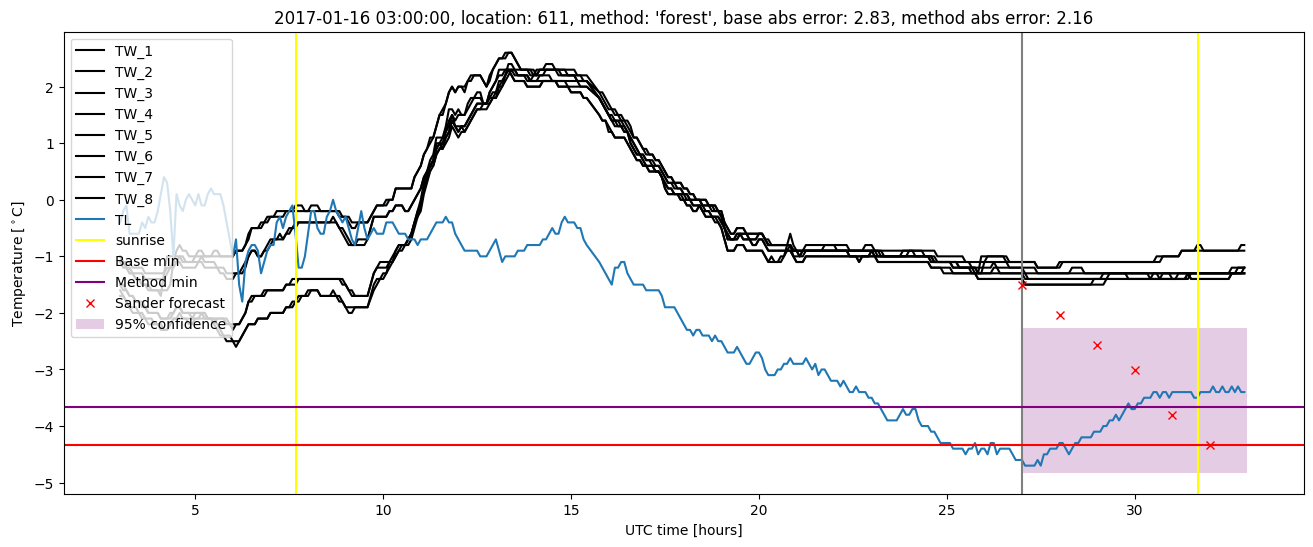
Random forest results
| names |
period |
power |
significance |
meanSquareError |
absError |
maxError |
CRPS |
IGN |
| baseline |
winter 2016 |
0.968 |
0.105 |
0.352 |
0.464 |
1.602 |
NaN |
NaN |
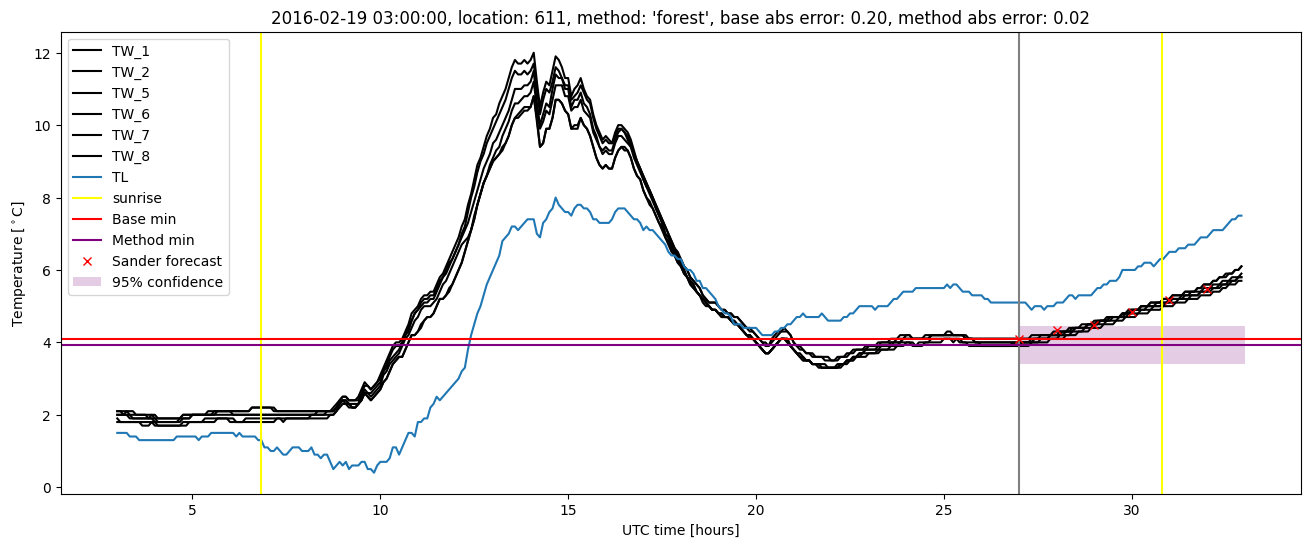
| forest |
winter 2016 |
0.968 |
0.105 |
0.272 |
0.397 |
1.384 |
0.498 |
2.469 |
| baseline |
winter 2017 |
0.966 |
0.111 |
0.482 |
0.502 |
2.835 |
NaN |
NaN |
| forest |
winter 2017 |
0.966 |
0.111 |
0.409 |
0.456 |
2.161 |
0.479 |
2.046 |
| baseline |
winter 2018 |
0.985 |
0.108 |
0.393 |
0.449 |
2.830 |
NaN |
NaN |
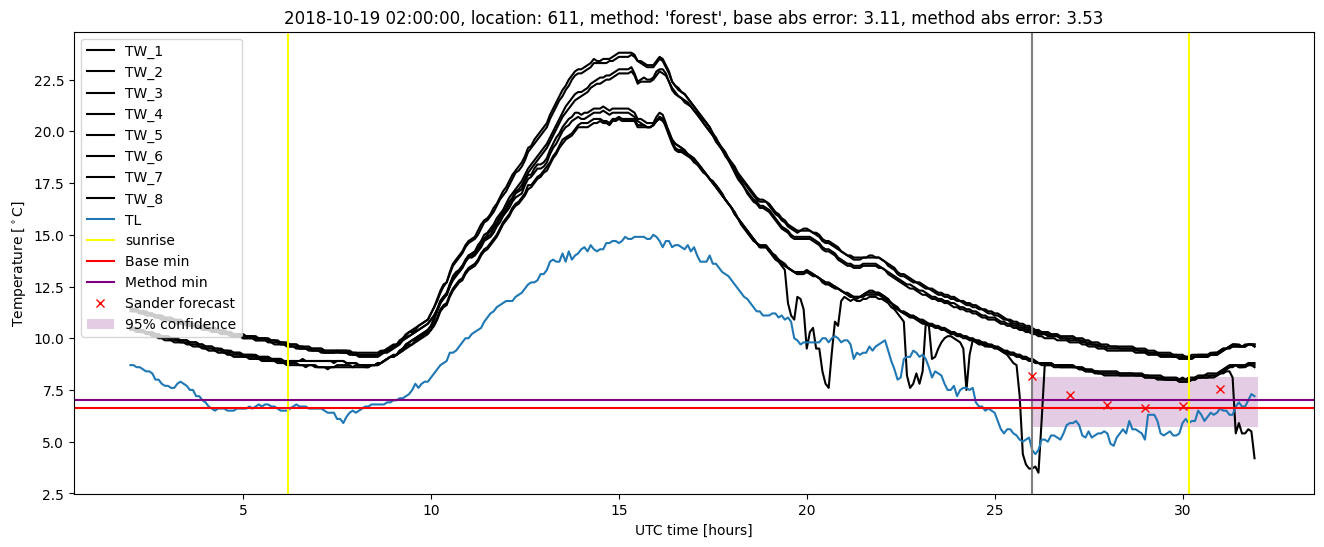
| forest |
winter 2018 |
0.985 |
0.108 |
0.360 |
0.439 |
3.109 |
0.497 |
2.445 |
| baseline |
winter 2019 |
0.993 |
0.071 |
0.576 |
0.500 |
3.670 |
NaN |
NaN |
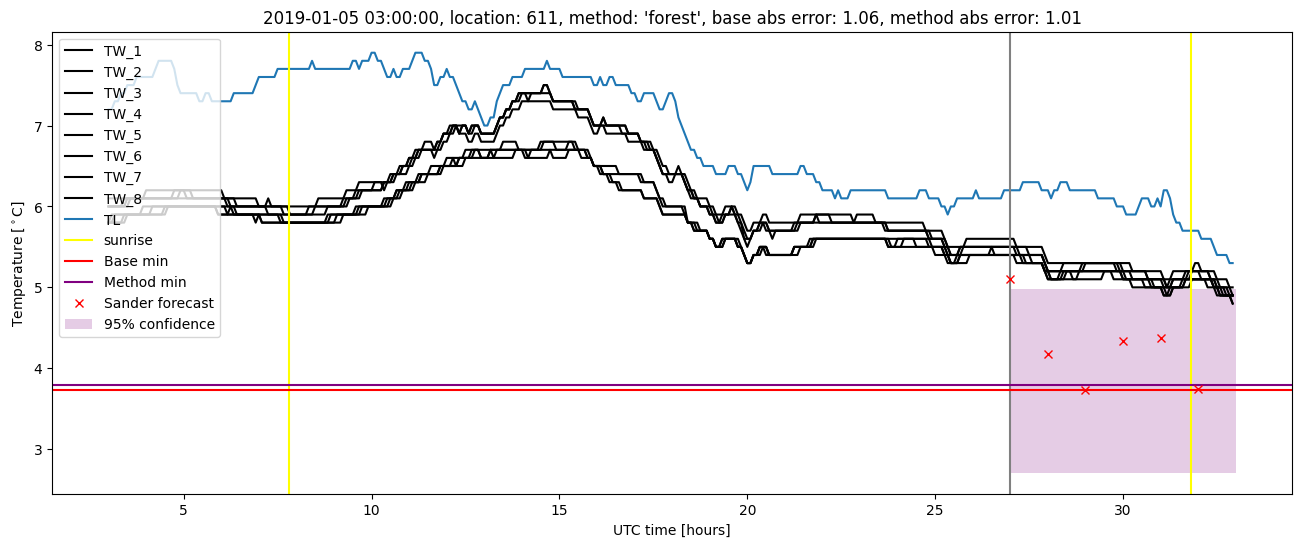
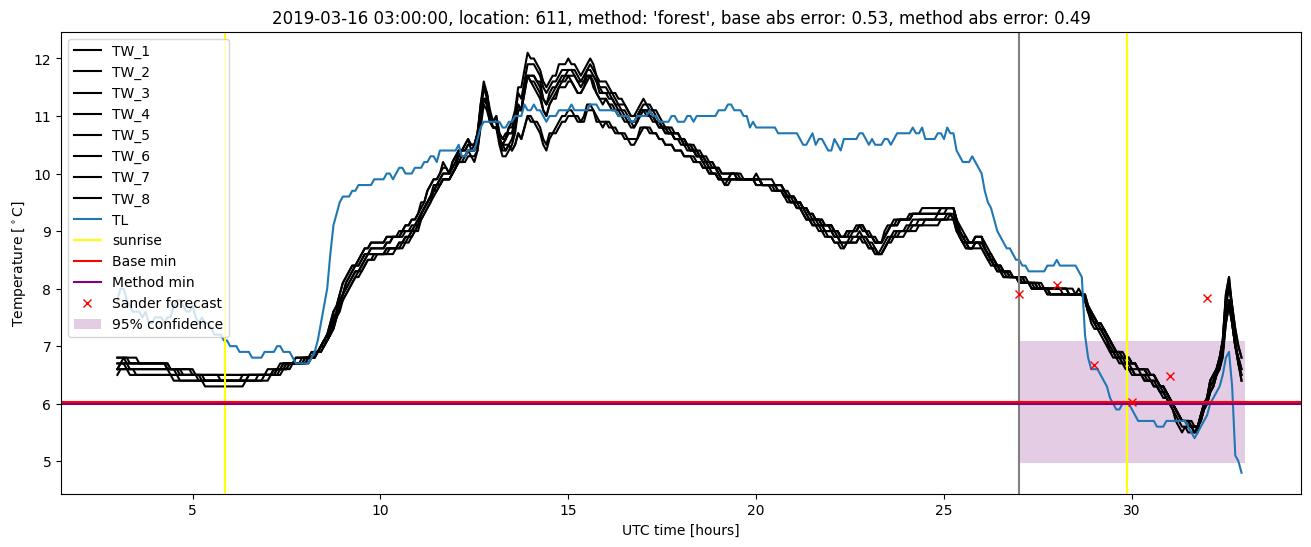
| forest |
winter 2019 |
0.993 |
0.071 |
0.519 |
0.472 |
3.526 |
0.496 |
3.104 |
| baseline |
all |
0.979 |
0.104 |
0.451 |
0.478 |
3.670 |
NaN |
NaN |
| forest |
all |
0.979 |
0.104 |
0.391 |
0.442 |
3.526 |
0.493 |
2.515 |
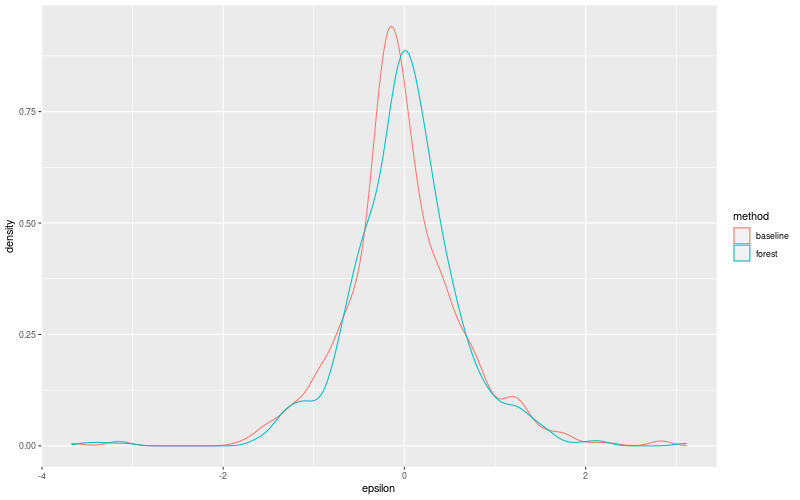
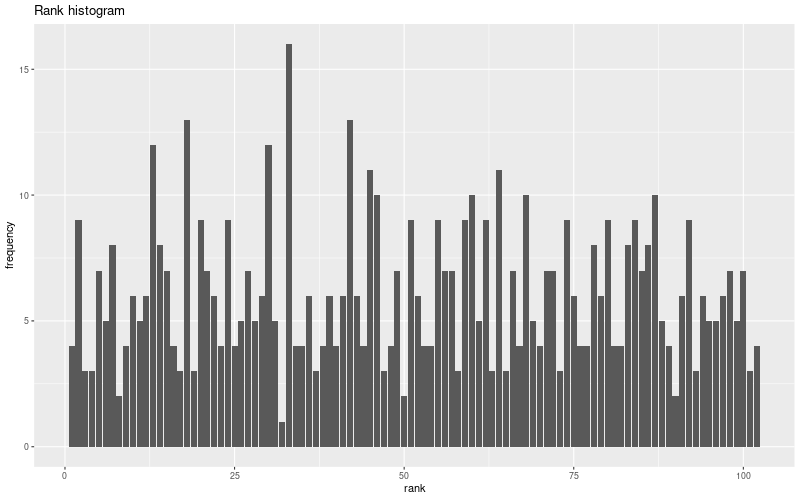
Random forest plots
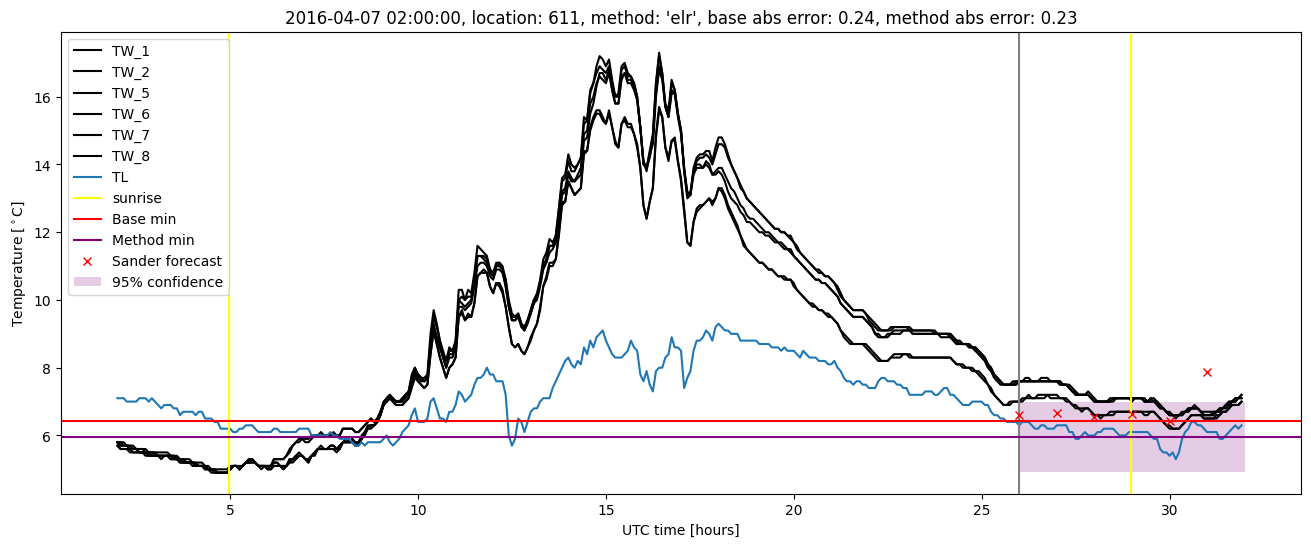
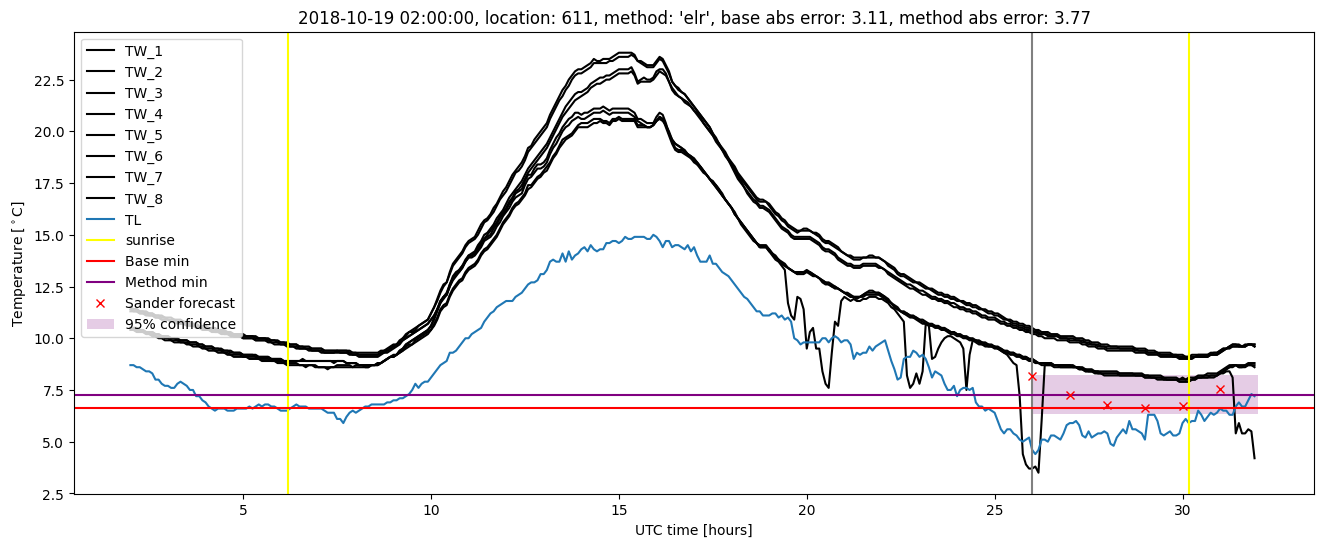
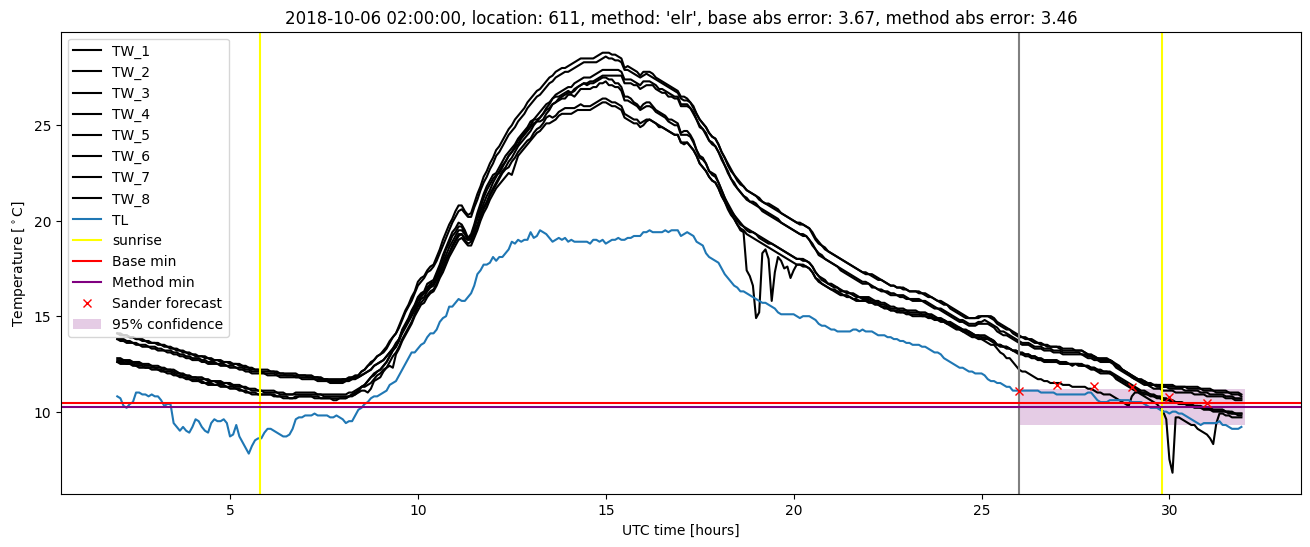
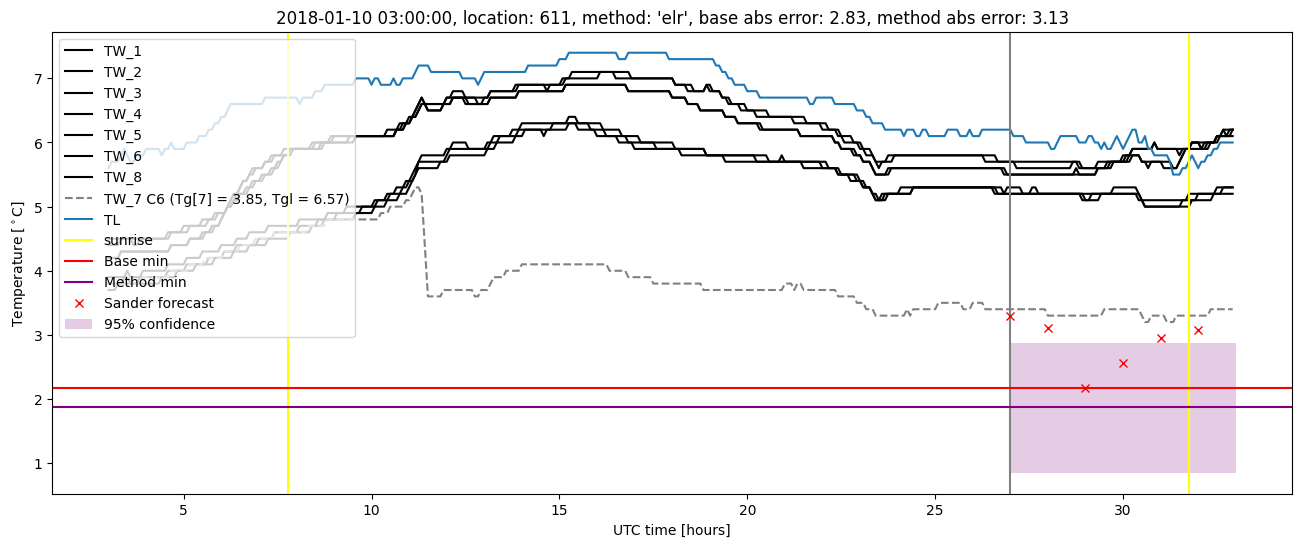
Extended logistic regression results
| names |
period |
power |
significance |
meanSquareError |
absError |
maxError |
CRPS |
IGN |
| baseline |
winter 2016 |
0.968 |
0.105 |
0.352 |
0.464 |
1.602 |
NaN |
NaN |
| elr |
winter 2016 |
0.944 |
0.053 |
0.343 |
0.446 |
1.631 |
0.536 |
2.532 |
| baseline |
winter 2017 |
0.966 |
0.111 |
0.482 |
0.502 |
2.835 |
NaN |
NaN |
| elr |
winter 2017 |
0.974 |
0.139 |
0.428 |
0.461 |
2.367 |
0.504 |
2.372 |
| baseline |
winter 2018 |
0.985 |
0.108 |
0.393 |
0.449 |
2.830 |
NaN |
NaN |
| elr |
winter 2018 |
0.978 |
0.027 |
0.410 |
0.503 |
3.132 |
0.598 |
3.223 |
| baseline |
winter 2019 |
0.993 |
0.071 |
0.576 |
0.500 |
3.670 |
NaN |
NaN |
| elr |
winter 2019 |
0.993 |
0.071 |
0.527 |
0.483 |
3.775 |
0.542 |
3.295 |
| baseline |
all |
0.979 |
0.104 |
0.451 |
0.478 |
3.670 |
NaN |
NaN |
| elr |
all |
0.973 |
0.075 |
0.428 |
0.475 |
3.775 |
0.547 |
2.874 |
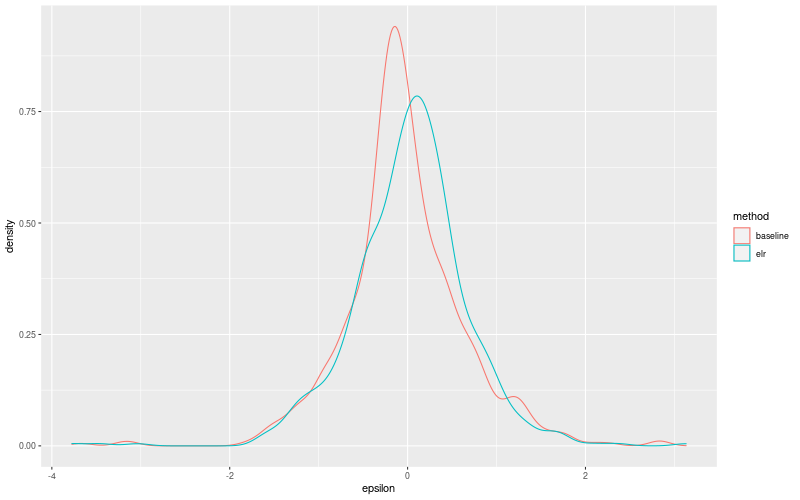
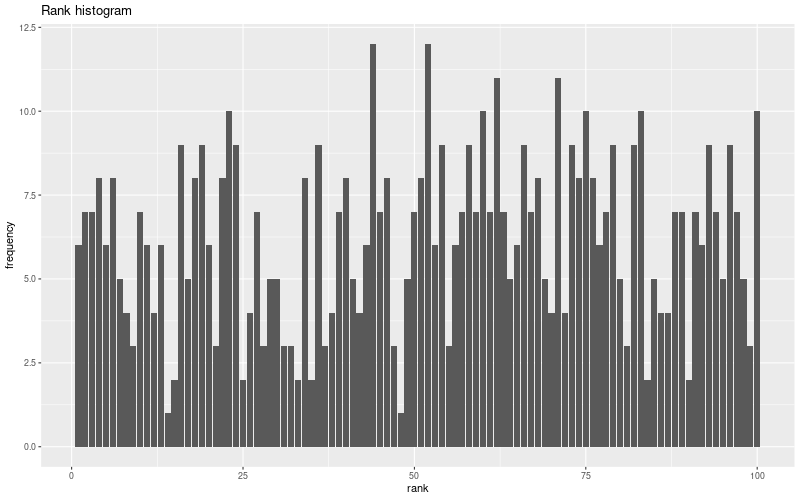
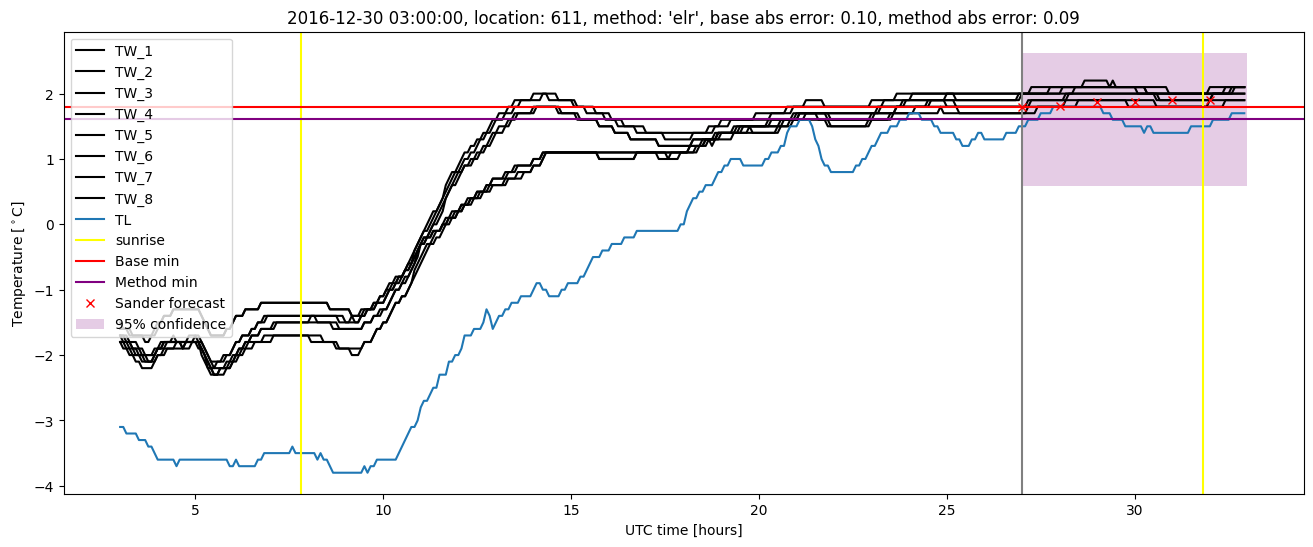
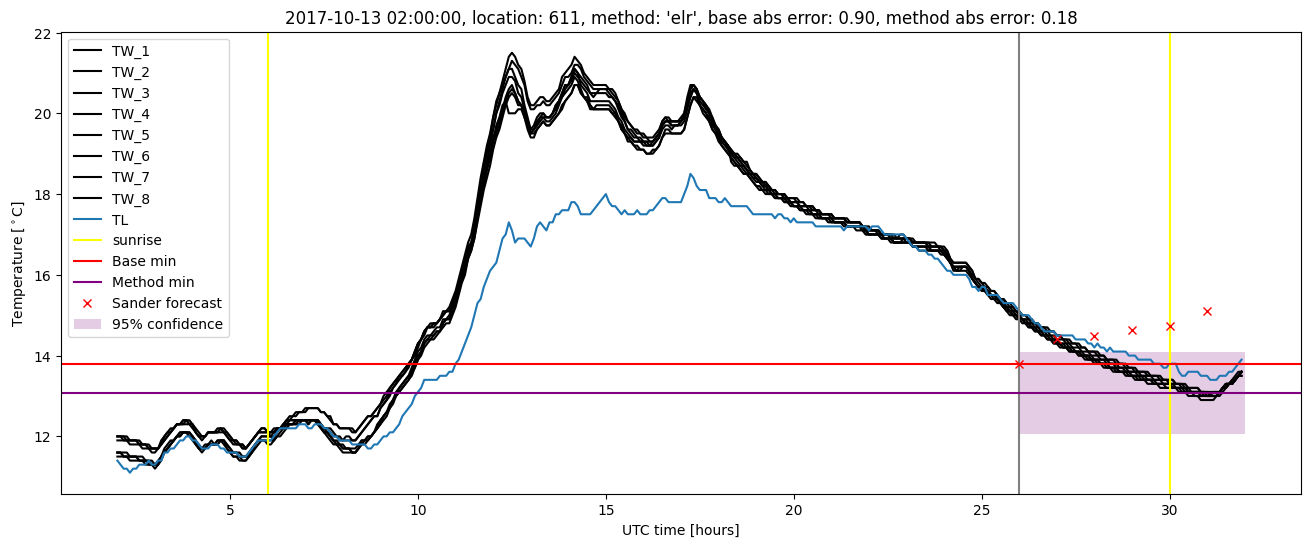
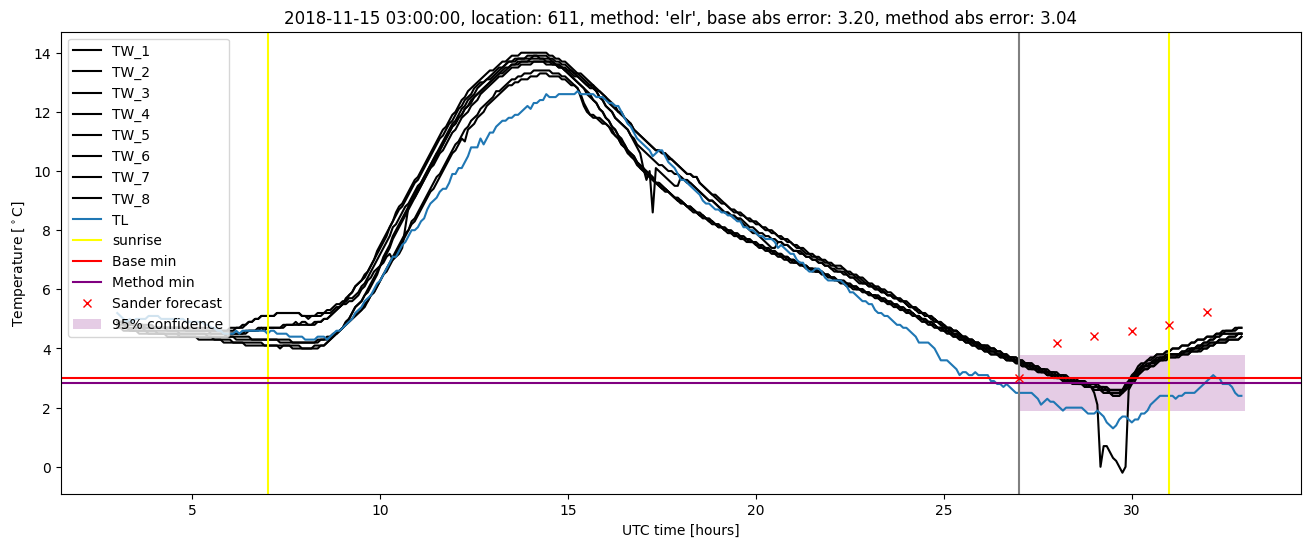
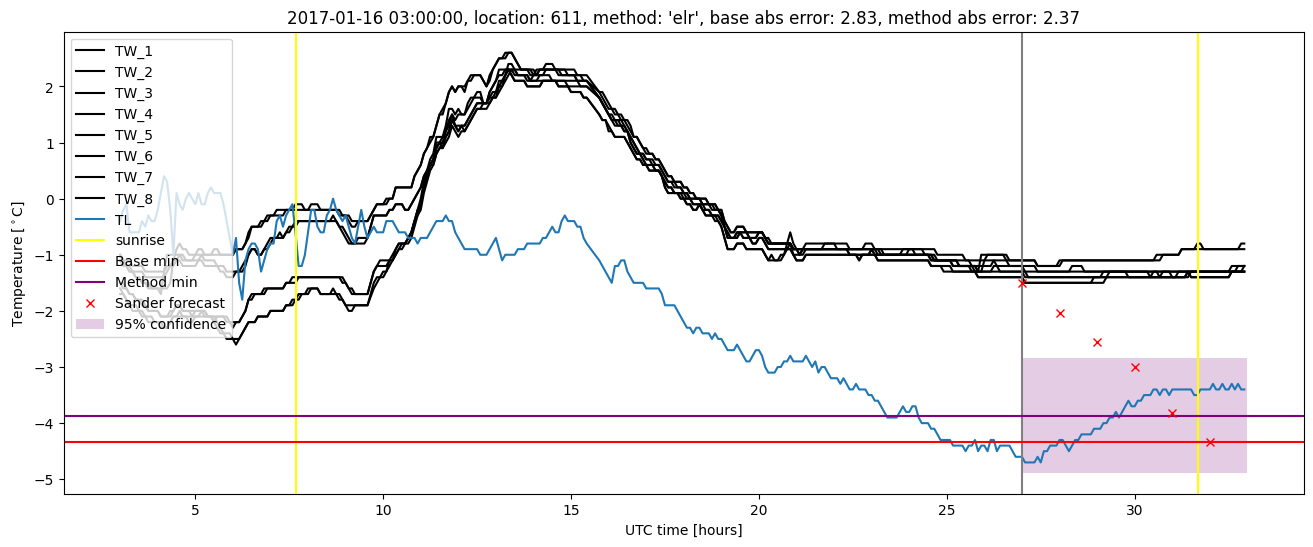
Extended logistic regression plots