GMS location: 610
Random forest results
| names |
period |
power |
significance |
meanSquareError |
absError |
maxError |
CRPS |
IGN |
| baseline |
winter 2016 |
0.983 |
0.067 |
0.350 |
0.444 |
1.822 |
NaN |
NaN |
| forest |
winter 2016 |
0.989 |
0.133 |
0.256 |
0.375 |
1.530 |
0.453 |
3.599 |
| baseline |
winter 2017 |
0.966 |
0.000e+00 |
0.456 |
0.472 |
2.723 |
NaN |
NaN |
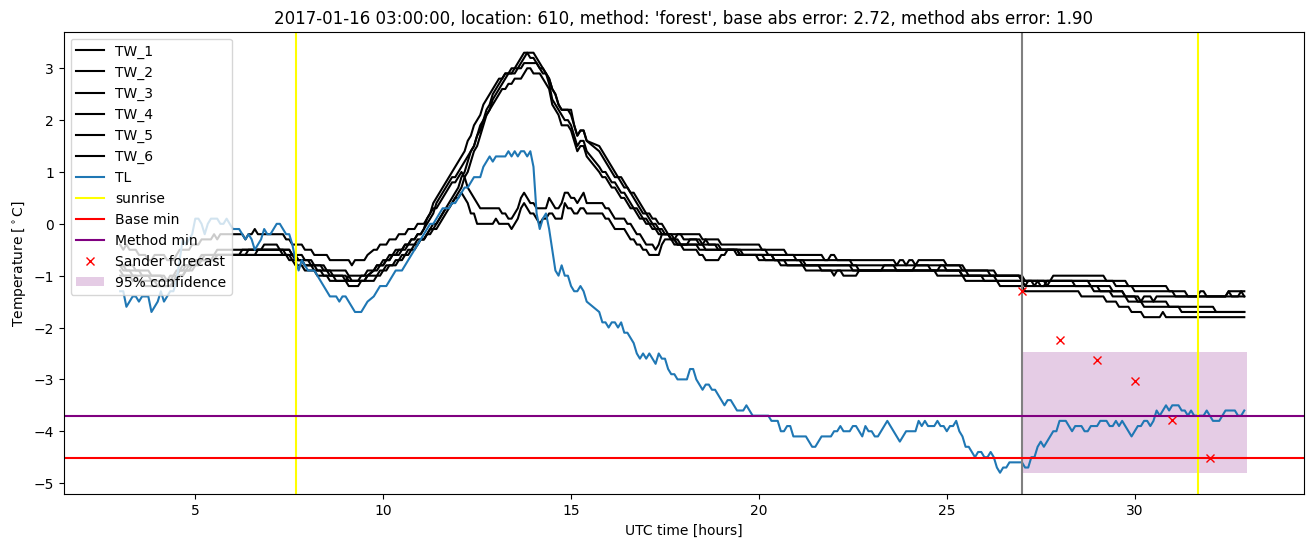
| forest |
winter 2017 |
0.992 |
0.000e+00 |
0.314 |
0.402 |
1.901 |
0.466 |
4.853 |
| baseline |
winter 2018 |
0.986 |
0.062 |
0.400 |
0.451 |
2.315 |
NaN |
NaN |
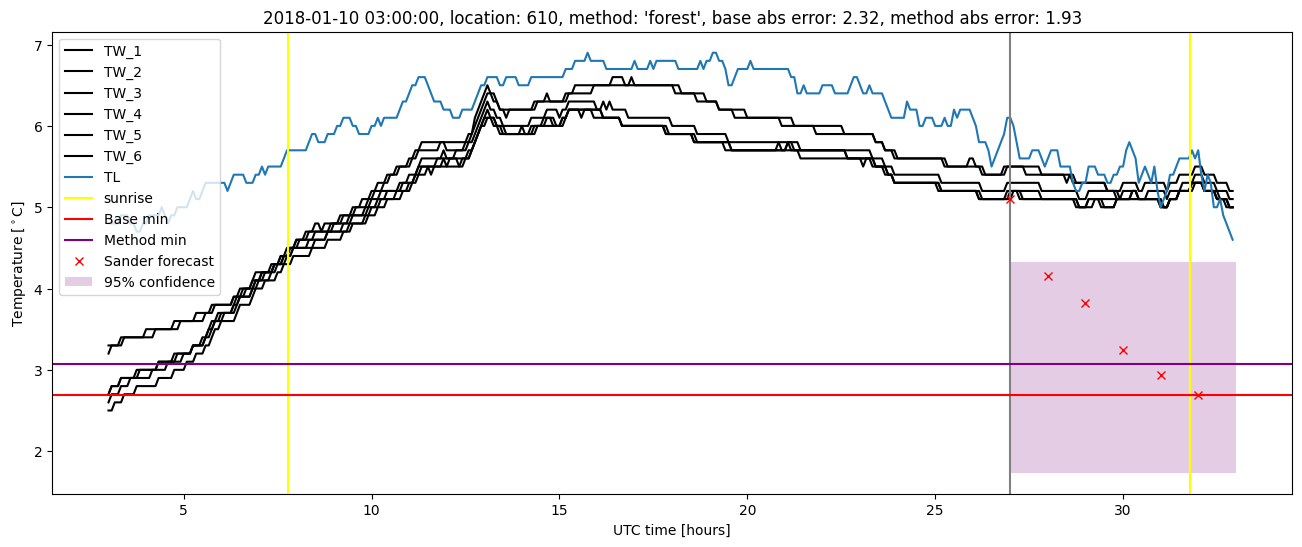
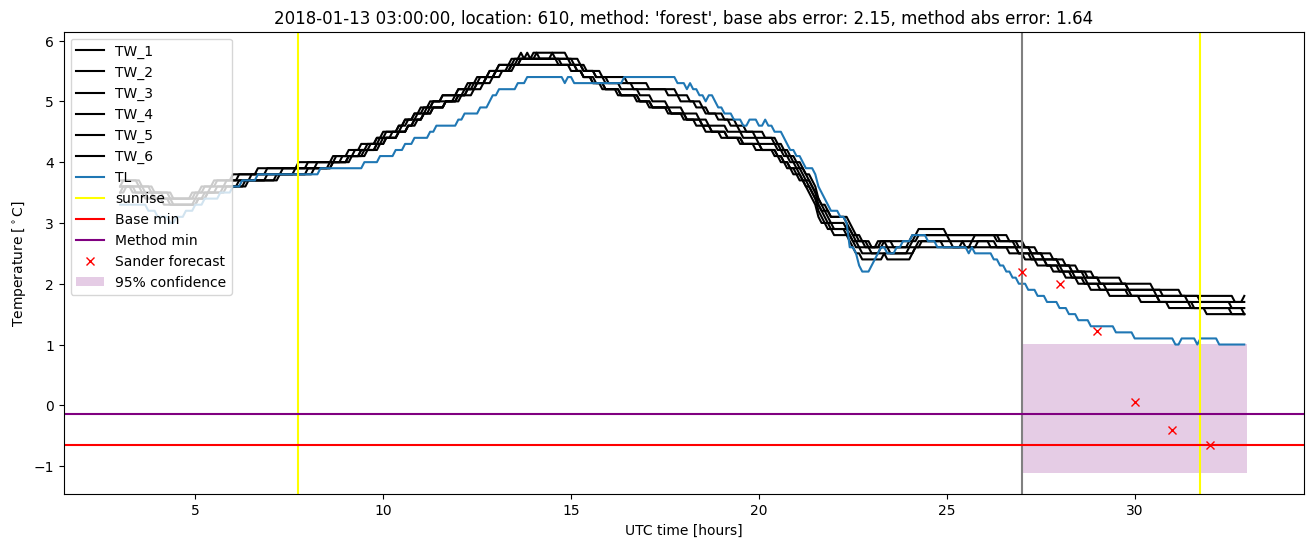
| forest |
winter 2018 |
0.979 |
0.125 |
0.313 |
0.403 |
2.090 |
0.482 |
3.899 |
| baseline |
winter 2019 |
1.000 |
0.071 |
0.309 |
0.411 |
2.043 |
NaN |
NaN |
| forest |
winter 2019 |
1.000 |
0.071 |
0.237 |
0.380 |
1.298 |
0.478 |
3.914 |
| baseline |
all |
0.984 |
0.045 |
0.377 |
0.445 |
2.723 |
NaN |
NaN |
| forest |
all |
0.990 |
0.081 |
0.279 |
0.389 |
2.090 |
0.469 |
4.023 |
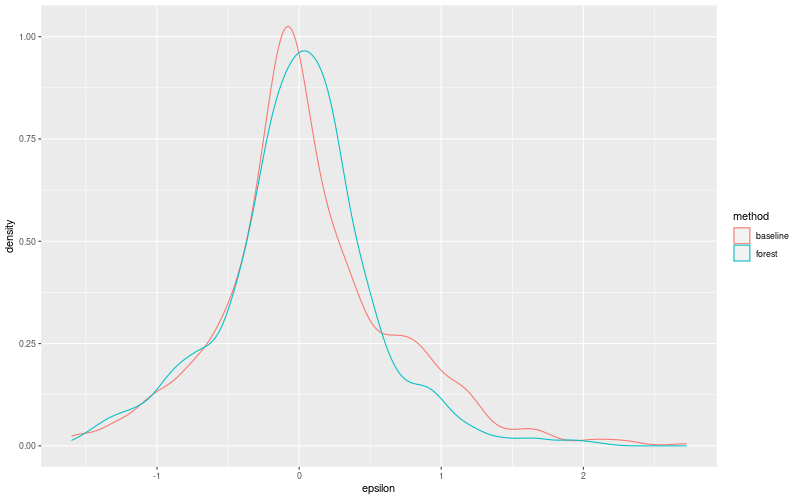
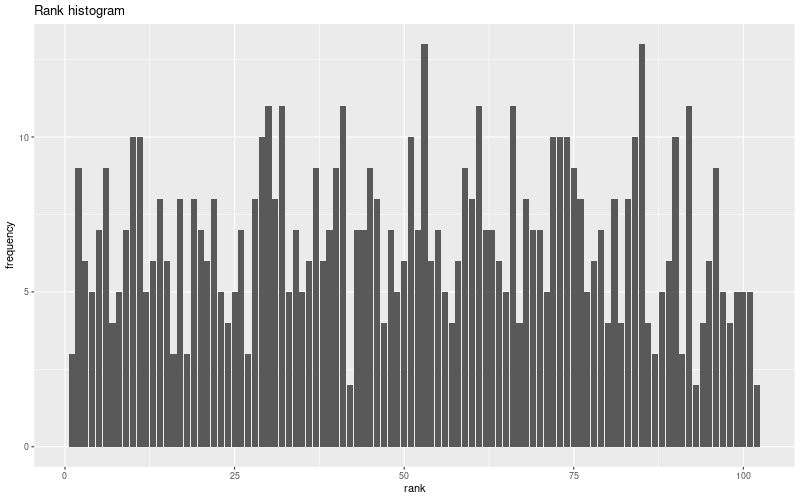
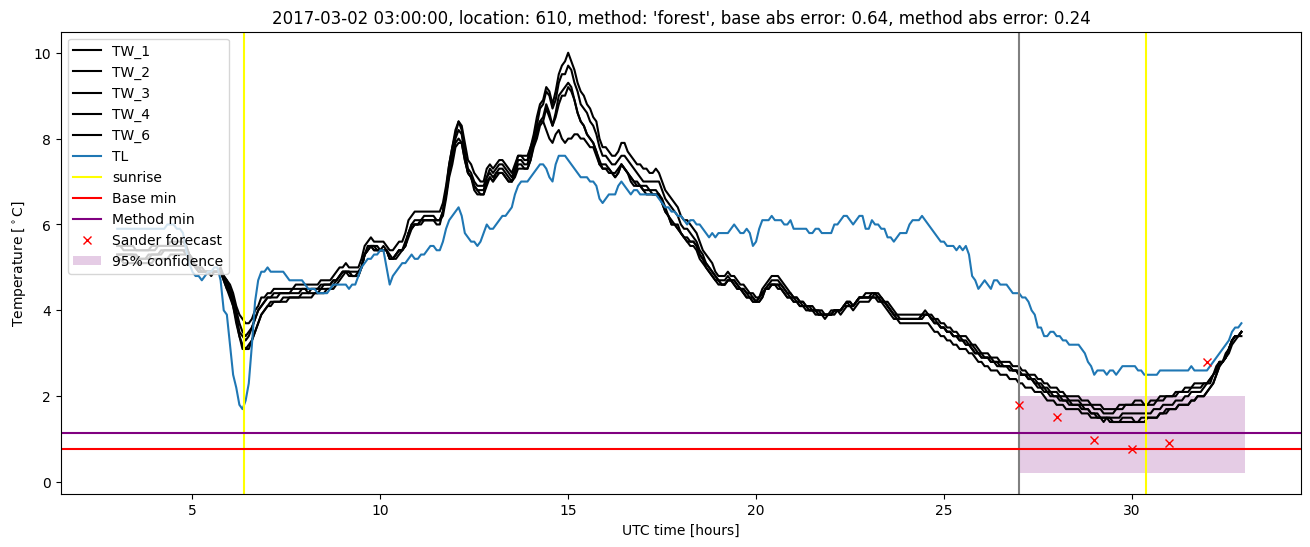
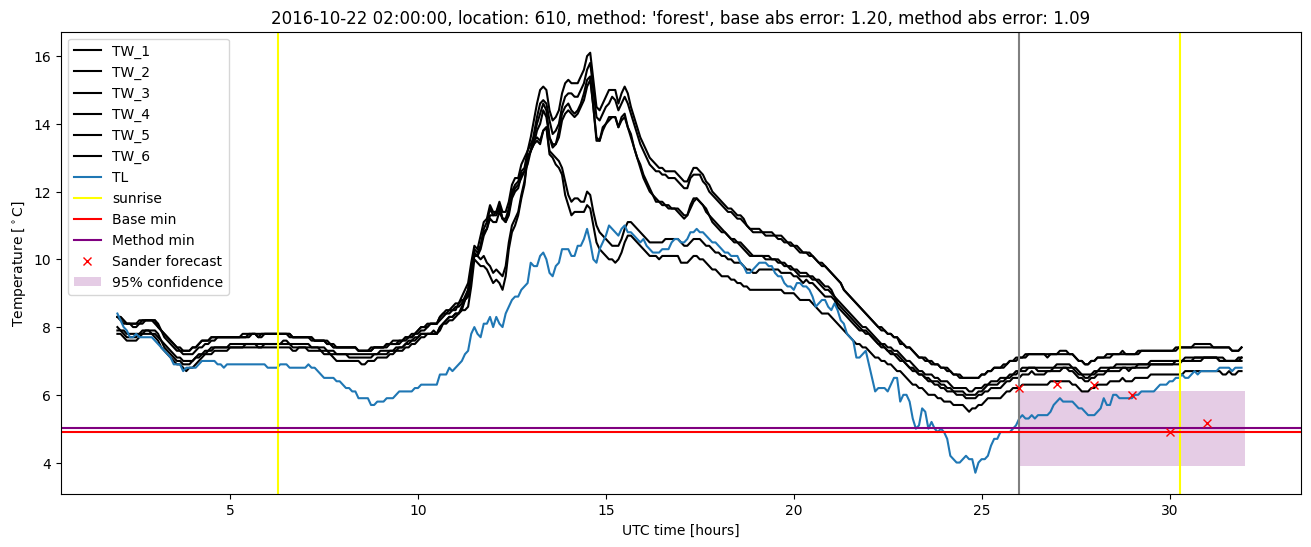
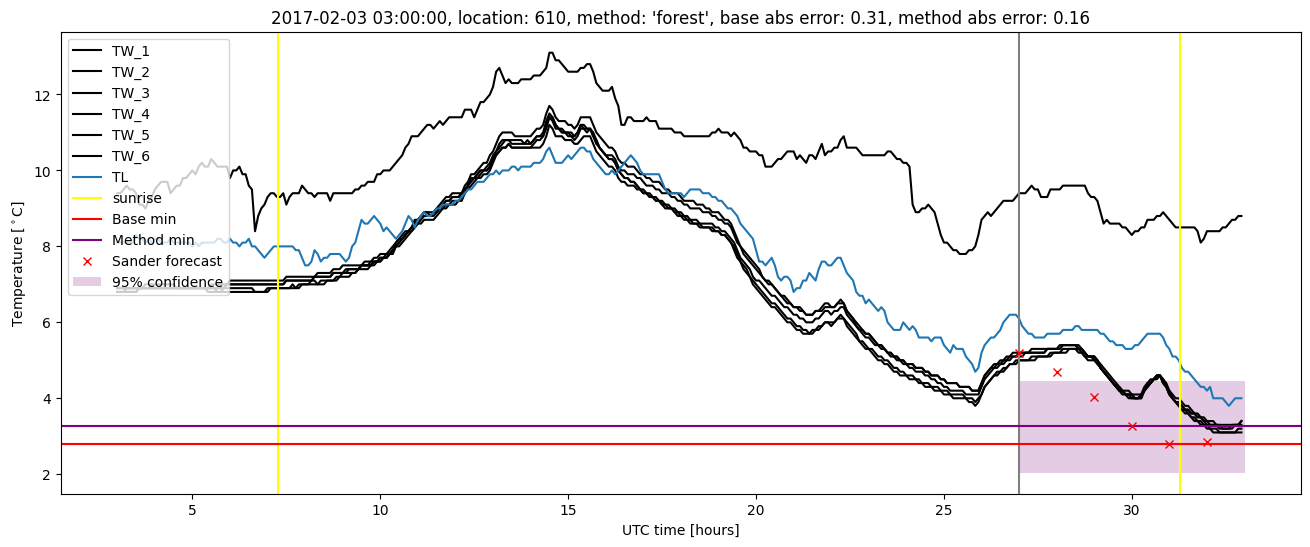
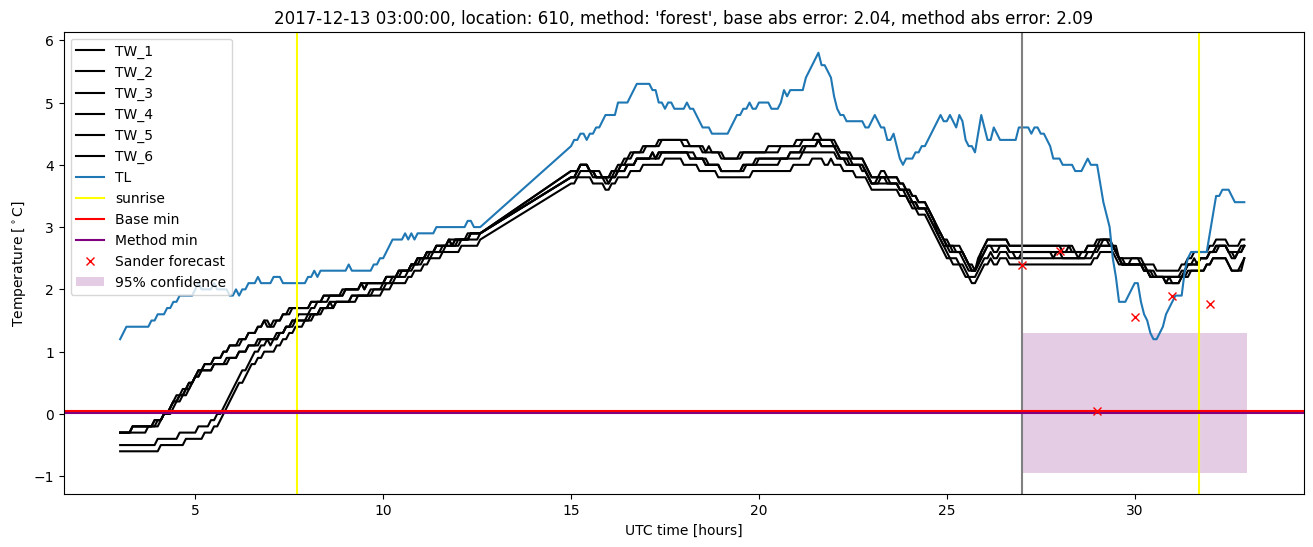
Random forest plots

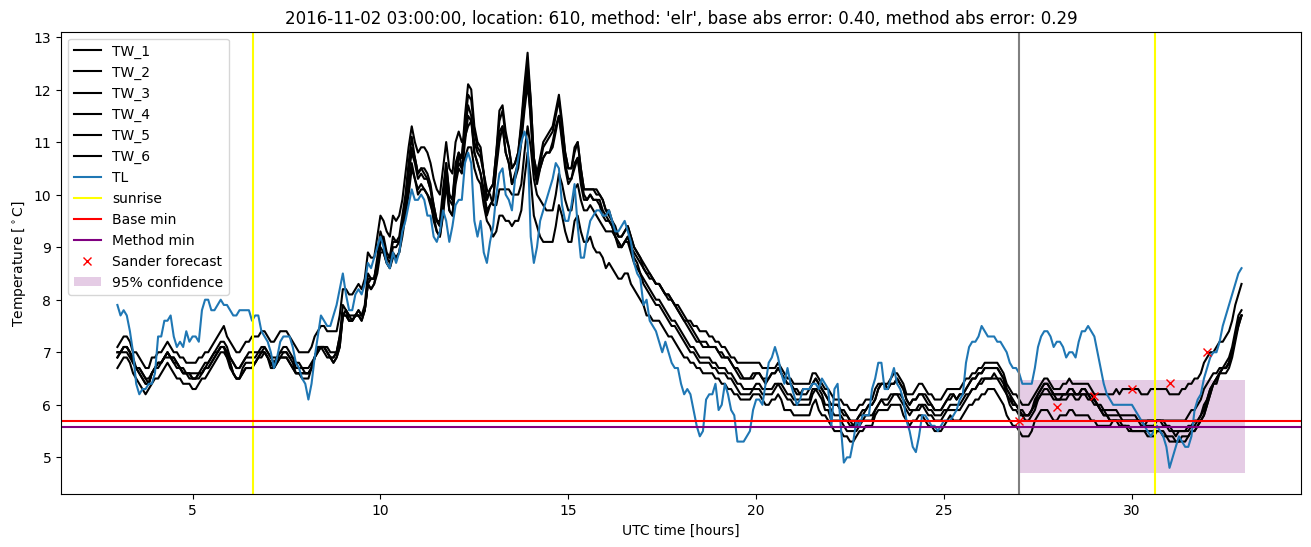
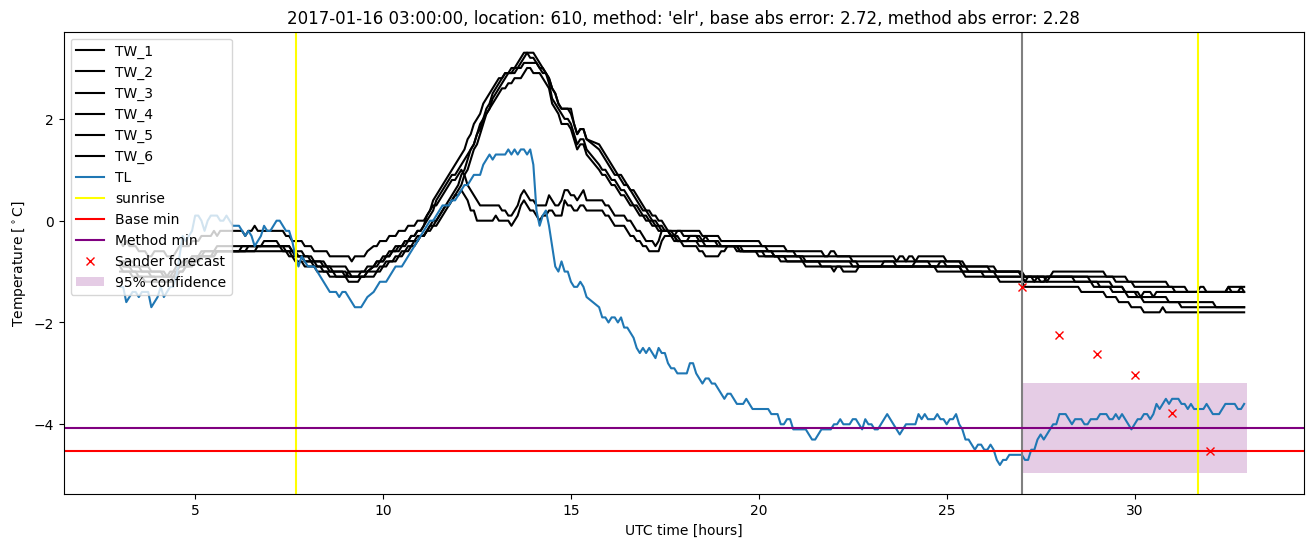
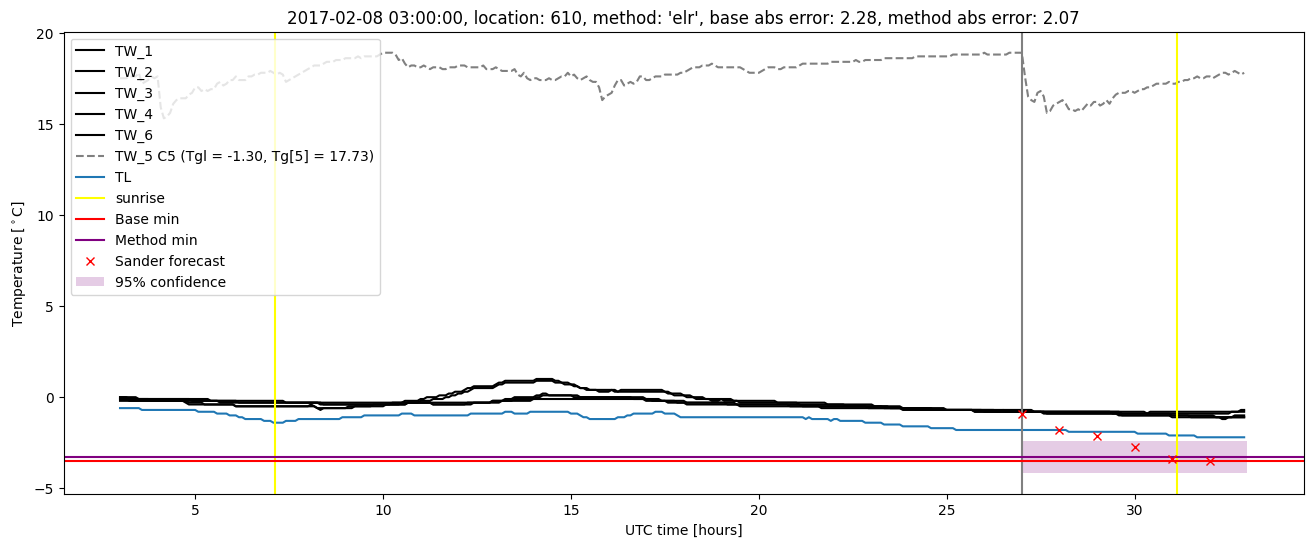
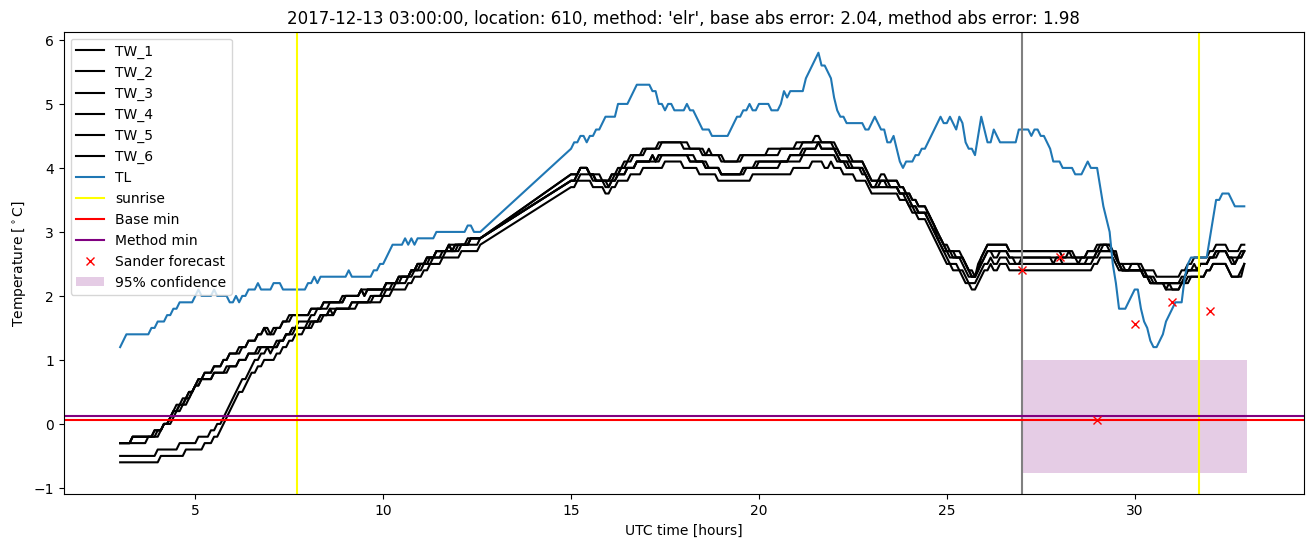
Extended logistic regression results
| names |
period |
power |
significance |
meanSquareError |
absError |
maxError |
CRPS |
IGN |
| baseline |
winter 2016 |
0.983 |
0.067 |
0.350 |
0.444 |
1.822 |
NaN |
NaN |
| elr |
winter 2016 |
0.983 |
0.067 |
0.269 |
0.419 |
1.654 |
0.546 |
3.657 |
| baseline |
winter 2017 |
0.966 |
0.000e+00 |
0.456 |
0.472 |
2.723 |
NaN |
NaN |
| elr |
winter 2017 |
0.983 |
0.000e+00 |
0.343 |
0.429 |
2.278 |
0.514 |
3.947 |
| baseline |
winter 2018 |
0.986 |
0.062 |
0.400 |
0.451 |
2.315 |
NaN |
NaN |
| elr |
winter 2018 |
0.993 |
0.094 |
0.314 |
0.433 |
1.982 |
0.549 |
4.379 |
| baseline |
winter 2019 |
1.000 |
0.071 |
0.309 |
0.411 |
2.043 |
NaN |
NaN |
| elr |
winter 2019 |
1.000 |
0.071 |
0.327 |
0.447 |
1.486 |
0.534 |
3.666 |
| baseline |
all |
0.984 |
0.045 |
0.377 |
0.445 |
2.723 |
NaN |
NaN |
| elr |
all |
0.990 |
0.054 |
0.310 |
0.431 |
2.278 |
0.537 |
3.908 |
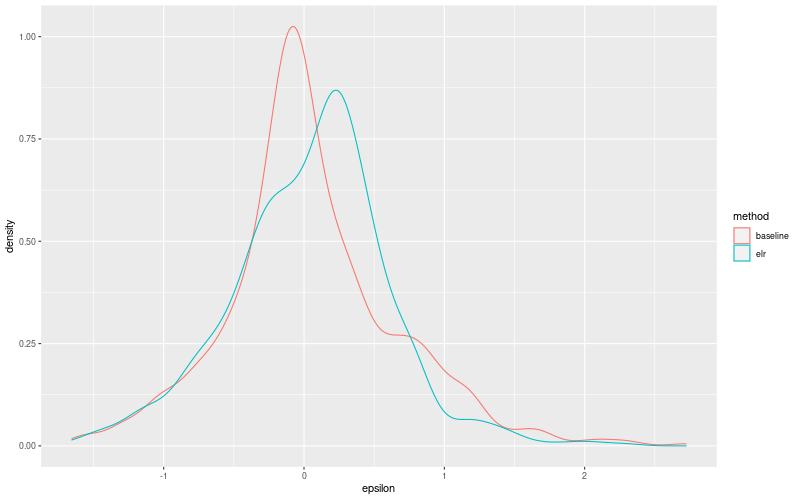
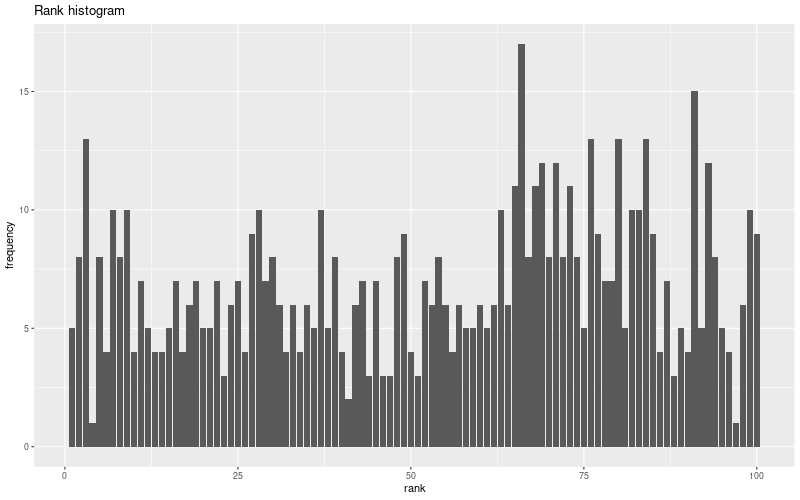
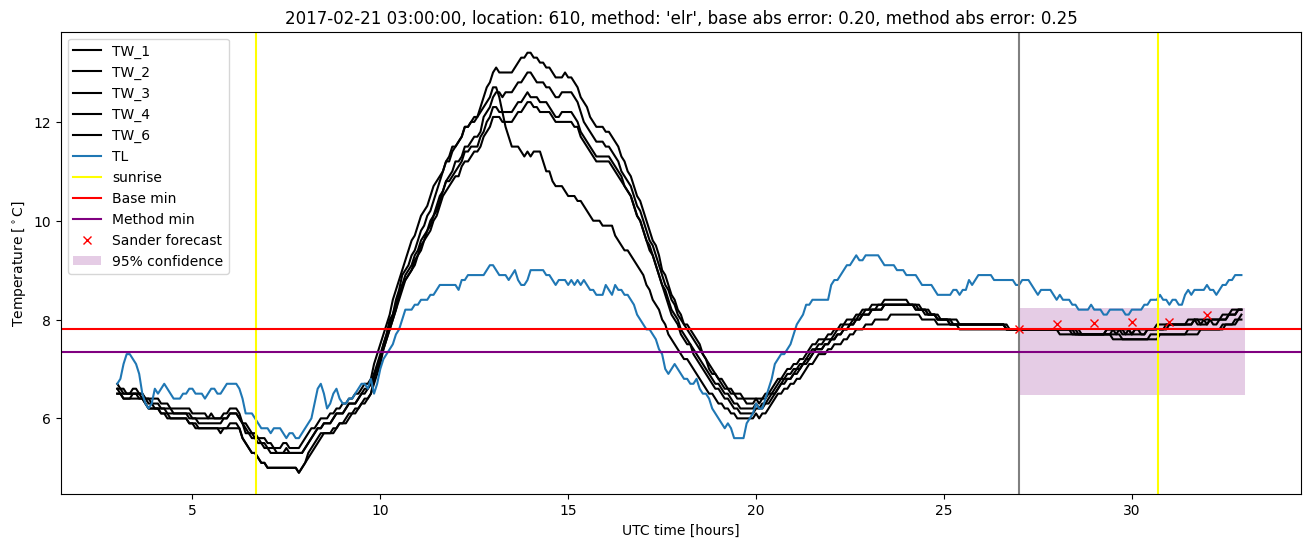
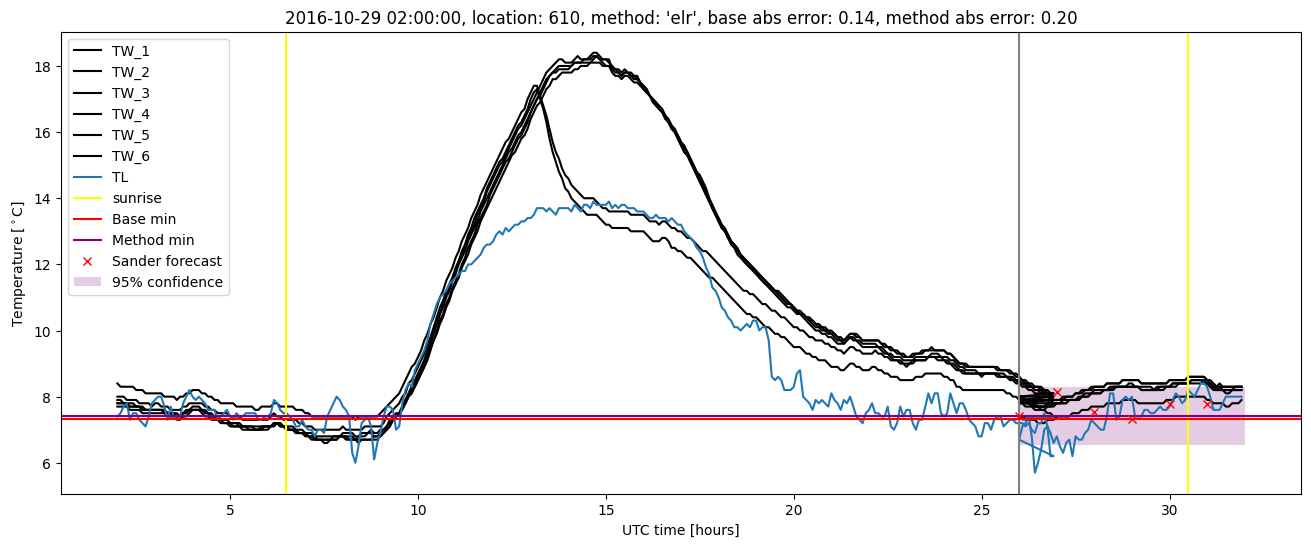
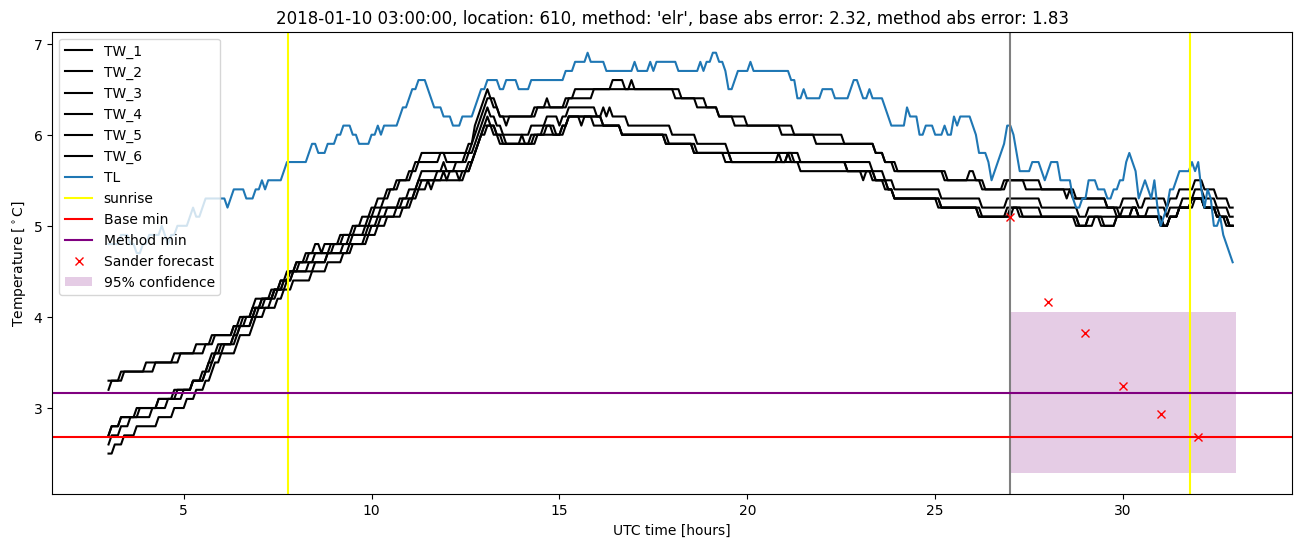
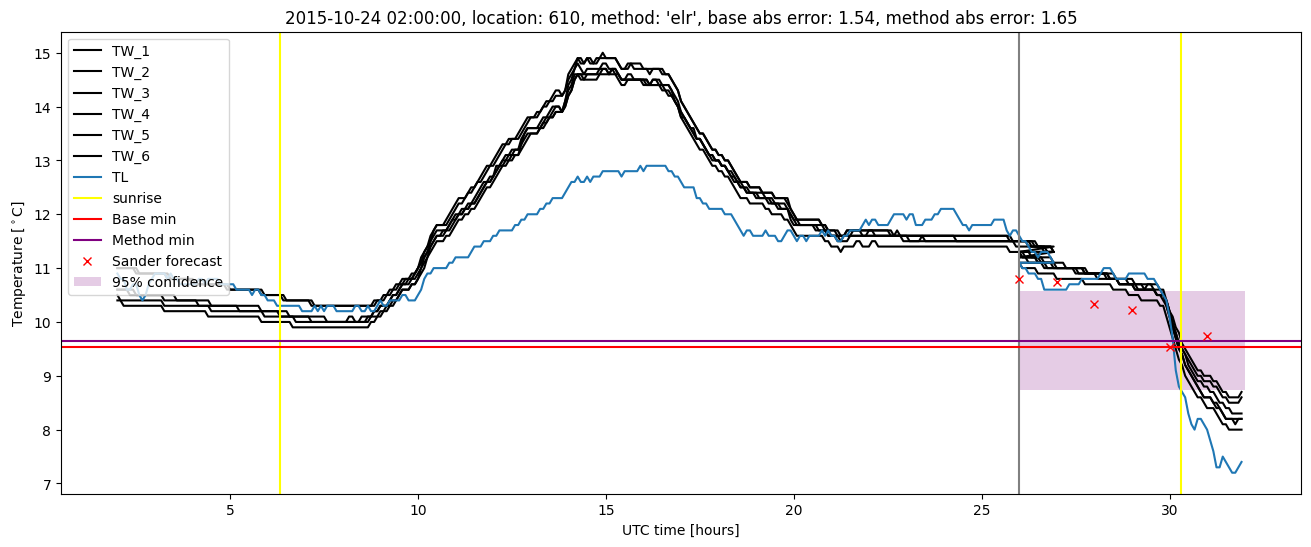
Extended logistic regression plots