GMS location: 609
Random forest results
| names |
period |
power |
significance |
meanSquareError |
absError |
maxError |
CRPS |
IGN |
| baseline |
winter 2016 |
0.989 |
0.000e+00 |
0.347 |
0.453 |
1.632 |
NaN |
NaN |
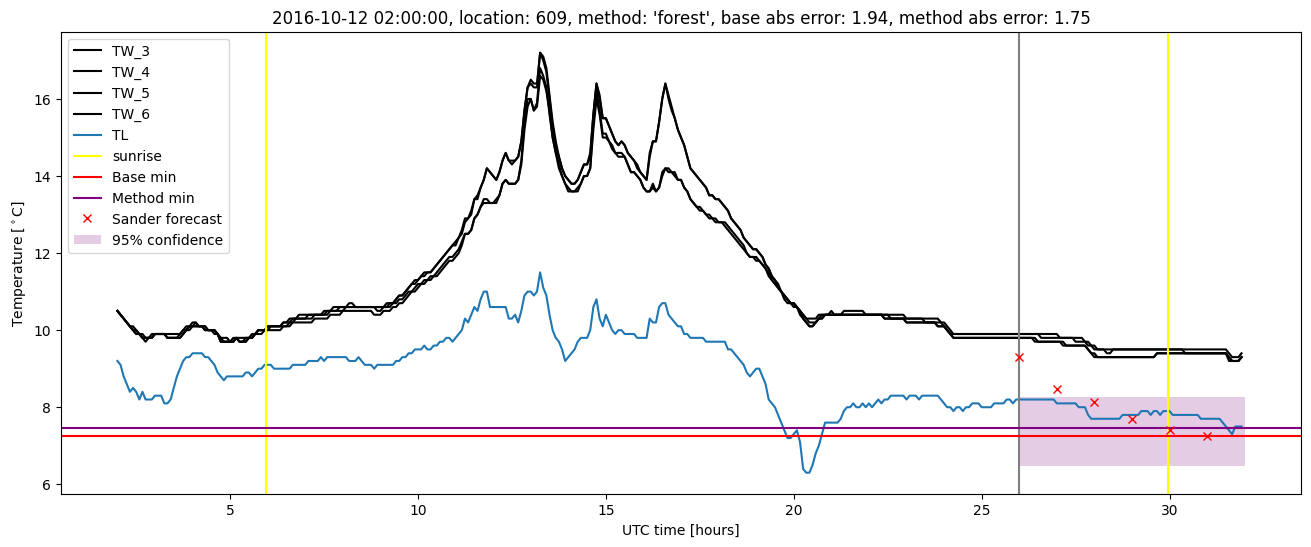
| forest |
winter 2016 |
0.994 |
0.000e+00 |
0.257 |
0.395 |
1.619 |
0.452 |
2.992 |
| baseline |
winter 2017 |
0.975 |
0.062 |
0.468 |
0.486 |
2.859 |
NaN |
NaN |
| forest |
winter 2017 |
0.983 |
0.062 |
0.334 |
0.403 |
2.031 |
0.448 |
3.344 |
| baseline |
winter 2018 |
0.993 |
0.031 |
0.339 |
0.396 |
2.325 |
NaN |
NaN |
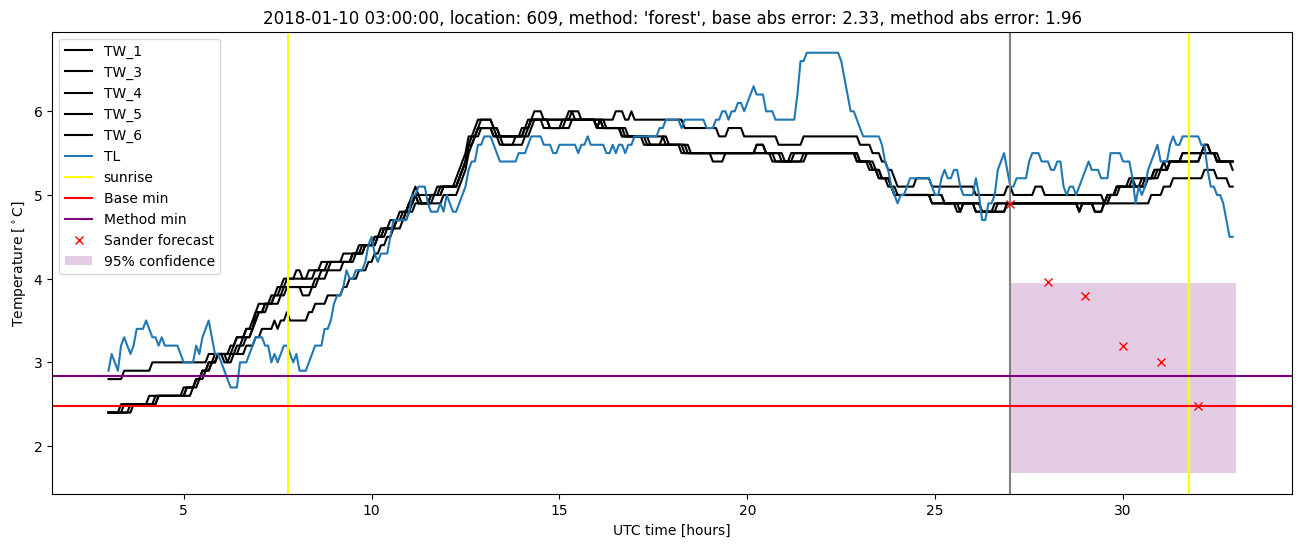
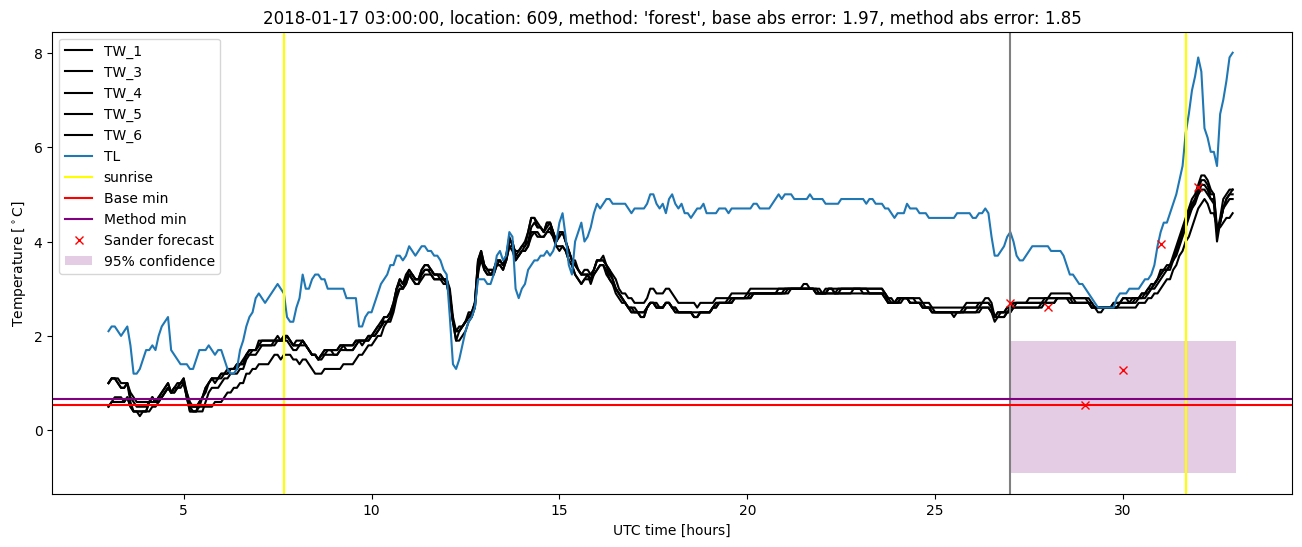
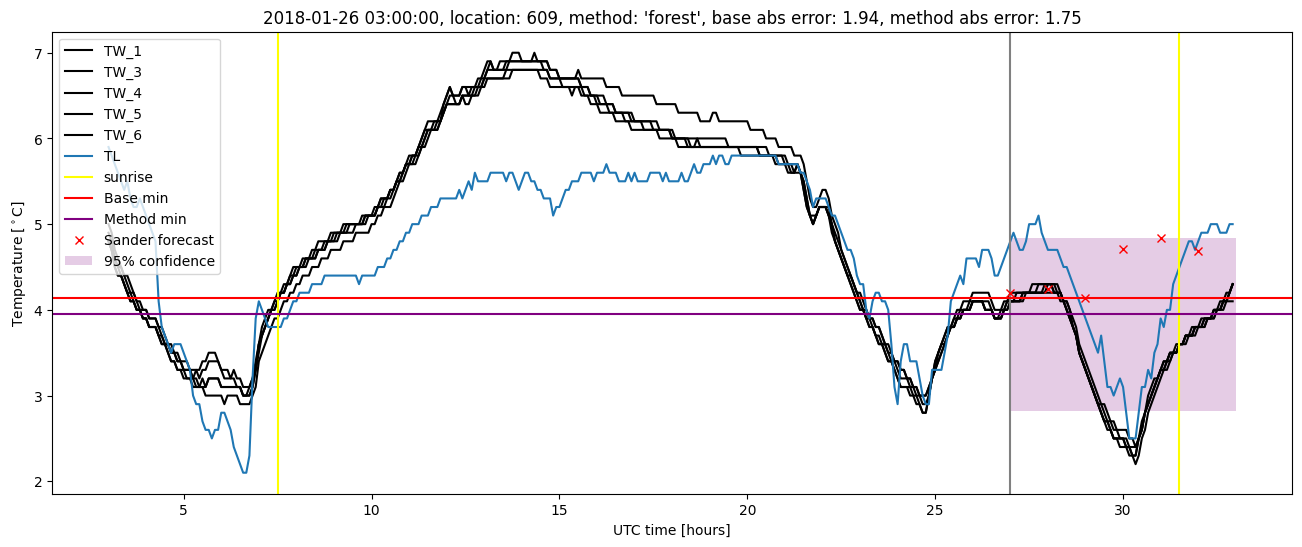
| forest |
winter 2018 |
0.993 |
0.062 |
0.261 |
0.363 |
1.962 |
0.449 |
2.928 |
| baseline |
winter 2019 |
0.993 |
0.250 |
0.303 |
0.391 |
1.996 |
NaN |
NaN |
| forest |
winter 2019 |
1.000 |
0.333 |
0.270 |
0.398 |
1.568 |
0.448 |
4.150 |
| baseline |
all |
0.988 |
0.060 |
0.362 |
0.431 |
2.859 |
NaN |
NaN |
| forest |
all |
0.993 |
0.080 |
0.278 |
0.389 |
2.031 |
0.450 |
3.309 |
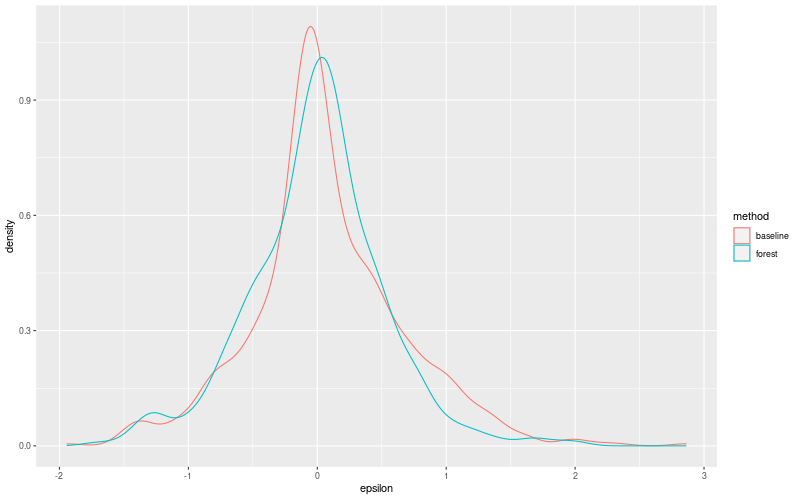
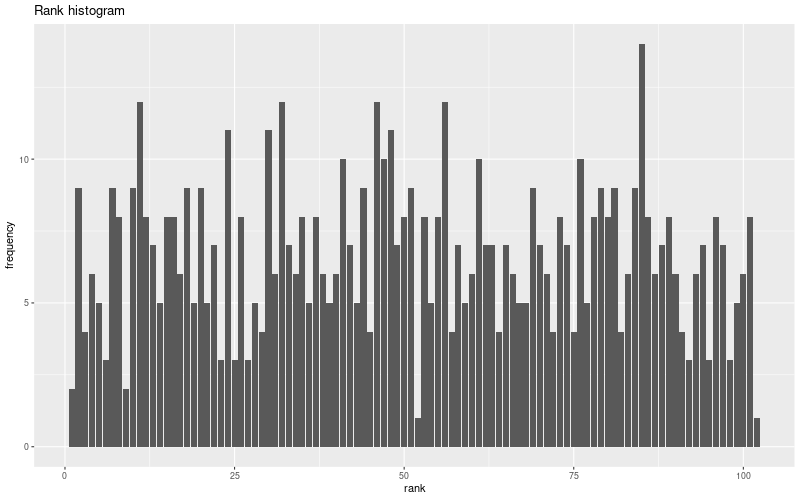
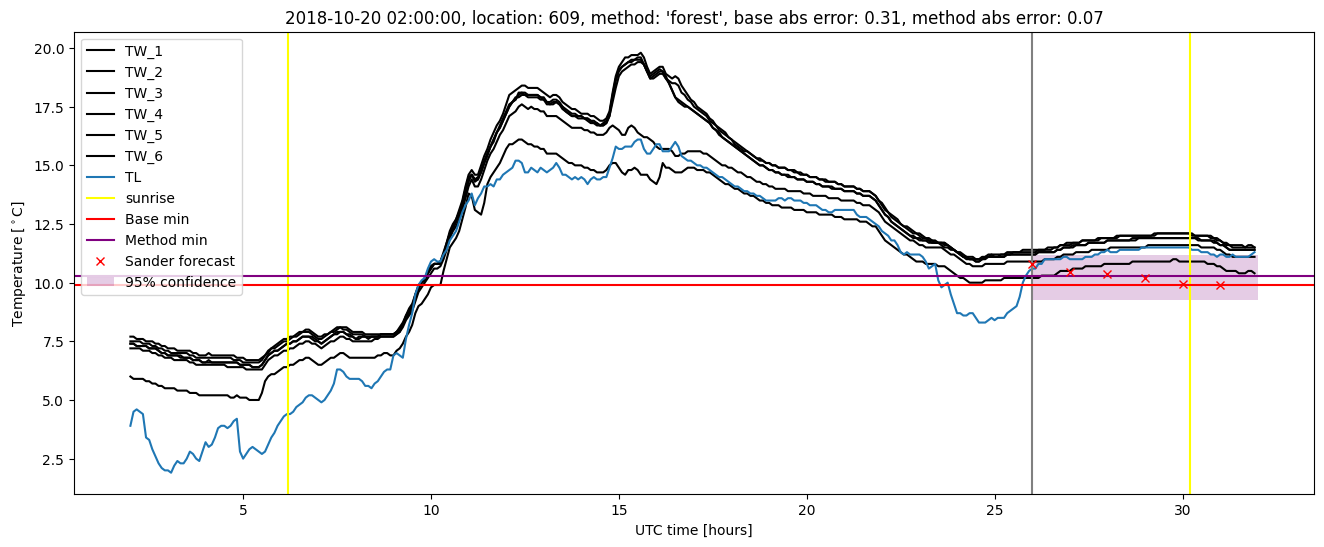
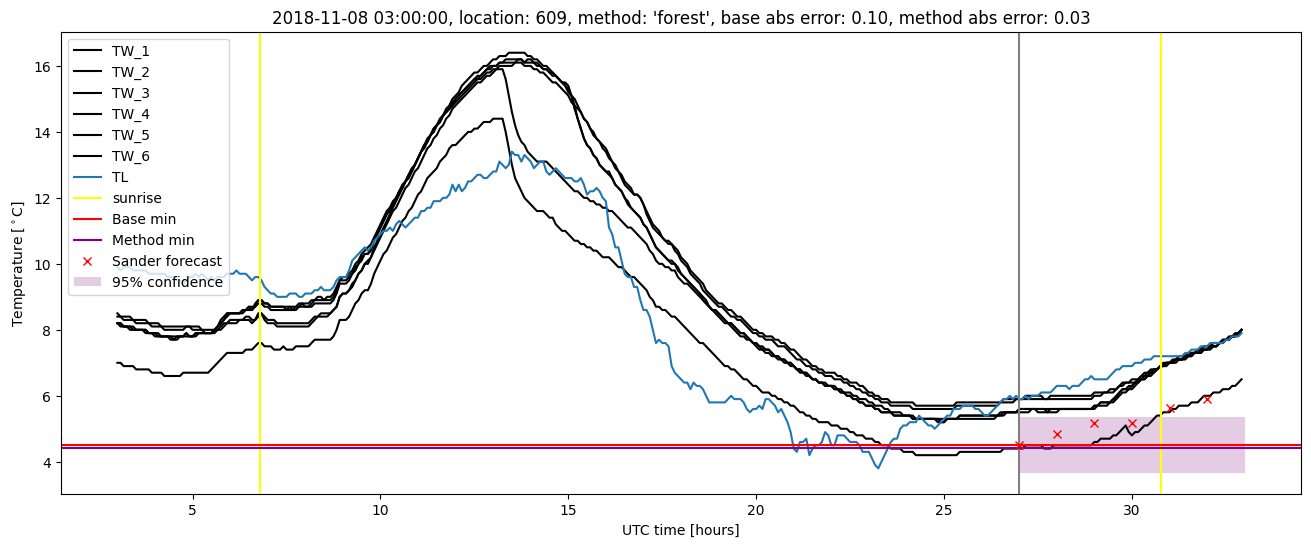
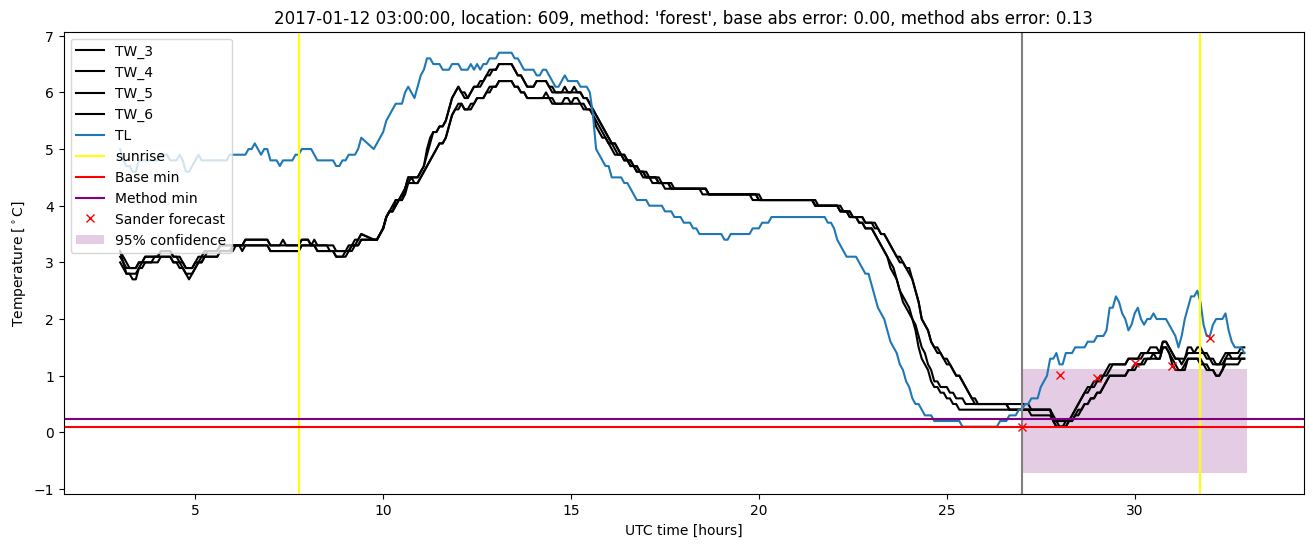
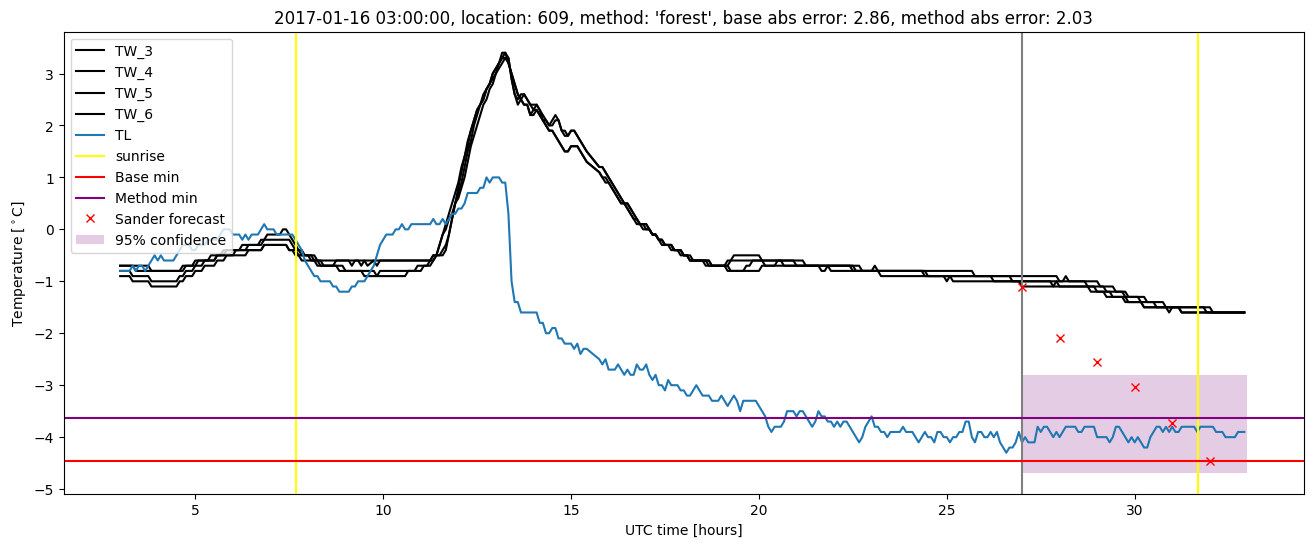
Random forest plots
Extended logistic regression results
| names |
period |
power |
significance |
meanSquareError |
absError |
maxError |
CRPS |
IGN |
| baseline |
winter 2016 |
0.989 |
0.000e+00 |
0.347 |
0.453 |
1.632 |
NaN |
NaN |
| elr |
winter 2016 |
0.989 |
0.000e+00 |
0.279 |
0.430 |
1.408 |
0.500 |
3.297 |
| baseline |
winter 2017 |
0.975 |
0.062 |
0.468 |
0.486 |
2.859 |
NaN |
NaN |
| elr |
winter 2017 |
0.983 |
0.094 |
0.374 |
0.442 |
2.450 |
0.490 |
3.703 |
| baseline |
winter 2018 |
0.993 |
0.031 |
0.339 |
0.396 |
2.325 |
NaN |
NaN |
| elr |
winter 2018 |
0.980 |
0.031 |
0.288 |
0.392 |
2.122 |
0.509 |
3.635 |
| baseline |
winter 2019 |
0.993 |
0.250 |
0.303 |
0.391 |
1.996 |
NaN |
NaN |
| elr |
winter 2019 |
1.000 |
0.250 |
0.312 |
0.449 |
1.533 |
0.509 |
3.698 |
| baseline |
all |
0.988 |
0.060 |
0.362 |
0.431 |
2.859 |
NaN |
NaN |
| elr |
all |
0.988 |
0.070 |
0.309 |
0.427 |
2.450 |
0.502 |
3.564 |
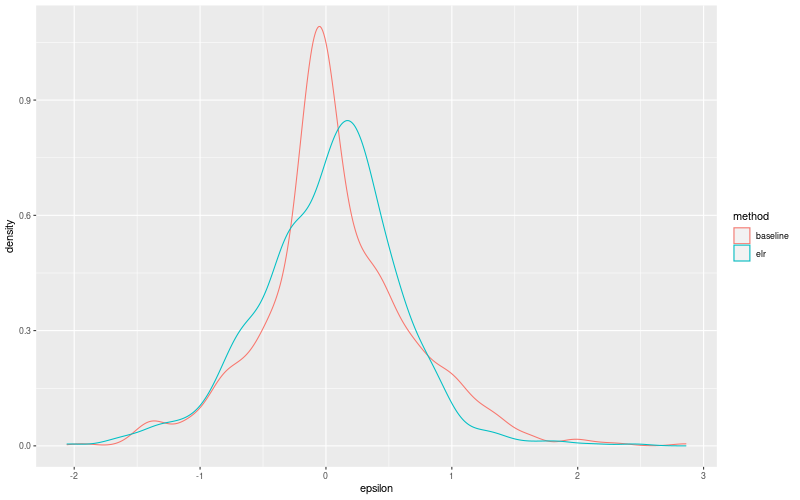
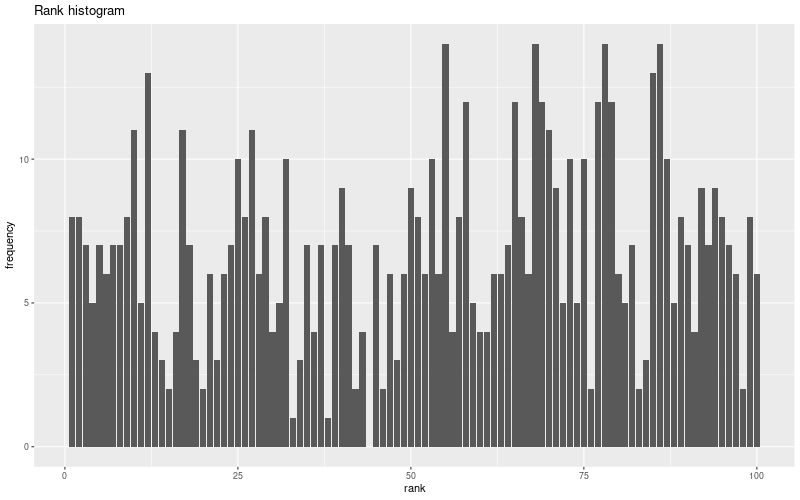
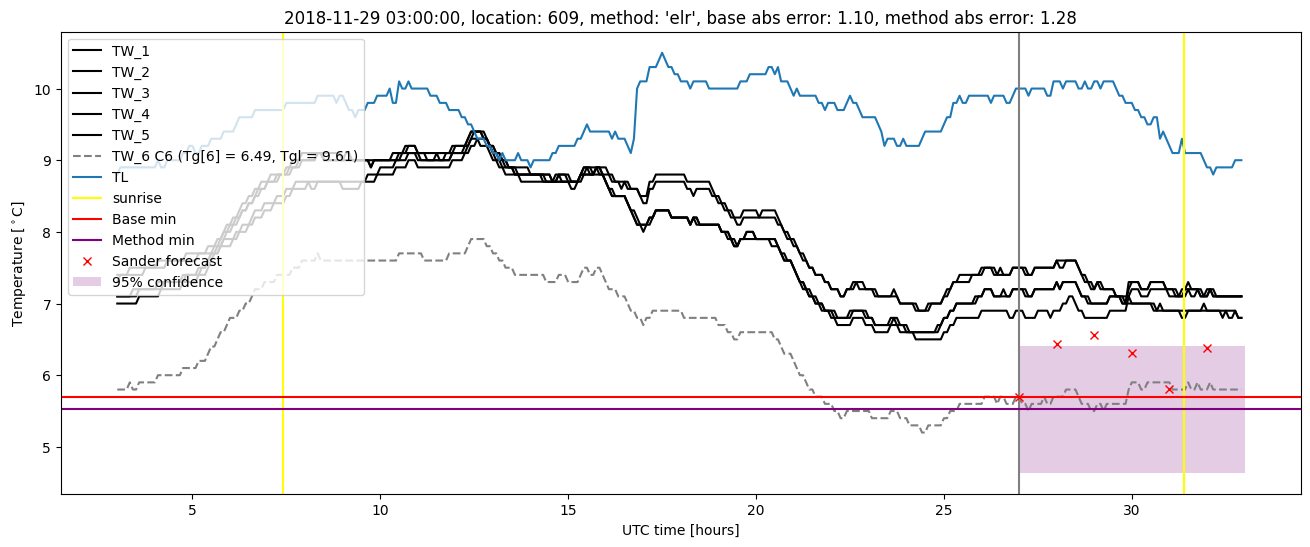
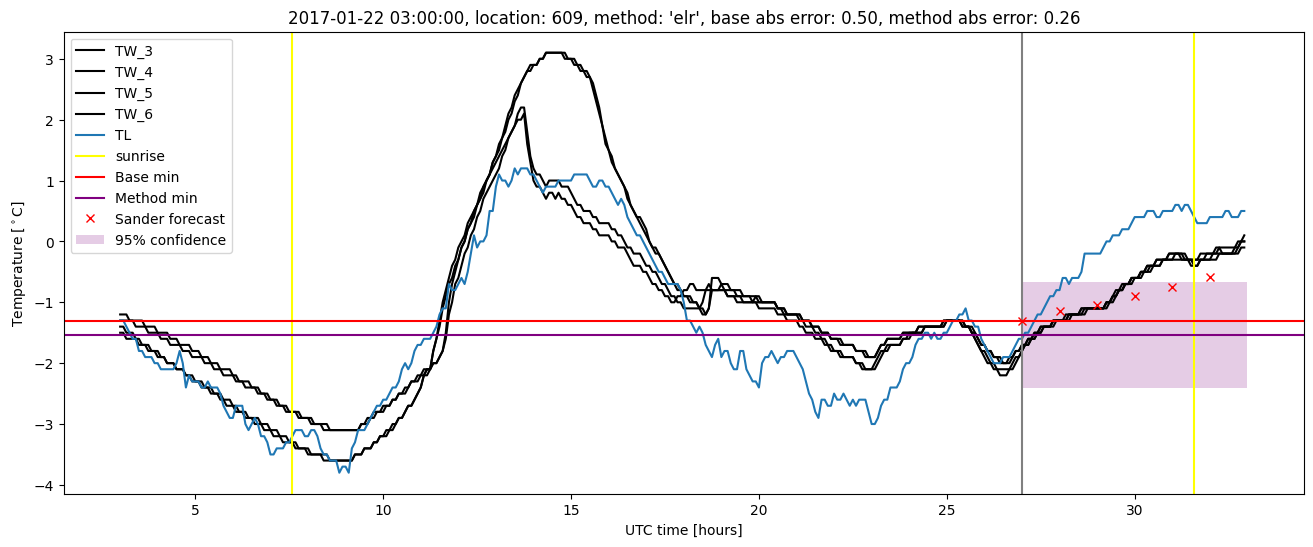
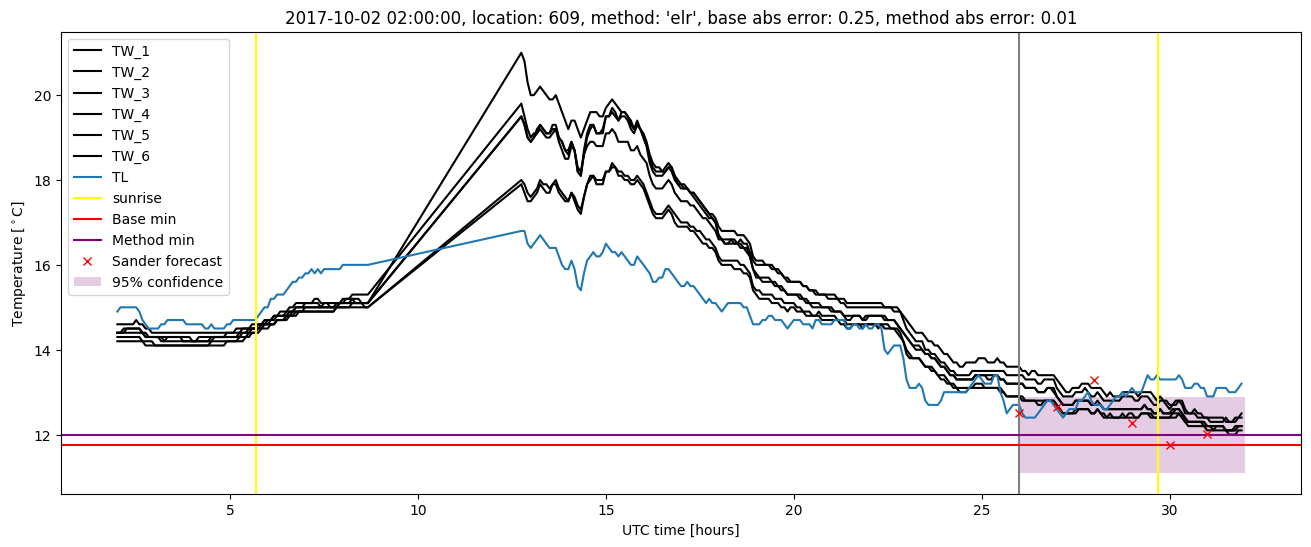
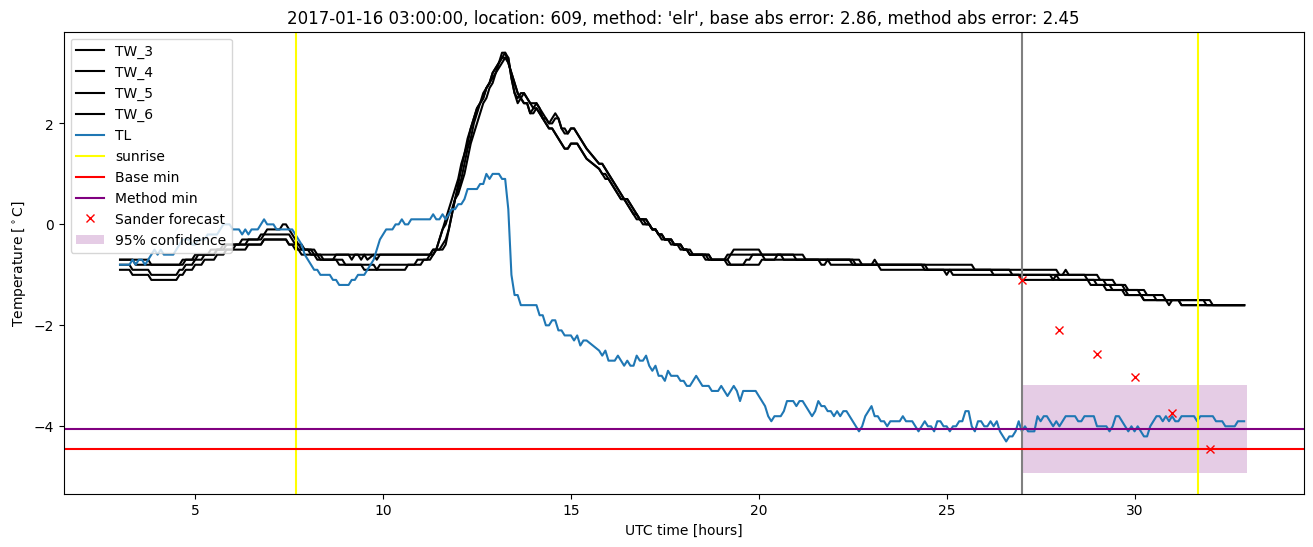
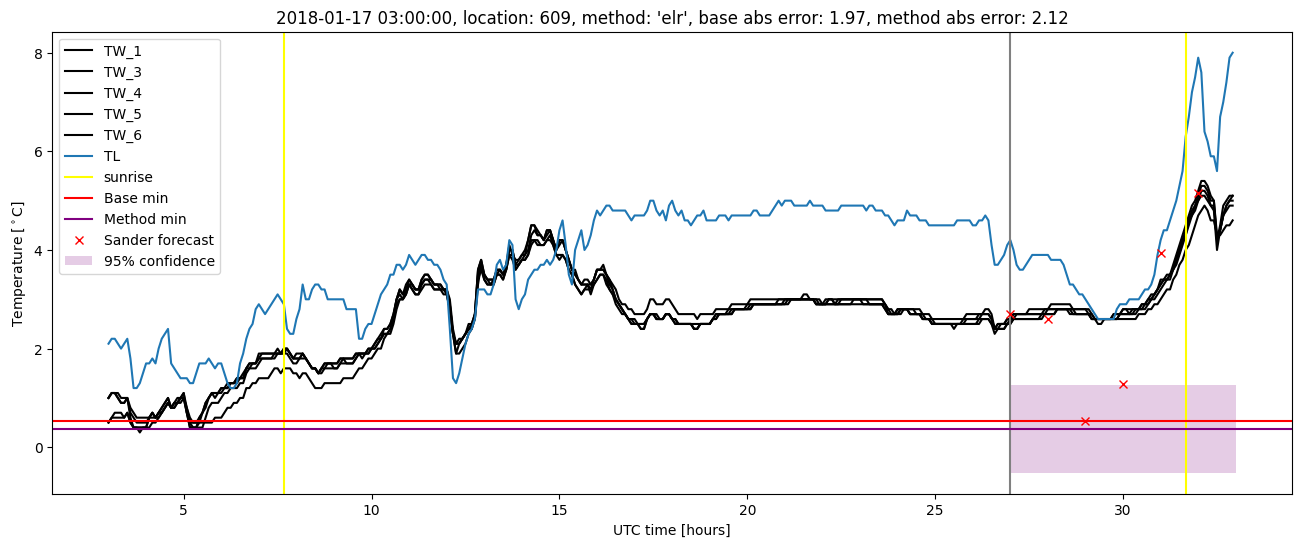
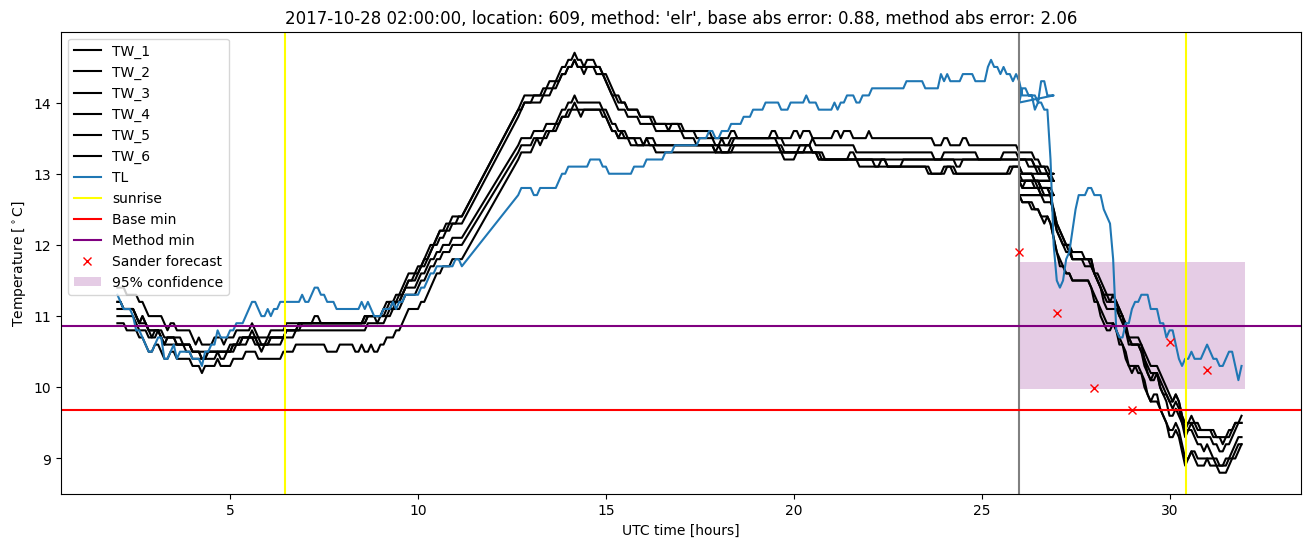
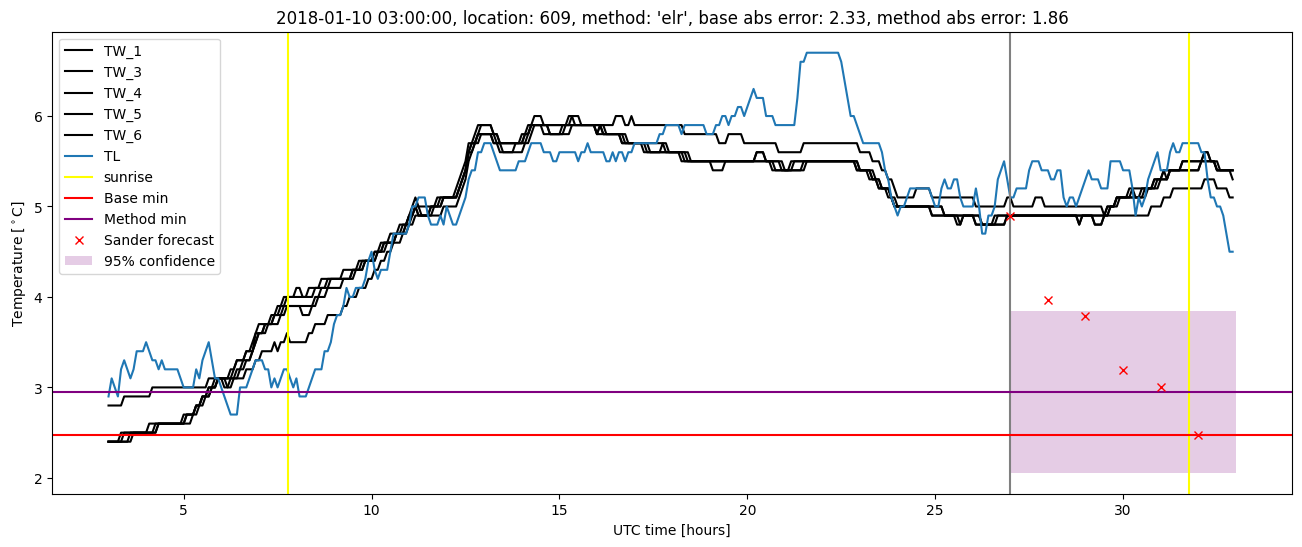
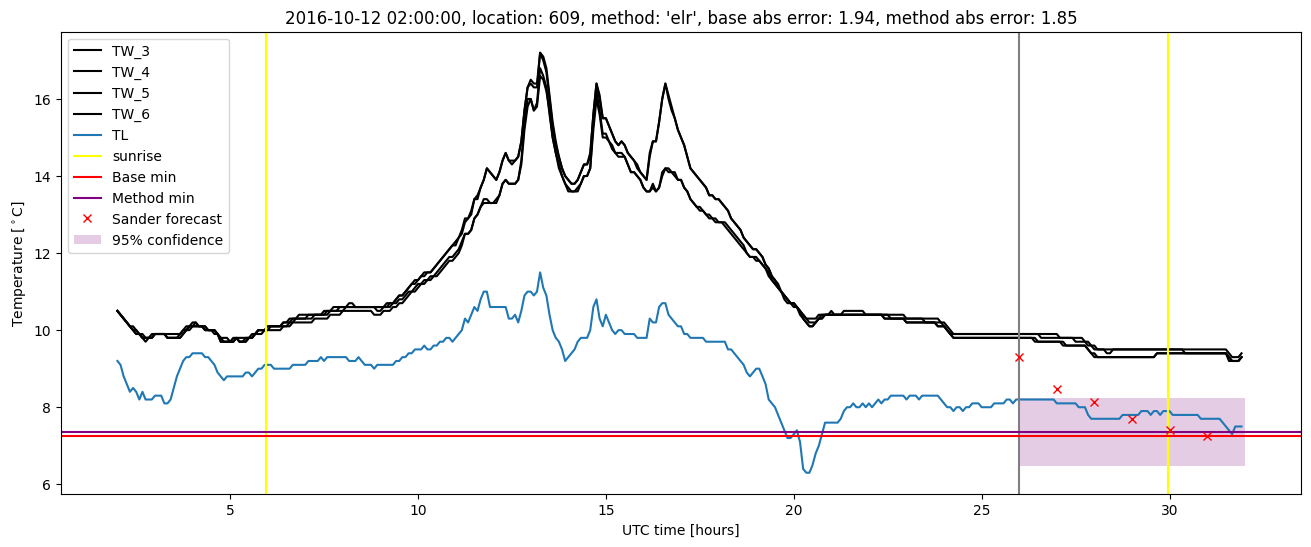
Extended logistic regression plots