GMS location: 608
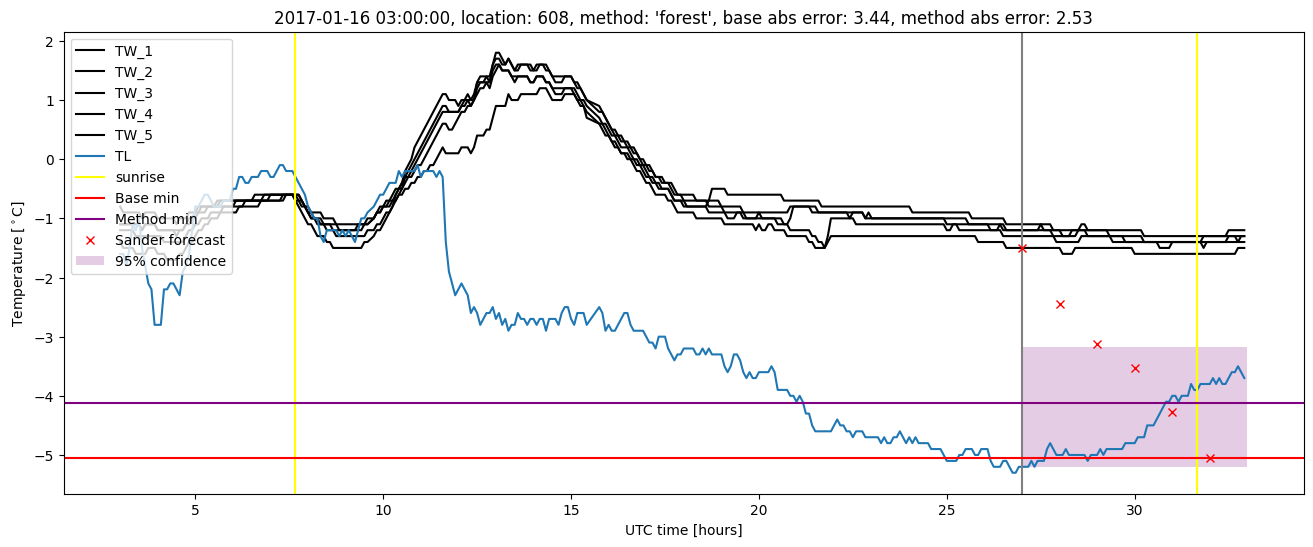
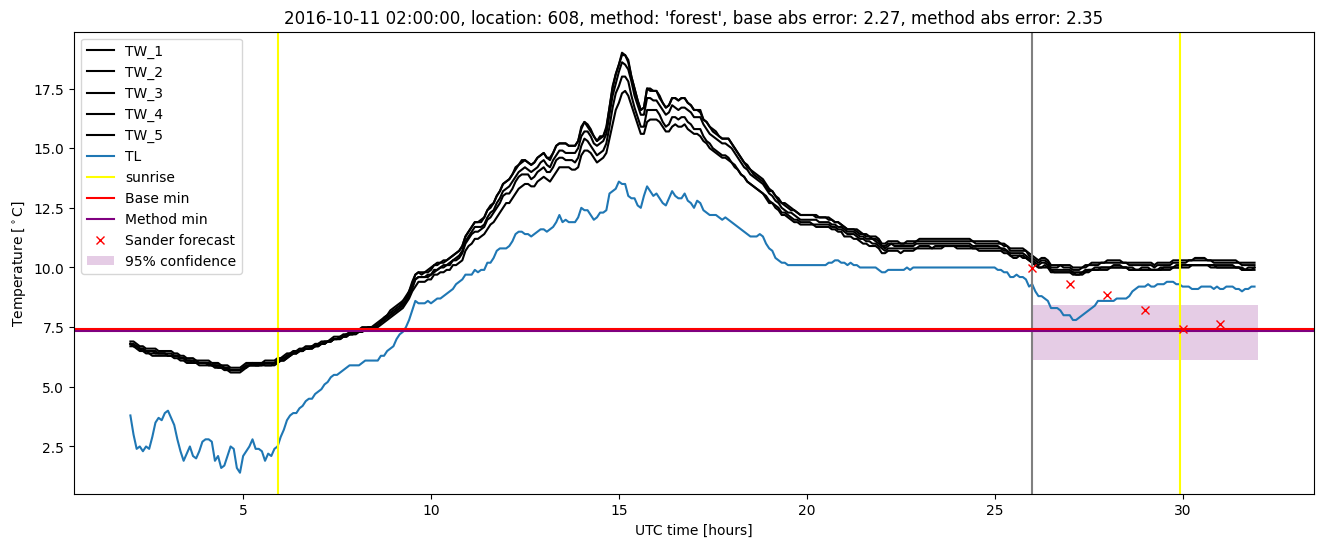
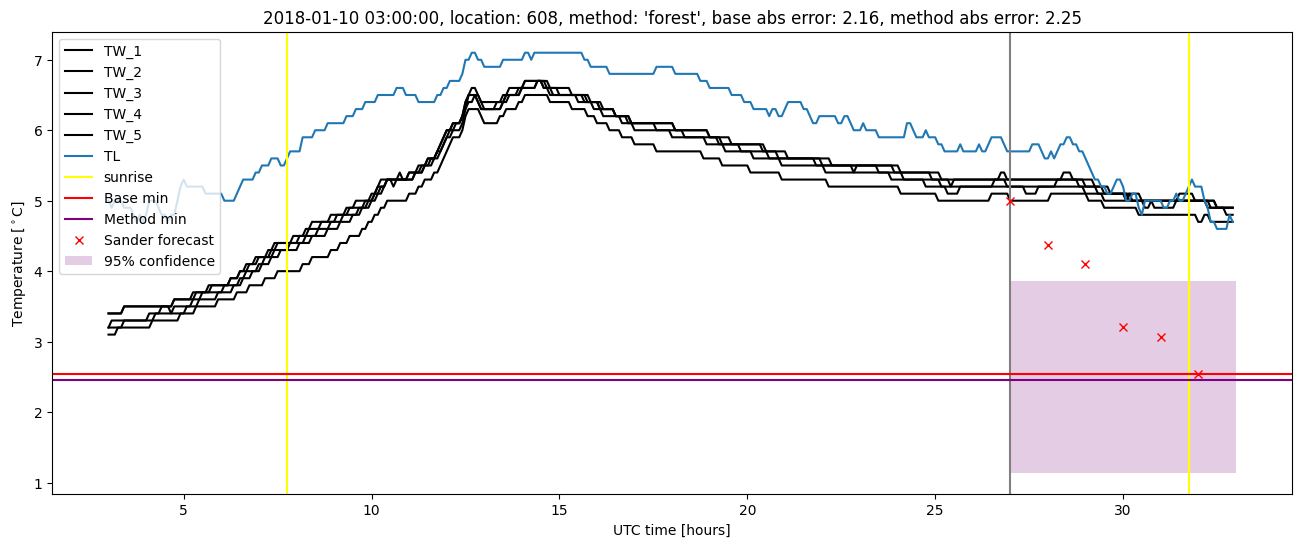
Random forest results
| names |
period |
power |
significance |
meanSquareError |
absError |
maxError |
CRPS |
IGN |
| baseline |
winter 2016 |
0.994 |
0.069 |
0.391 |
0.439 |
2.301 |
NaN |
NaN |
| forest |
winter 2016 |
0.983 |
0.035 |
0.305 |
0.400 |
2.149 |
0.552 |
2.907 |
| baseline |
winter 2017 |
0.973 |
0.095 |
0.578 |
0.541 |
3.444 |
NaN |
NaN |
| forest |
winter 2017 |
0.973 |
0.095 |
0.444 |
0.464 |
2.526 |
0.535 |
3.219 |
| baseline |
winter 2018 |
0.986 |
0.000e+00 |
0.491 |
0.491 |
2.909 |
NaN |
NaN |
| forest |
winter 2018 |
0.986 |
0.000e+00 |
0.402 |
0.455 |
2.758 |
0.561 |
3.035 |
| baseline |
winter 2019 |
0.986 |
0.083 |
0.263 |
0.368 |
1.863 |
NaN |
NaN |
| forest |
winter 2019 |
0.993 |
0.083 |
0.183 |
0.328 |
1.282 |
0.561 |
2.663 |
| baseline |
all |
0.986 |
0.060 |
0.429 |
0.459 |
3.444 |
NaN |
NaN |
| forest |
all |
0.984 |
0.051 |
0.334 |
0.412 |
2.758 |
0.553 |
2.954 |
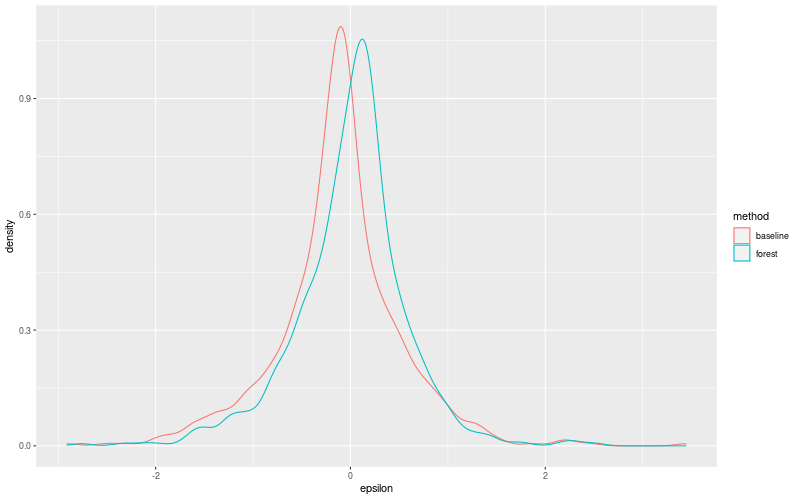
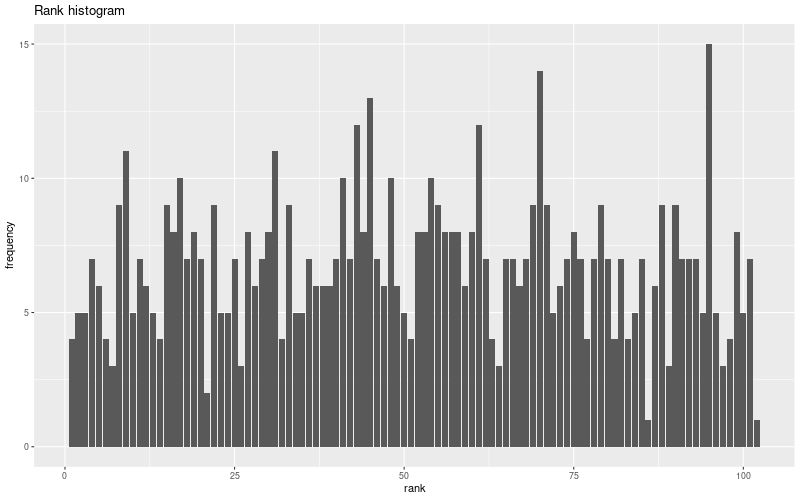
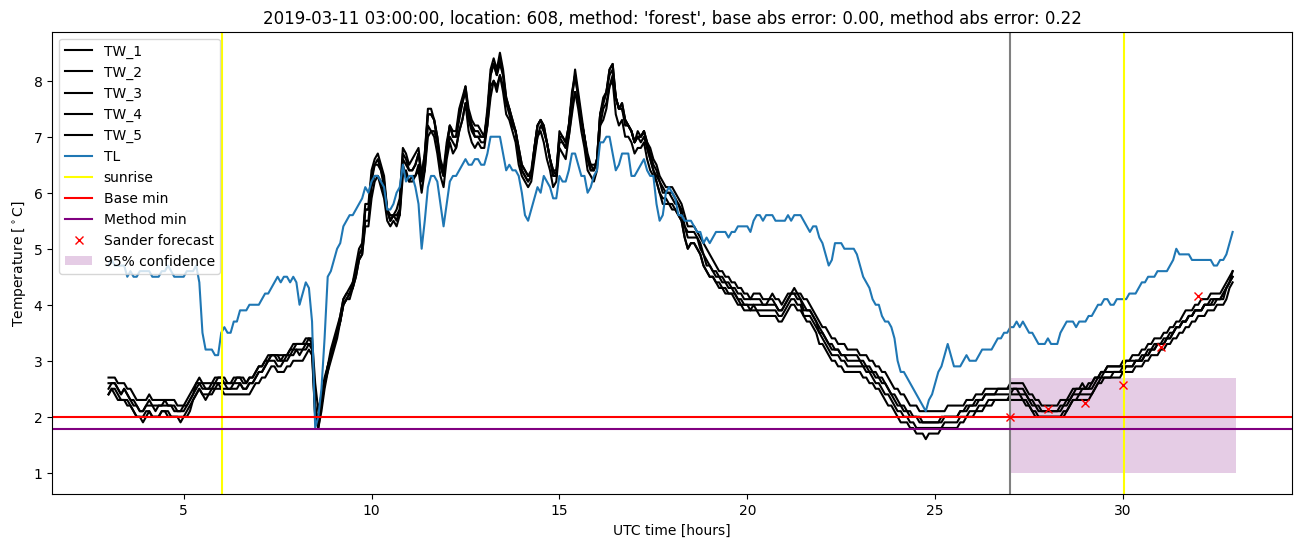
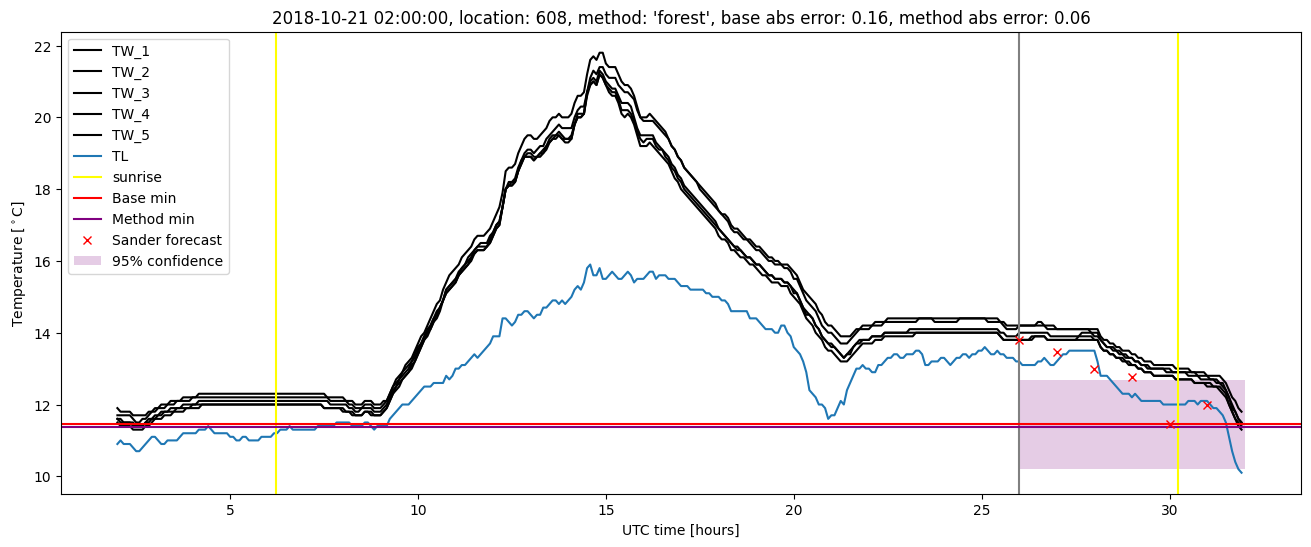
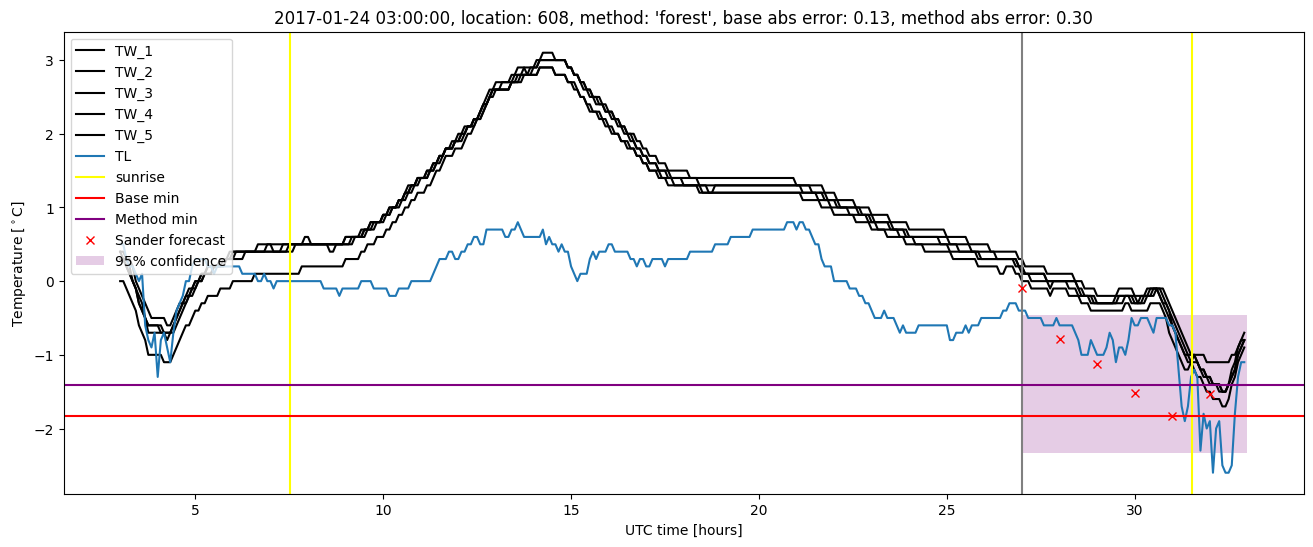
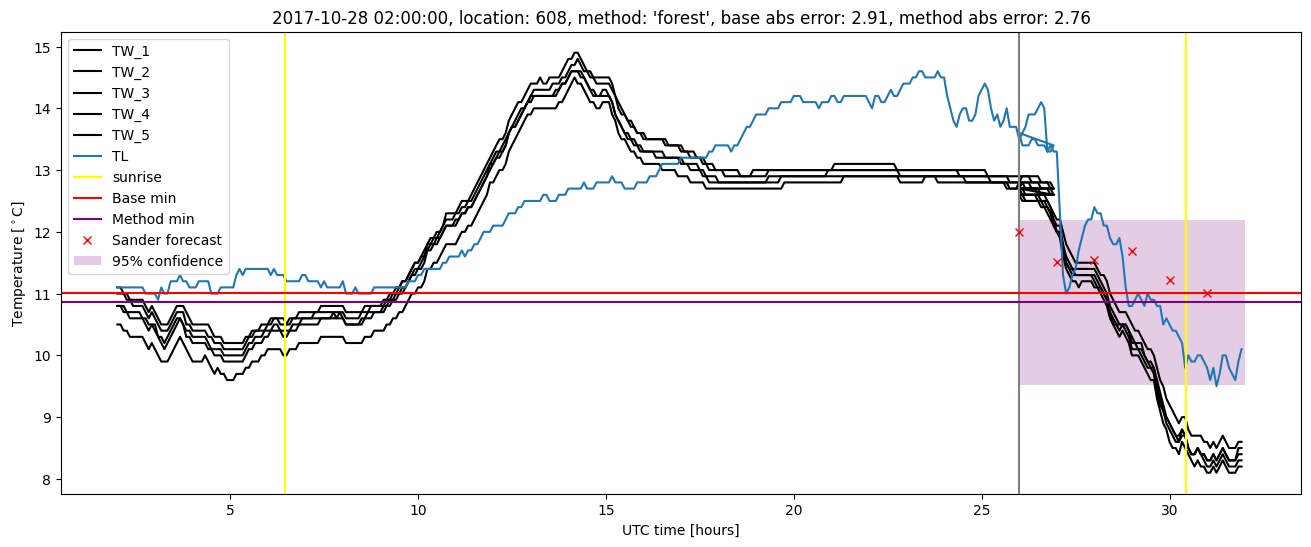
Random forest plots

Extended logistic regression results
| names |
period |
power |
significance |
meanSquareError |
absError |
maxError |
CRPS |
IGN |
| baseline |
winter 2016 |
0.994 |
0.069 |
0.391 |
0.439 |
2.301 |
NaN |
NaN |
| elr |
winter 2016 |
0.977 |
0.035 |
0.338 |
0.456 |
1.946 |
0.651 |
4.345 |
| baseline |
winter 2017 |
0.973 |
0.095 |
0.578 |
0.541 |
3.444 |
NaN |
NaN |
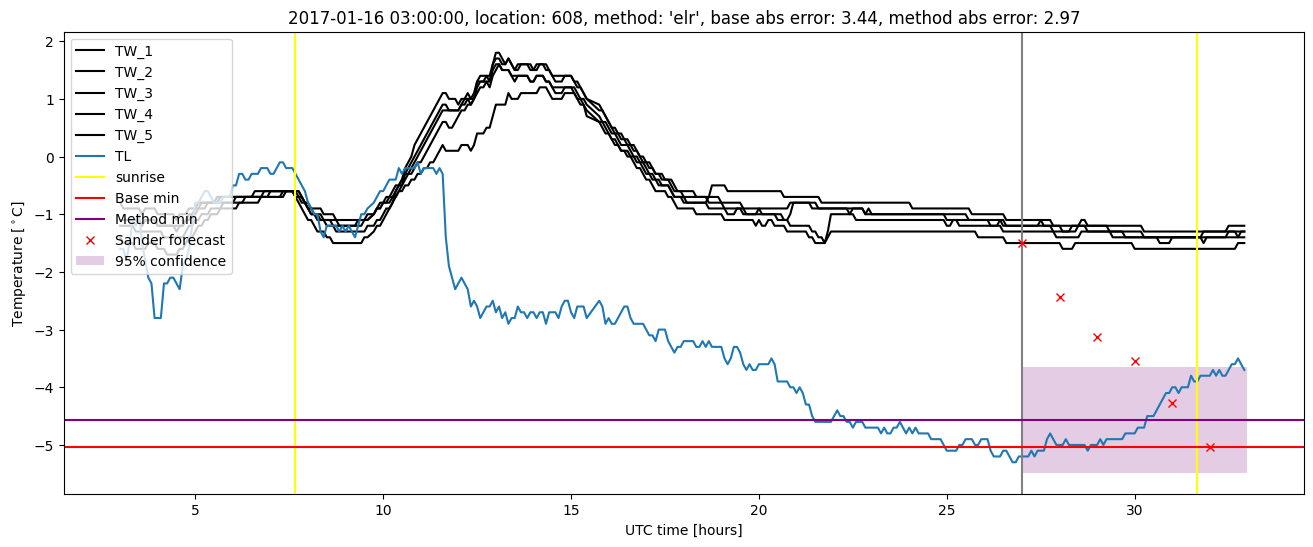
| elr |
winter 2017 |
0.973 |
0.095 |
0.479 |
0.502 |
2.966 |
0.596 |
4.361 |
| baseline |
winter 2018 |
0.986 |
0.000e+00 |
0.491 |
0.491 |
2.909 |
NaN |
NaN |
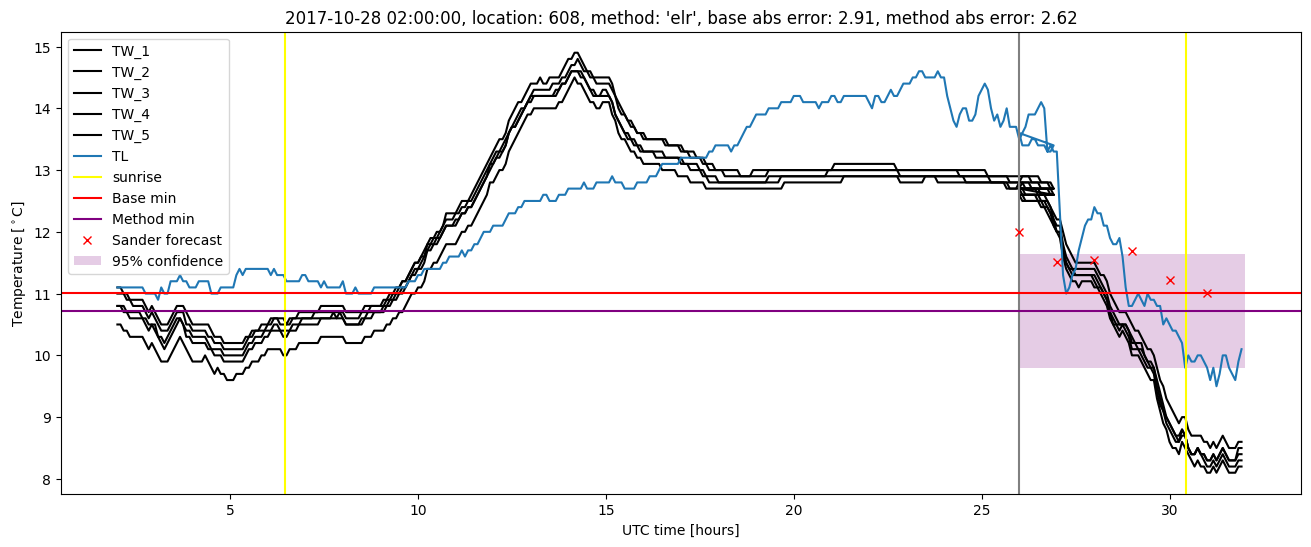
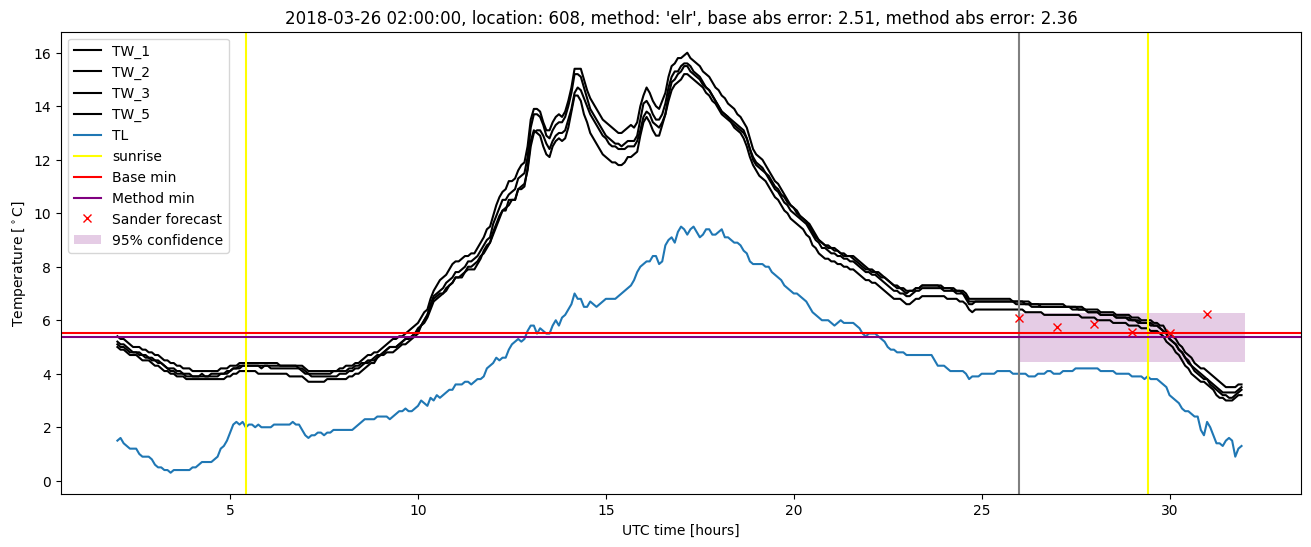
| elr |
winter 2018 |
0.979 |
0.000e+00 |
0.414 |
0.482 |
2.622 |
0.652 |
4.993 |
| baseline |
winter 2019 |
0.986 |
0.083 |
0.263 |
0.368 |
1.863 |
NaN |
NaN |
| elr |
winter 2019 |
0.986 |
0.083 |
0.250 |
0.404 |
1.373 |
0.594 |
3.140 |
| baseline |
all |
0.986 |
0.060 |
0.429 |
0.459 |
3.444 |
NaN |
NaN |
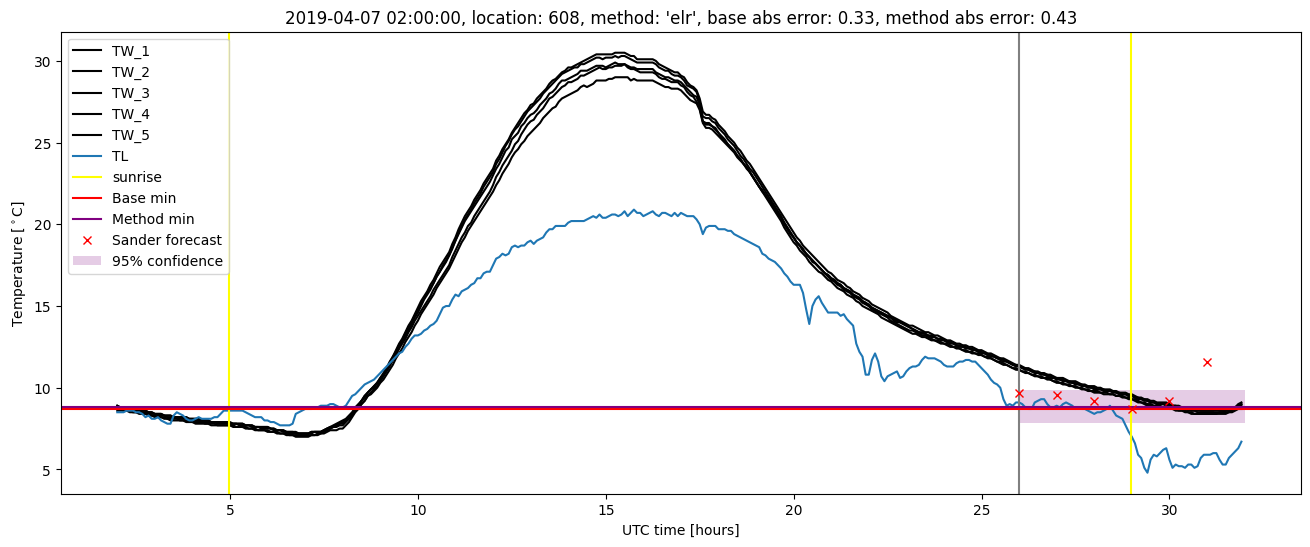
| elr |
all |
0.979 |
0.051 |
0.369 |
0.461 |
2.966 |
0.626 |
4.244 |
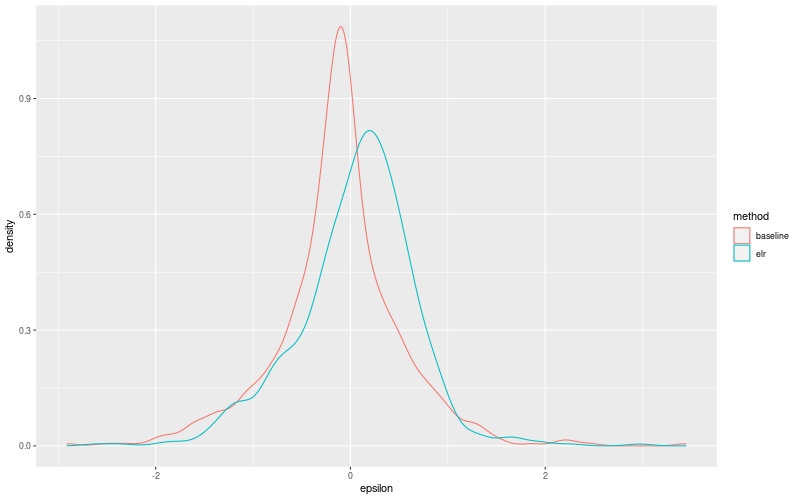
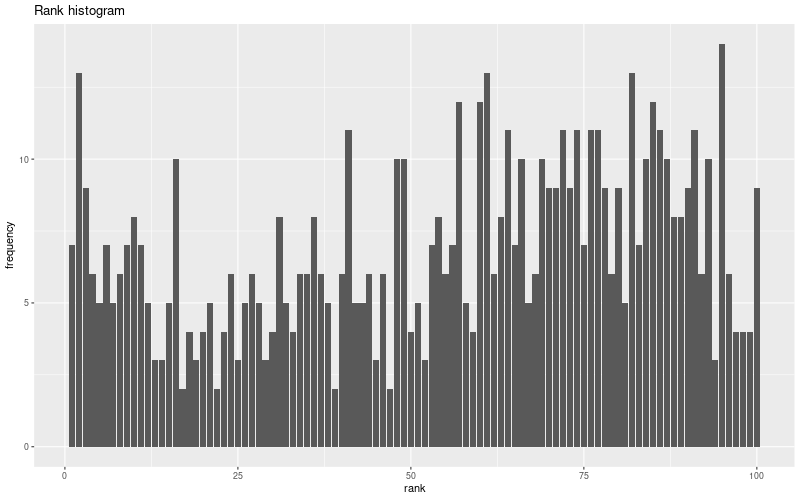
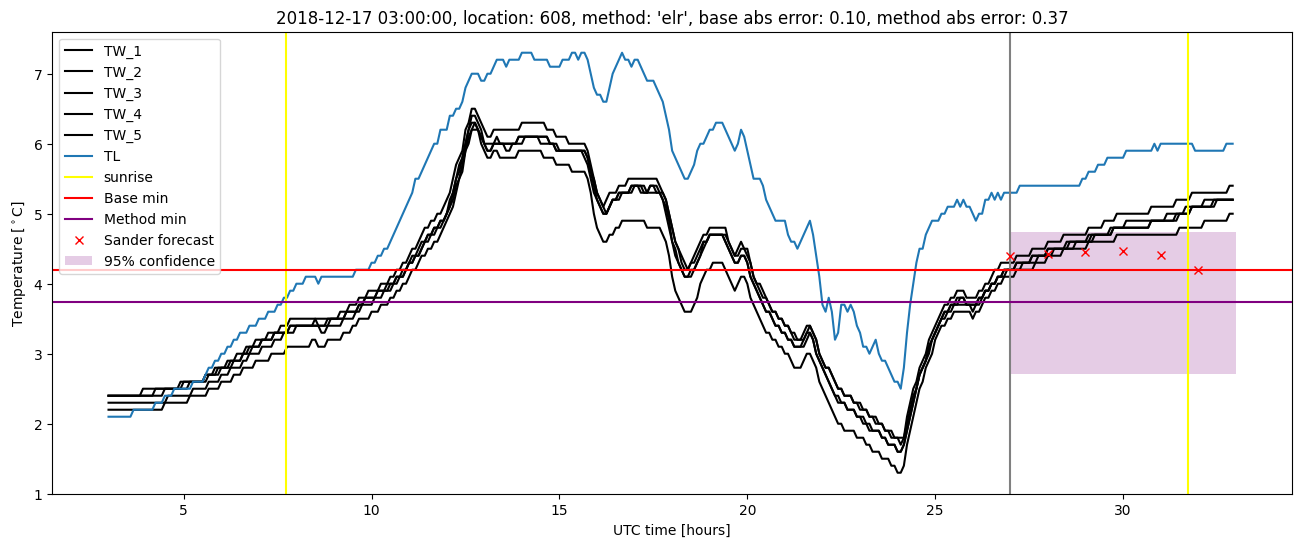
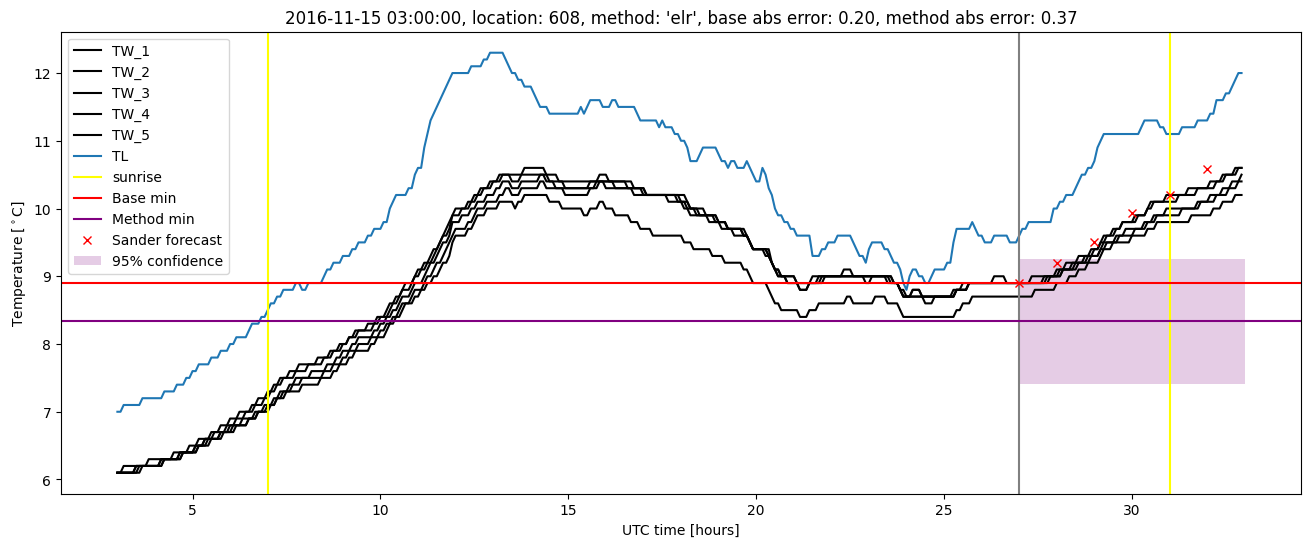
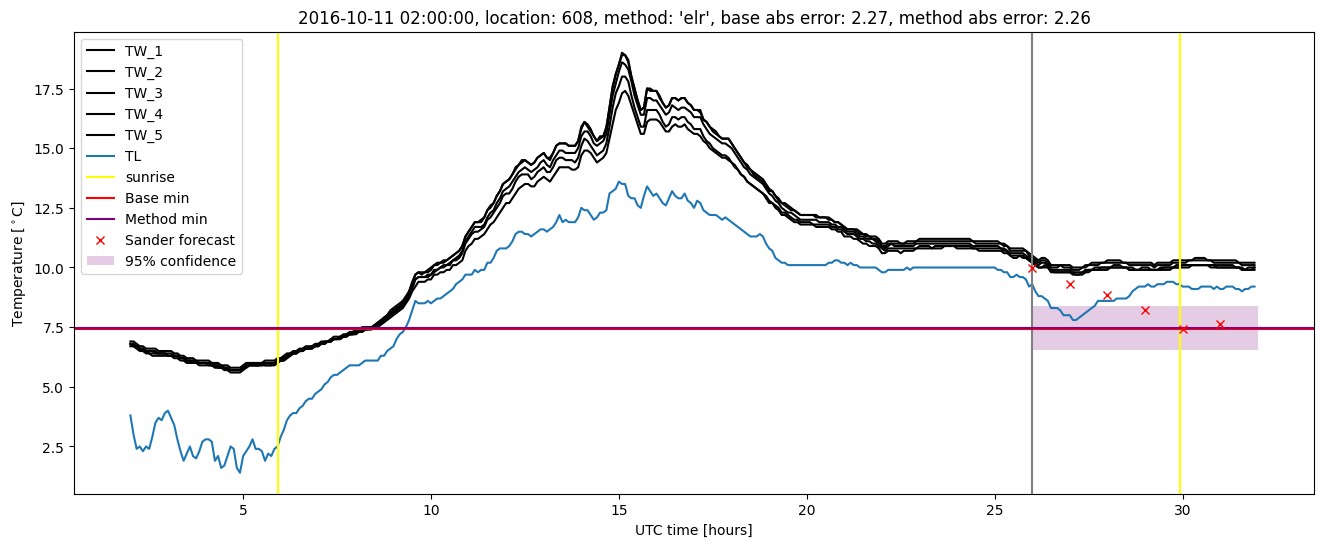
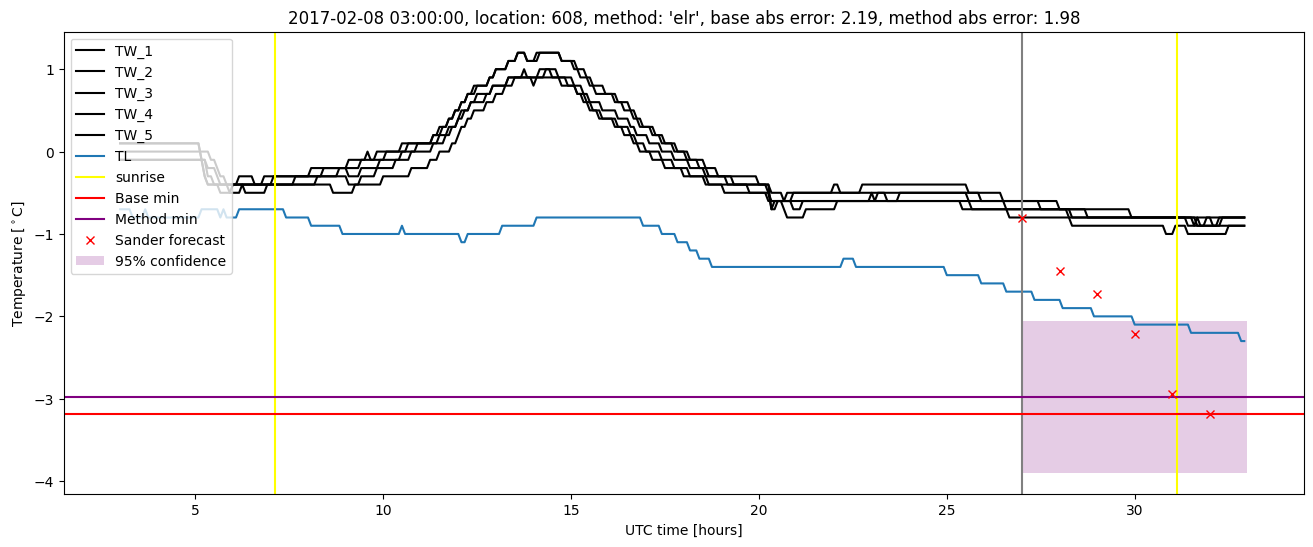
Extended logistic regression plots