GMS location: 607
Random forest results
| names |
period |
power |
significance |
meanSquareError |
absError |
maxError |
CRPS |
IGN |
| baseline |
winter 2016 |
0.994 |
0.065 |
0.376 |
0.450 |
2.996 |
NaN |
NaN |
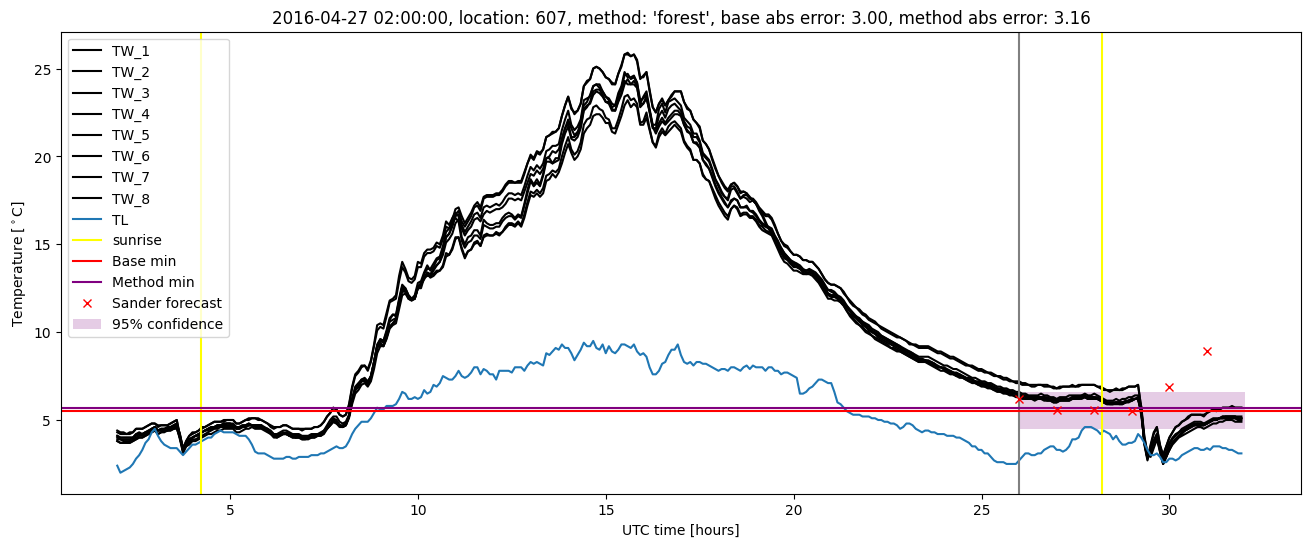
| forest |
winter 2016 |
0.994 |
0.097 |
0.320 |
0.404 |
3.163 |
0.482 |
3.180 |
| baseline |
winter 2017 |
0.967 |
0.070 |
0.501 |
0.503 |
3.110 |
NaN |
NaN |
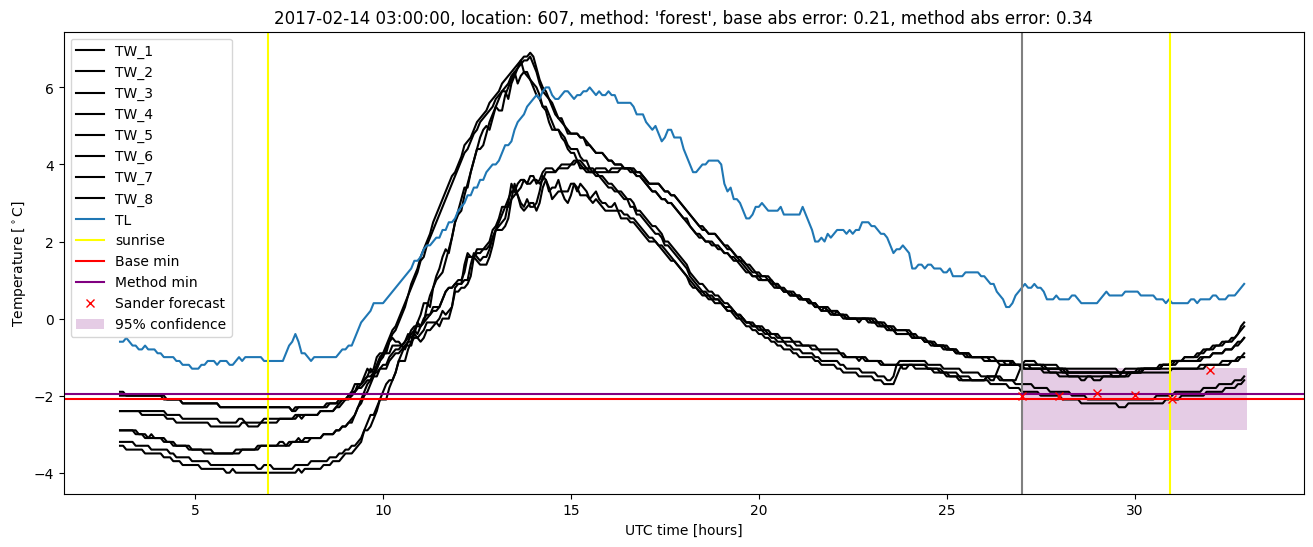
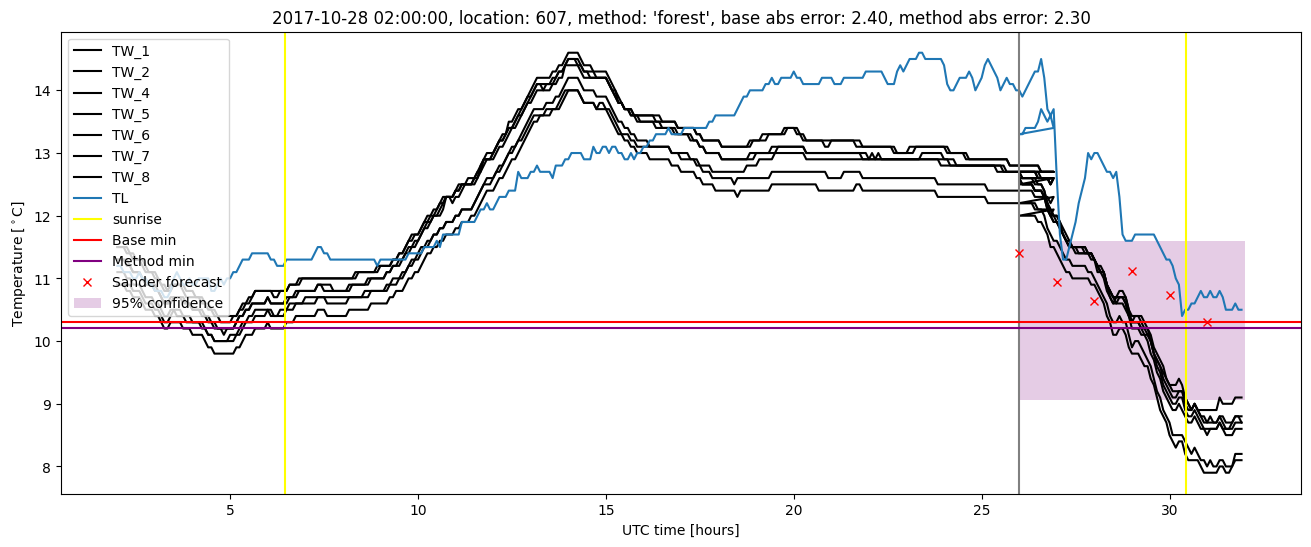
| forest |
winter 2017 |
0.967 |
0.046 |
0.377 |
0.444 |
2.180 |
0.481 |
3.780 |
| baseline |
winter 2018 |
0.971 |
0.075 |
0.403 |
0.454 |
2.872 |
NaN |
NaN |
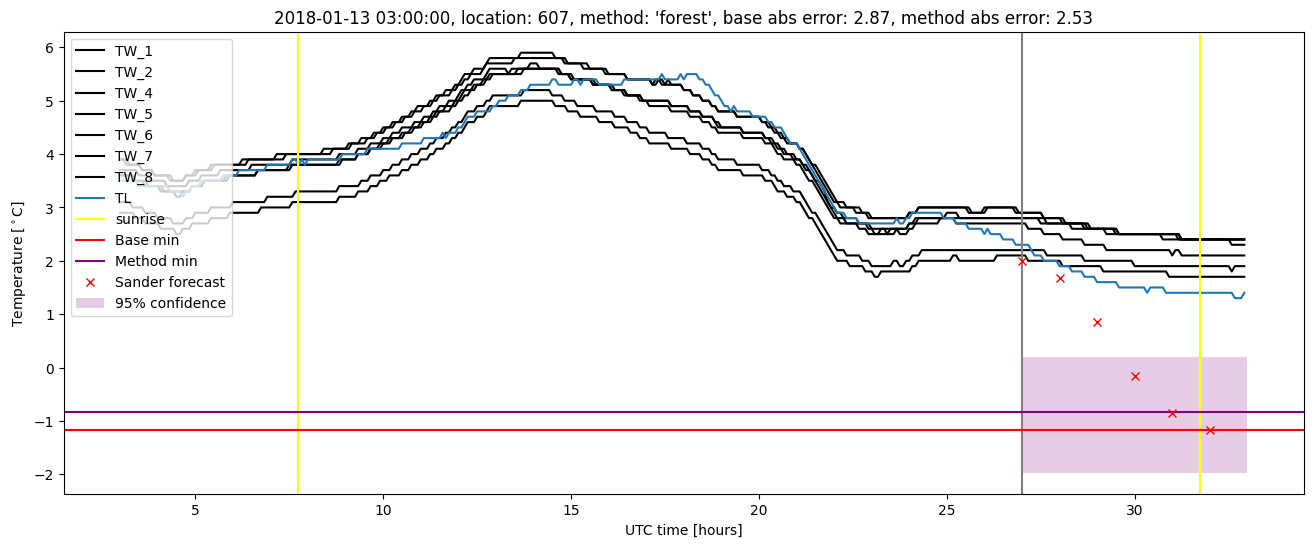
| forest |
winter 2018 |
0.964 |
0.050 |
0.386 |
0.449 |
2.525 |
0.500 |
2.969 |
| baseline |
winter 2019 |
0.992 |
0.000e+00 |
0.309 |
0.411 |
1.910 |
NaN |
NaN |
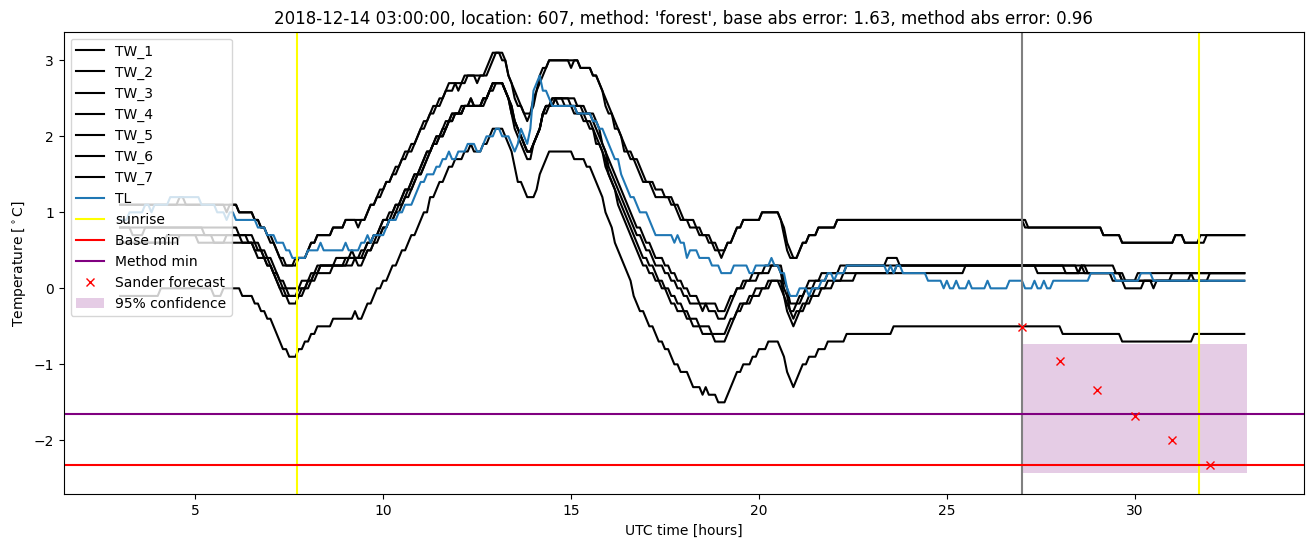
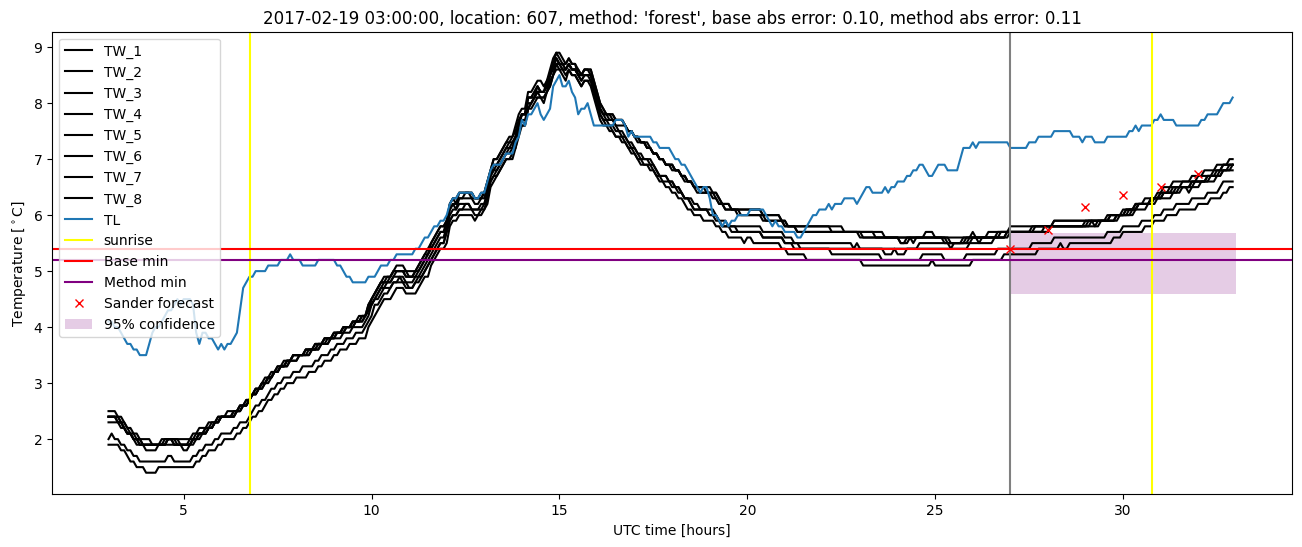
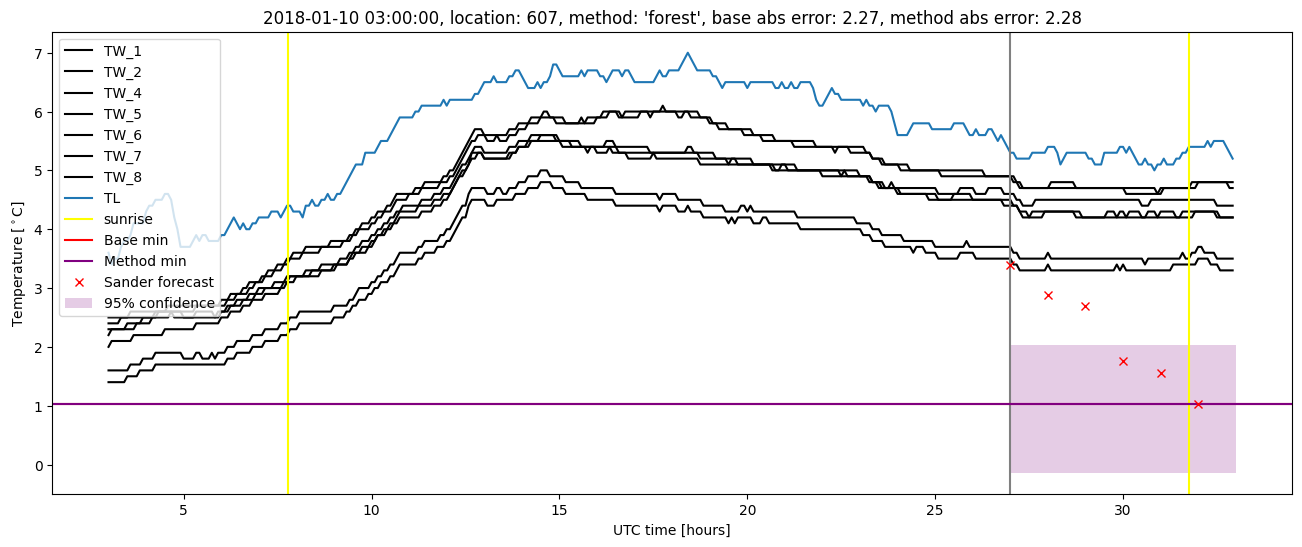
| forest |
winter 2019 |
1.000 |
0.000e+00 |
0.222 |
0.362 |
1.343 |
0.503 |
2.574 |
| baseline |
all |
0.983 |
0.061 |
0.395 |
0.454 |
3.110 |
NaN |
NaN |
| forest |
all |
0.983 |
0.054 |
0.329 |
0.415 |
3.163 |
0.491 |
3.117 |
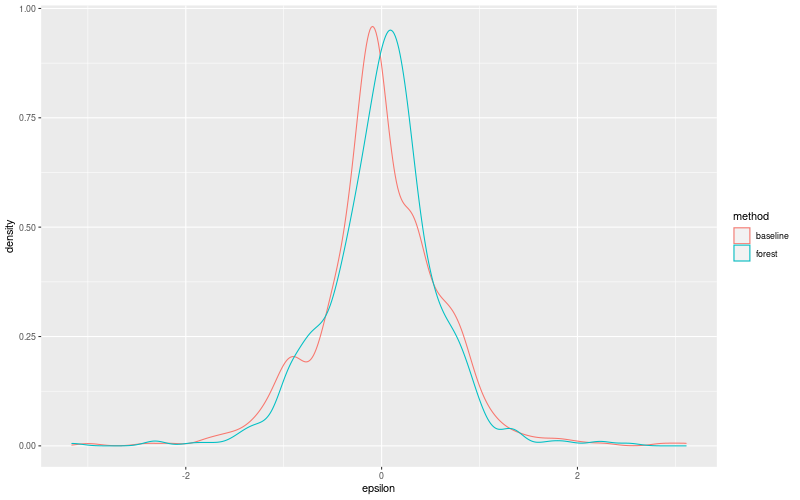
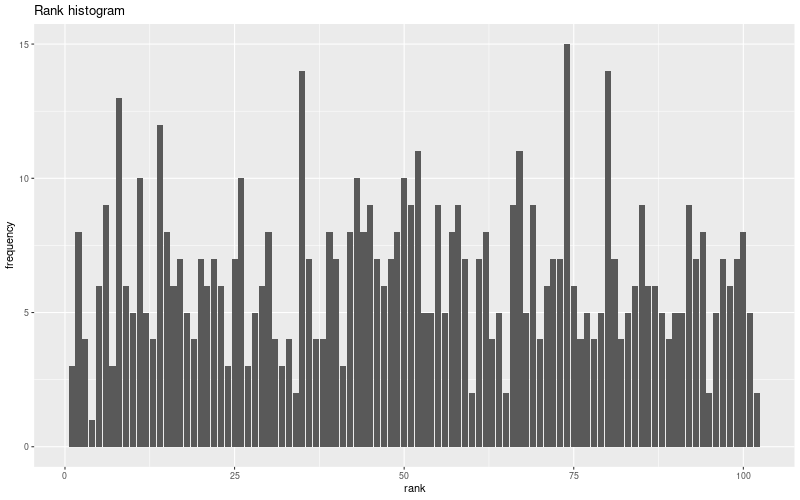
Random forest plots

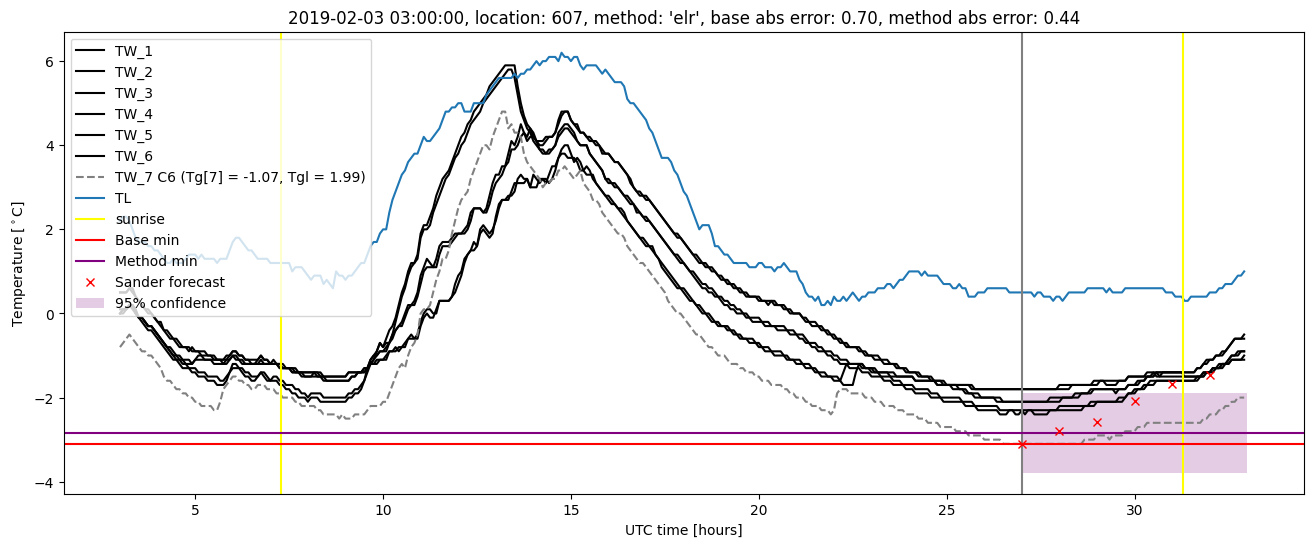
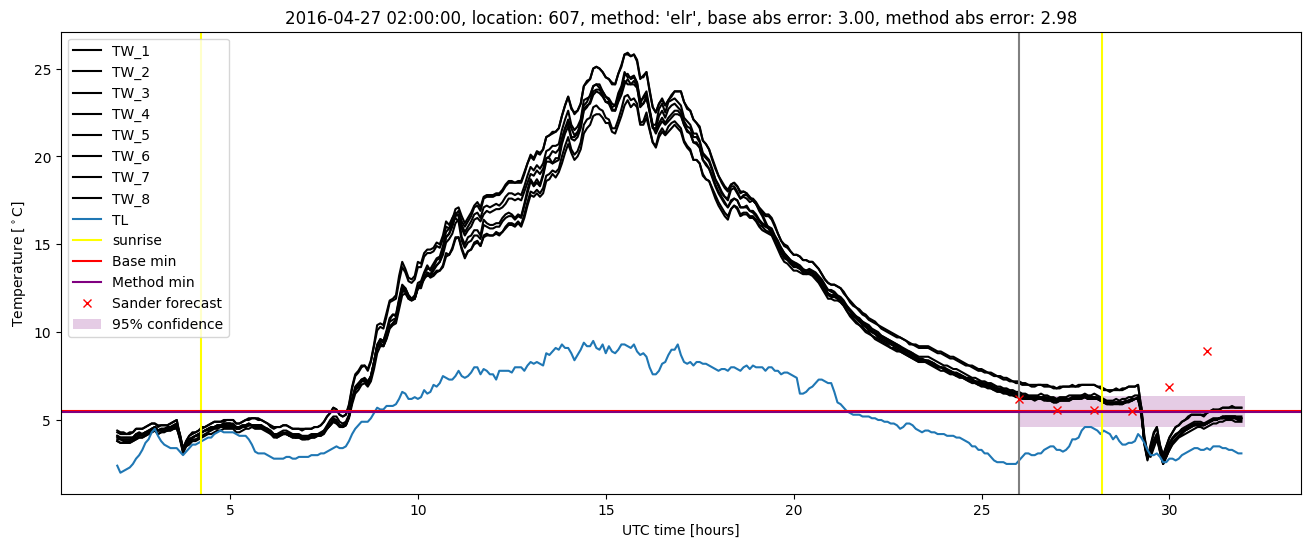
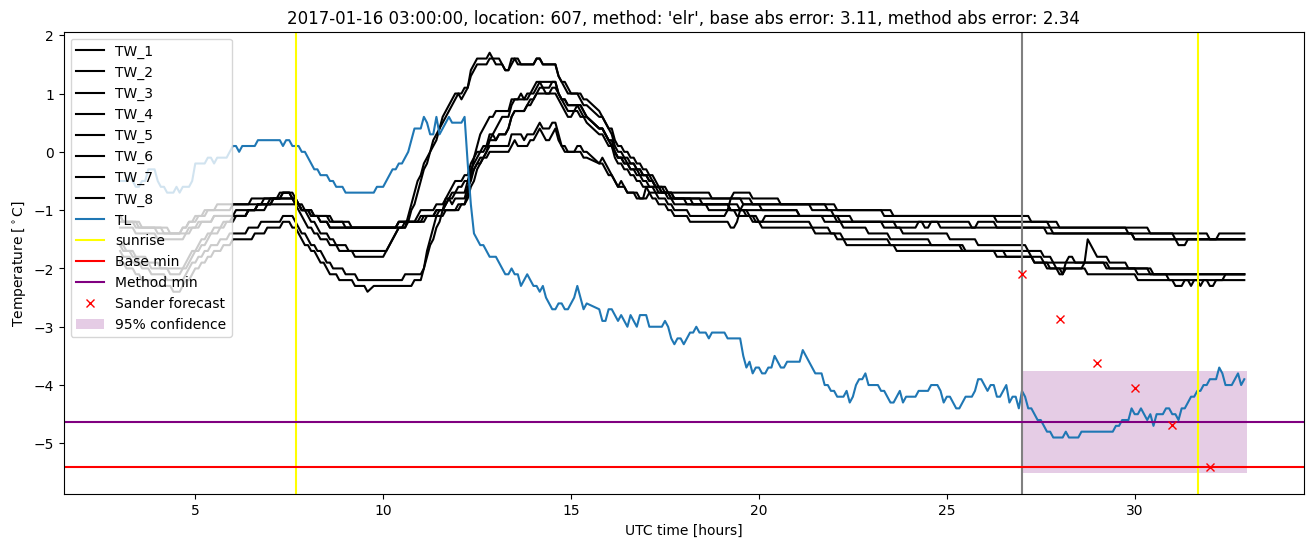
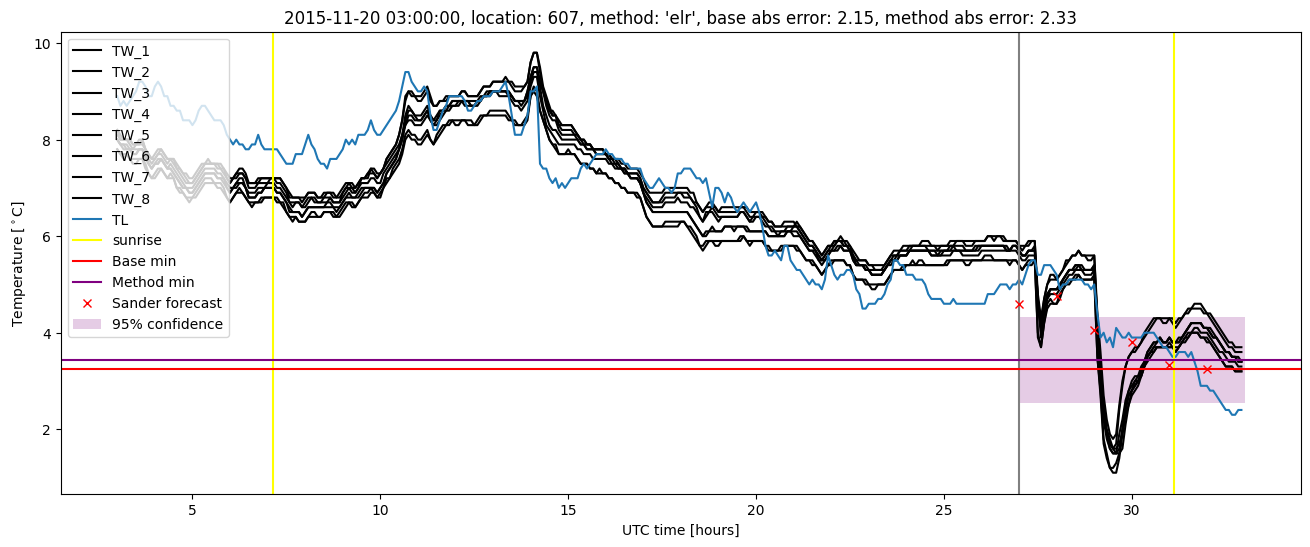
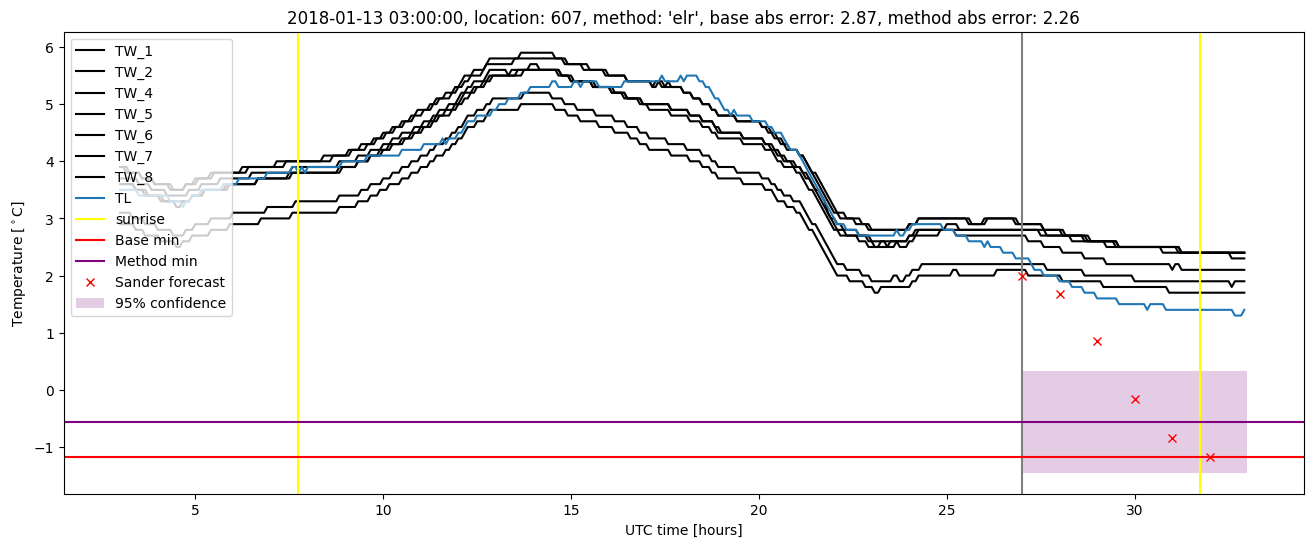
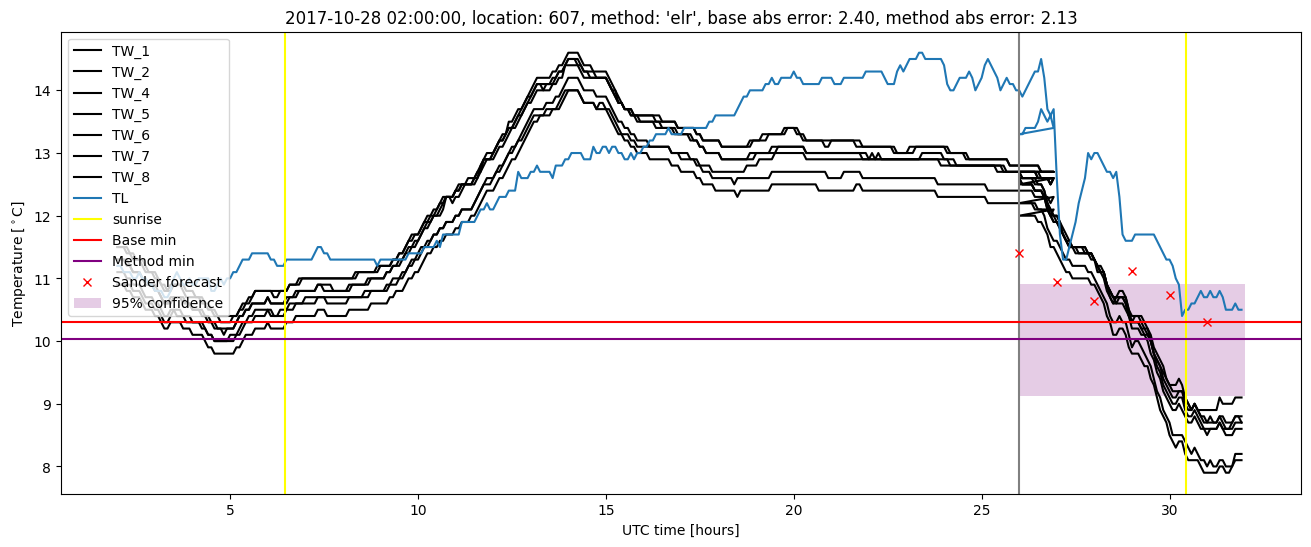
Extended logistic regression results
| names |
period |
power |
significance |
meanSquareError |
absError |
maxError |
CRPS |
IGN |
| baseline |
winter 2016 |
0.994 |
0.065 |
0.376 |
0.450 |
2.996 |
NaN |
NaN |
| elr |
winter 2016 |
0.977 |
0.065 |
0.336 |
0.430 |
2.980 |
0.579 |
4.480 |
| baseline |
winter 2017 |
0.967 |
0.070 |
0.501 |
0.503 |
3.110 |
NaN |
NaN |
| elr |
winter 2017 |
0.967 |
0.046 |
0.396 |
0.467 |
2.335 |
0.555 |
4.561 |
| baseline |
winter 2018 |
0.971 |
0.075 |
0.403 |
0.454 |
2.872 |
NaN |
NaN |
| elr |
winter 2018 |
0.978 |
0.050 |
0.361 |
0.468 |
2.264 |
0.583 |
4.630 |
| baseline |
winter 2019 |
0.992 |
0.000e+00 |
0.309 |
0.411 |
1.910 |
NaN |
NaN |
| elr |
winter 2019 |
1.000 |
0.062 |
0.235 |
0.378 |
1.306 |
0.547 |
3.410 |
| baseline |
all |
0.983 |
0.061 |
0.395 |
0.454 |
3.110 |
NaN |
NaN |
| elr |
all |
0.981 |
0.054 |
0.333 |
0.437 |
2.980 |
0.568 |
4.310 |
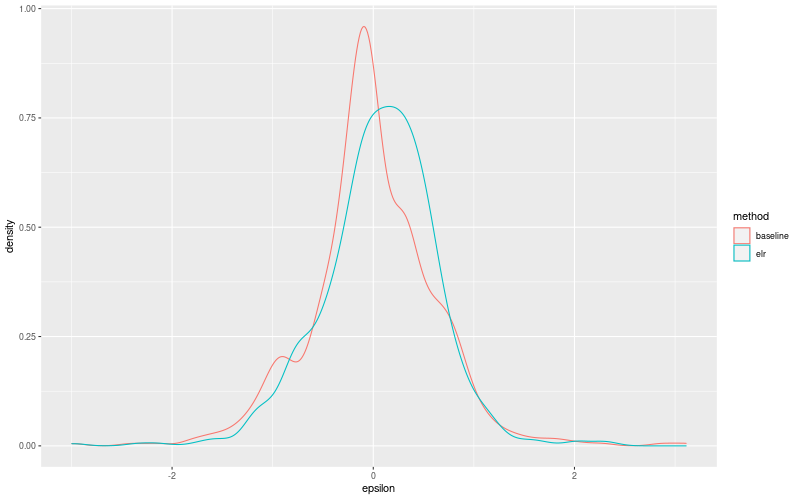
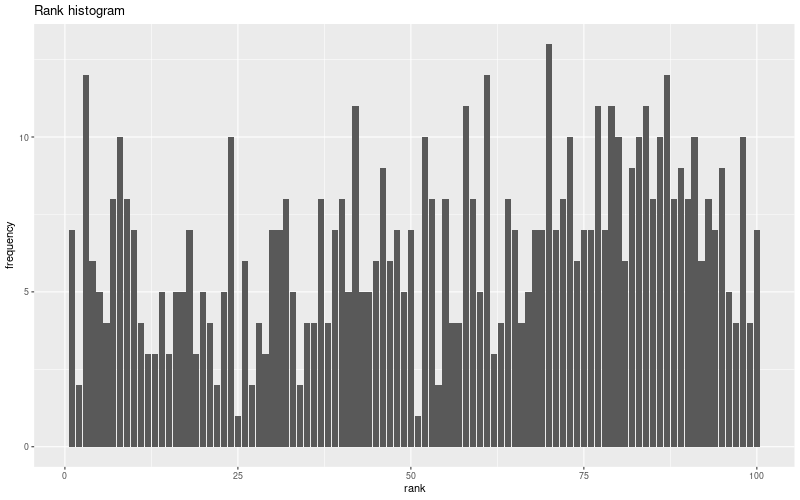
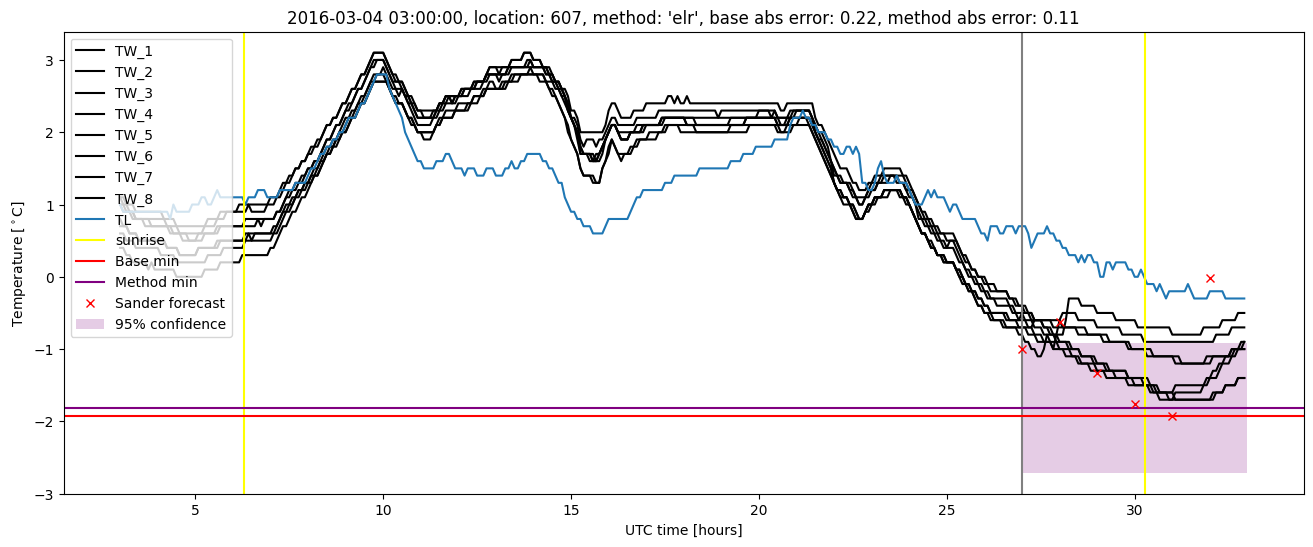
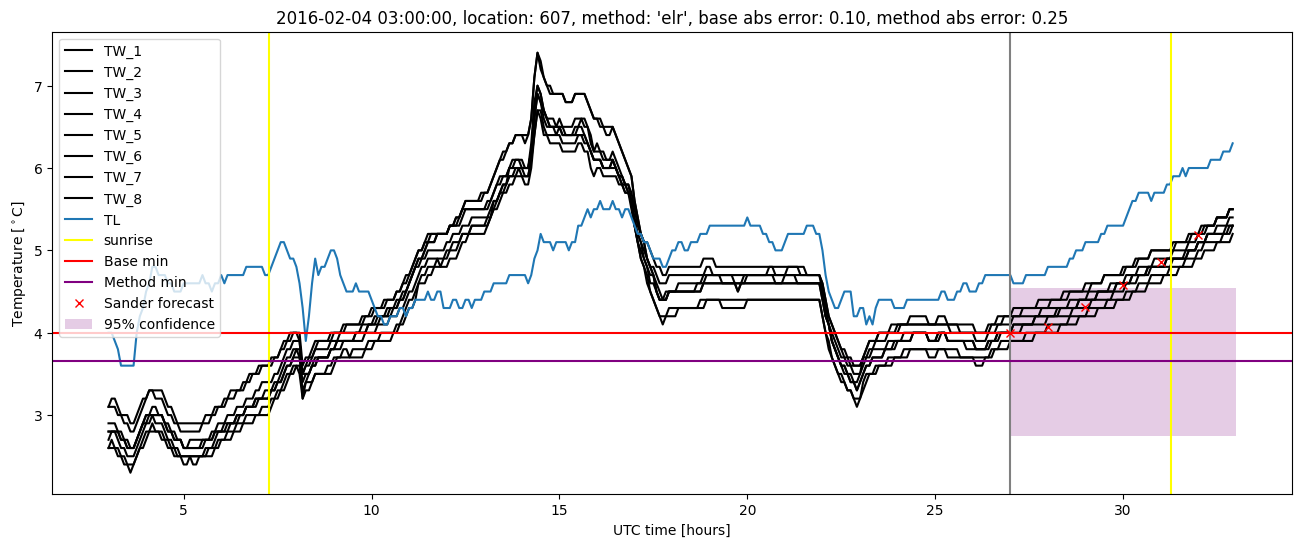
Extended logistic regression plots