GMS location: 606
Random forest results
| names |
period |
power |
significance |
meanSquareError |
absError |
maxError |
CRPS |
IGN |
| baseline |
winter 2016 |
0.988 |
0.138 |
0.374 |
0.442 |
2.515 |
NaN |
NaN |
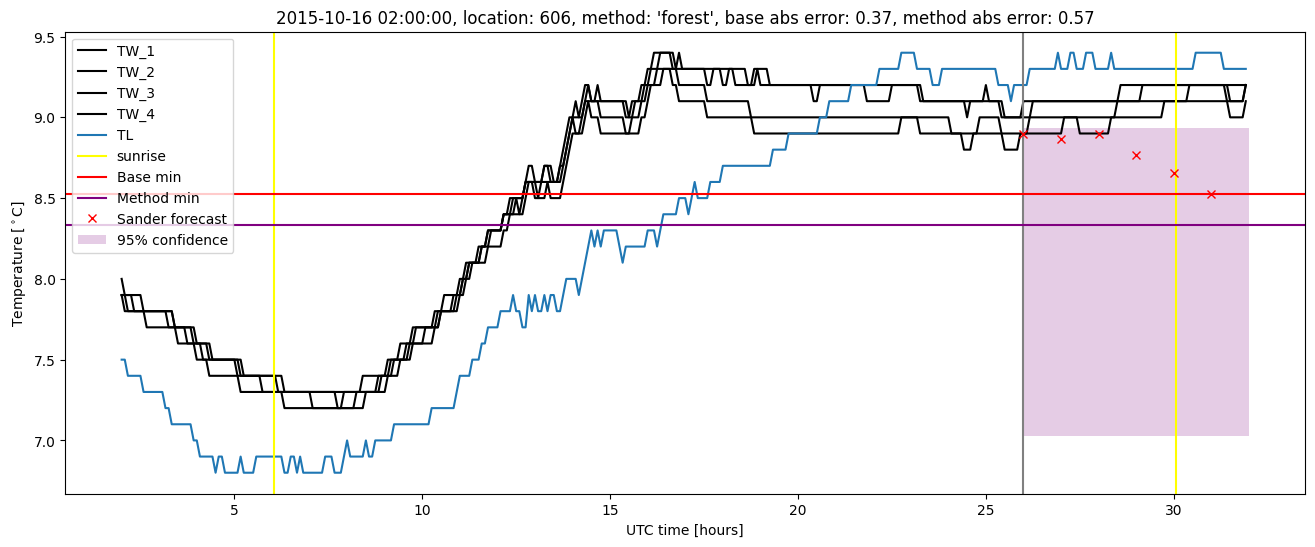
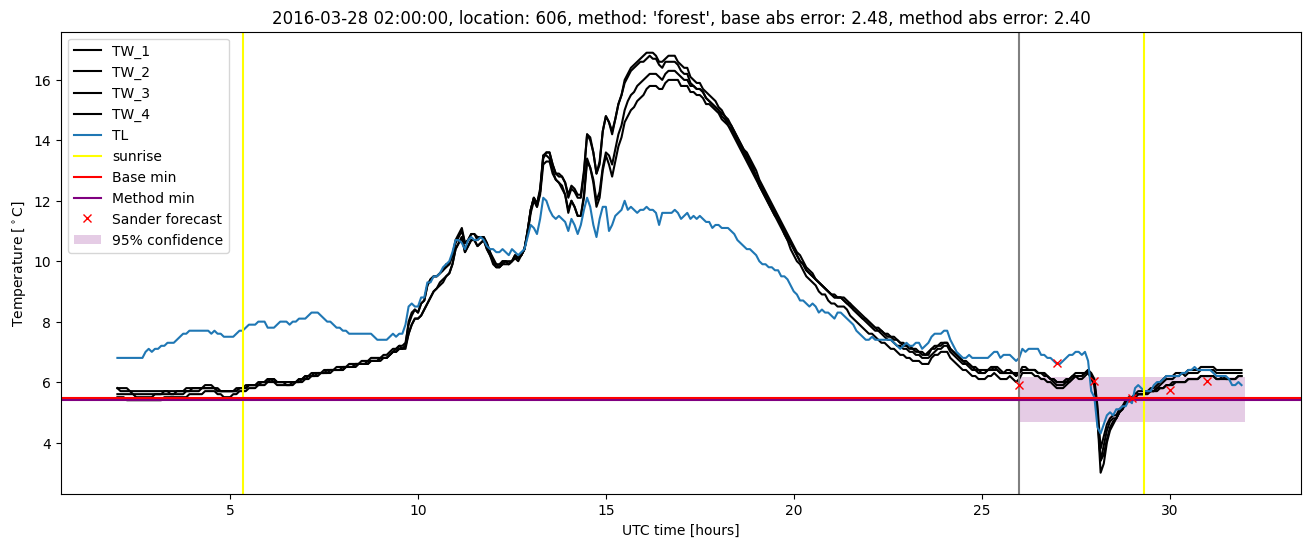
| forest |
winter 2016 |
0.983 |
0.103 |
0.303 |
0.411 |
2.400 |
0.496 |
3.586 |
| baseline |
winter 2017 |
0.965 |
0.000e+00 |
0.476 |
0.497 |
2.868 |
NaN |
NaN |
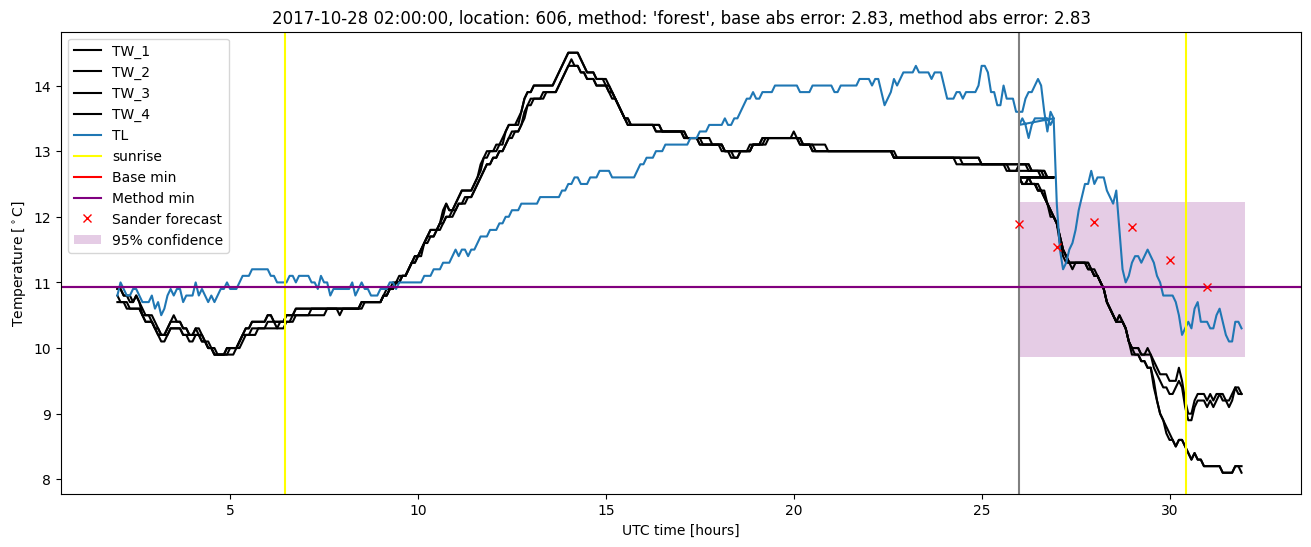
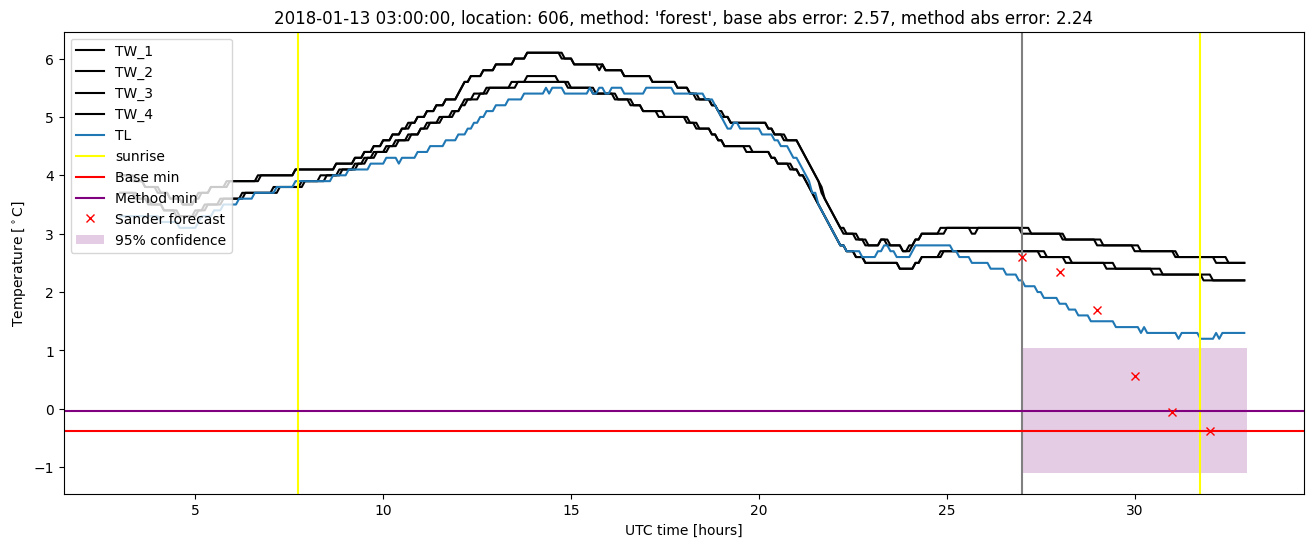
| forest |
winter 2017 |
0.974 |
0.000e+00 |
0.349 |
0.418 |
1.789 |
0.469 |
3.874 |
| baseline |
winter 2018 |
0.973 |
0.069 |
0.444 |
0.456 |
2.834 |
NaN |
NaN |
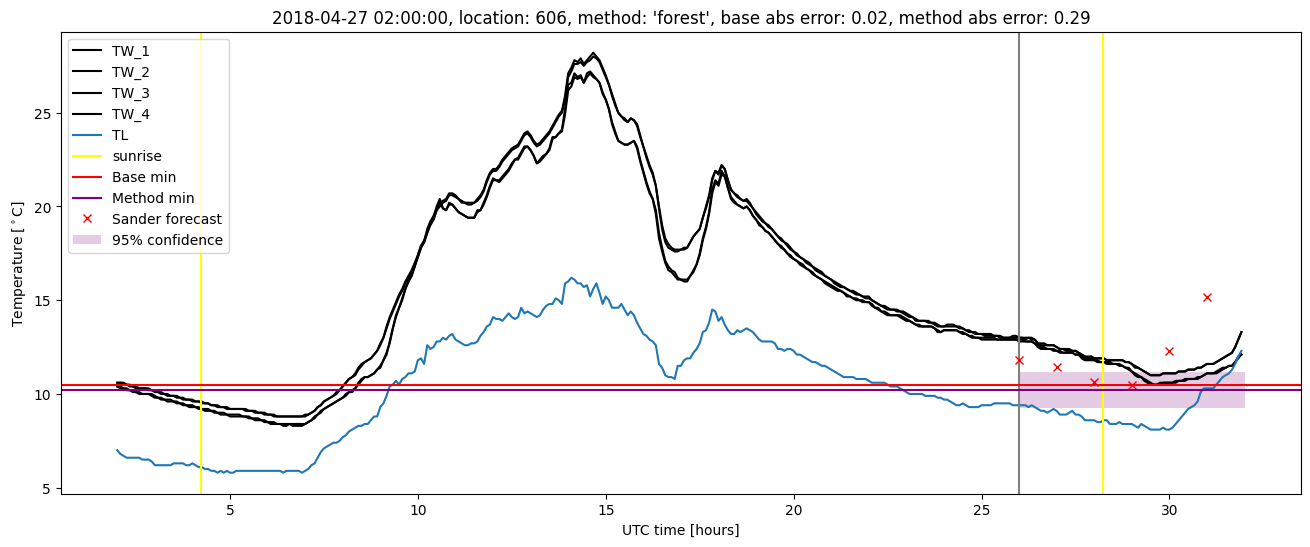
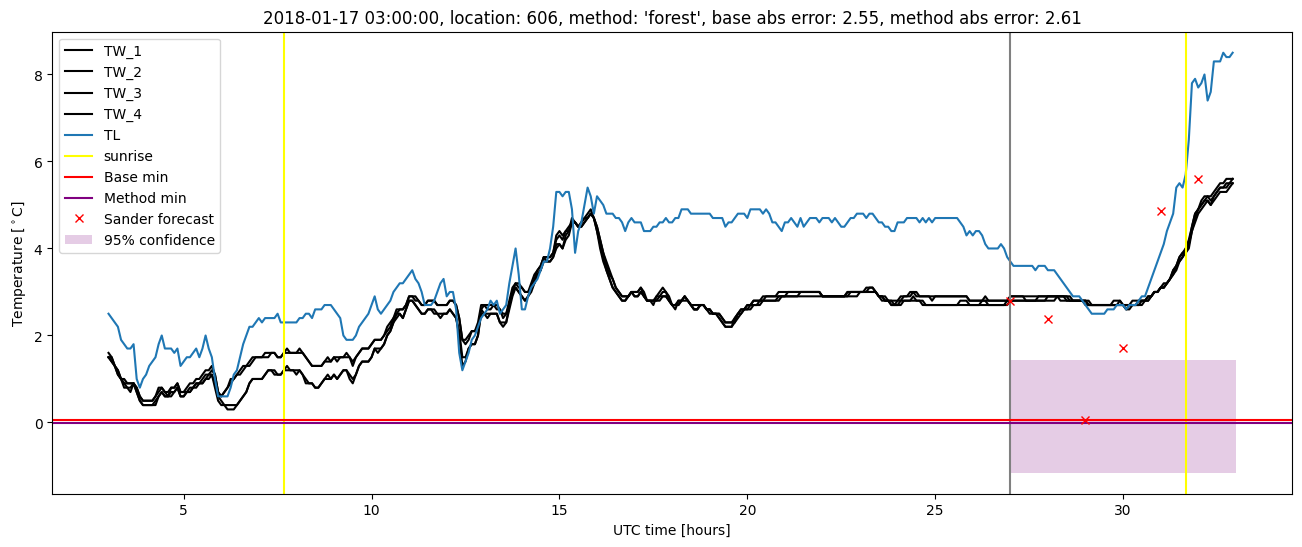
| forest |
winter 2018 |
0.973 |
0.069 |
0.398 |
0.435 |
2.826 |
0.499 |
3.173 |
| baseline |
winter 2019 |
0.993 |
0.091 |
0.255 |
0.368 |
2.059 |
NaN |
NaN |
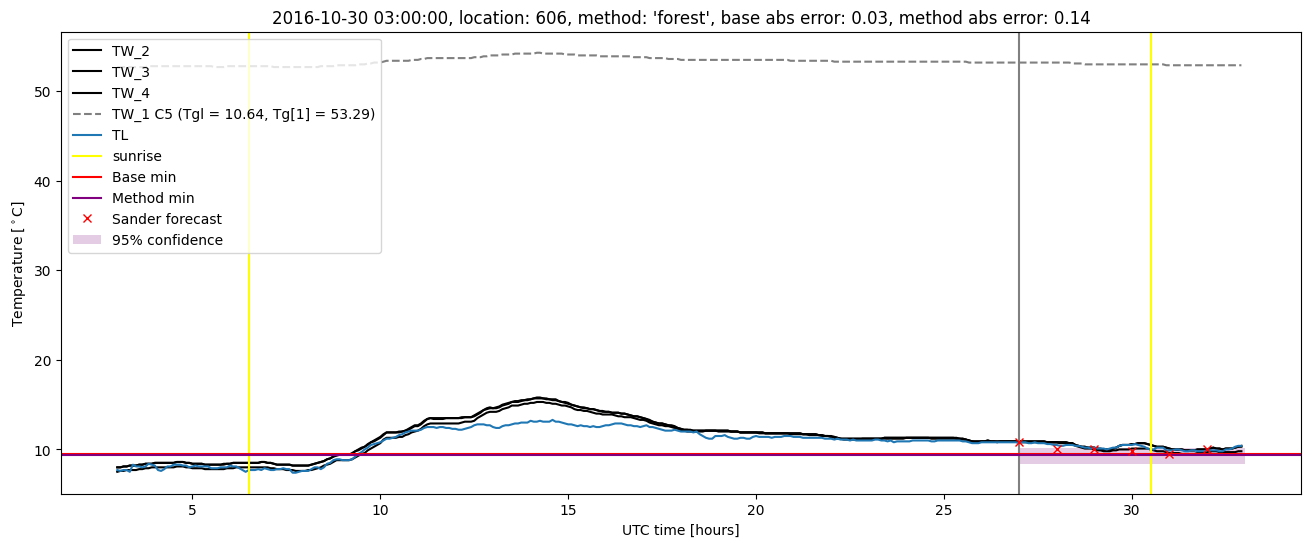
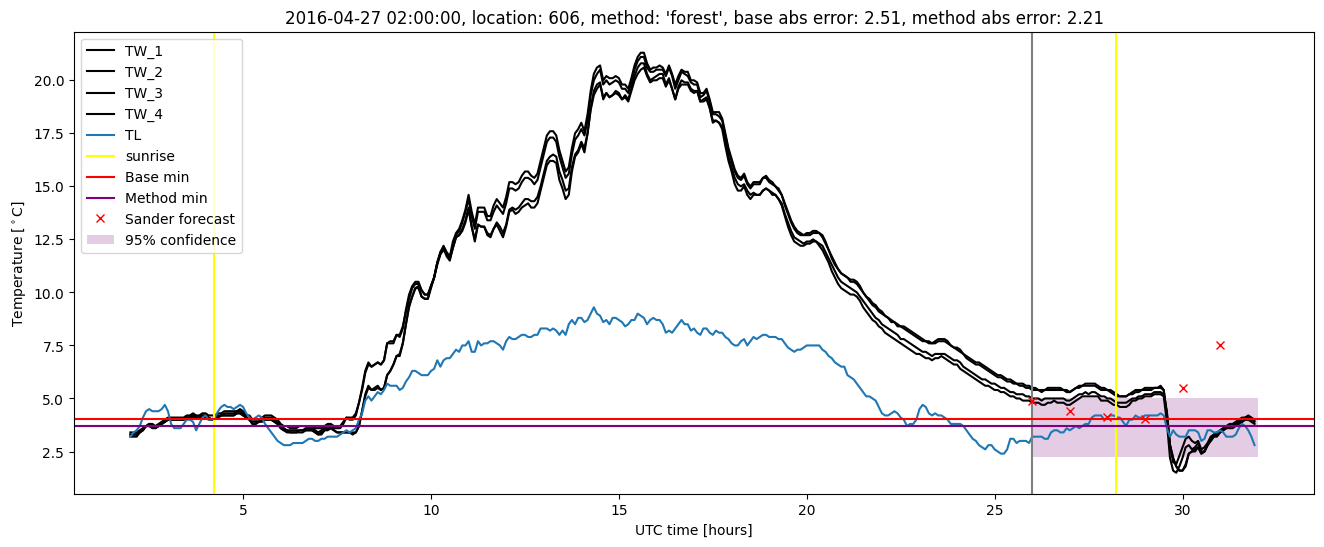
| forest |
winter 2019 |
0.993 |
0.091 |
0.178 |
0.319 |
1.241 |
0.485 |
2.988 |
| baseline |
all |
0.981 |
0.065 |
0.388 |
0.441 |
2.868 |
NaN |
NaN |
| forest |
all |
0.981 |
0.056 |
0.310 |
0.398 |
2.826 |
0.488 |
3.408 |
Random forest plots
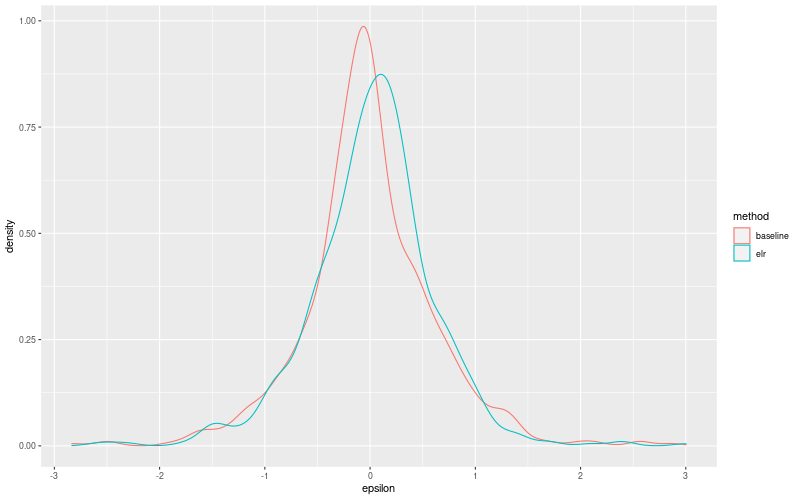
Extended logistic regression results
| names |
period |
power |
significance |
meanSquareError |
absError |
maxError |
CRPS |
IGN |
| baseline |
winter 2016 |
0.988 |
0.138 |
0.374 |
0.442 |
2.515 |
NaN |
NaN |
| elr |
winter 2016 |
0.994 |
0.103 |
0.338 |
0.436 |
2.451 |
0.550 |
3.483 |
| baseline |
winter 2017 |
0.965 |
0.000e+00 |
0.476 |
0.497 |
2.868 |
NaN |
NaN |
| elr |
winter 2017 |
0.983 |
0.000e+00 |
0.381 |
0.444 |
2.394 |
0.471 |
2.752 |
| baseline |
winter 2018 |
0.973 |
0.069 |
0.444 |
0.456 |
2.834 |
NaN |
NaN |
| elr |
winter 2018 |
0.980 |
0.138 |
0.426 |
0.461 |
3.003 |
0.535 |
3.639 |
| baseline |
winter 2019 |
0.993 |
0.091 |
0.255 |
0.368 |
2.059 |
NaN |
NaN |
| elr |
winter 2019 |
0.993 |
0.091 |
0.233 |
0.373 |
1.453 |
0.539 |
2.910 |
| baseline |
all |
0.981 |
0.065 |
0.388 |
0.441 |
2.868 |
NaN |
NaN |
| elr |
all |
0.988 |
0.075 |
0.347 |
0.430 |
3.003 |
0.526 |
3.232 |
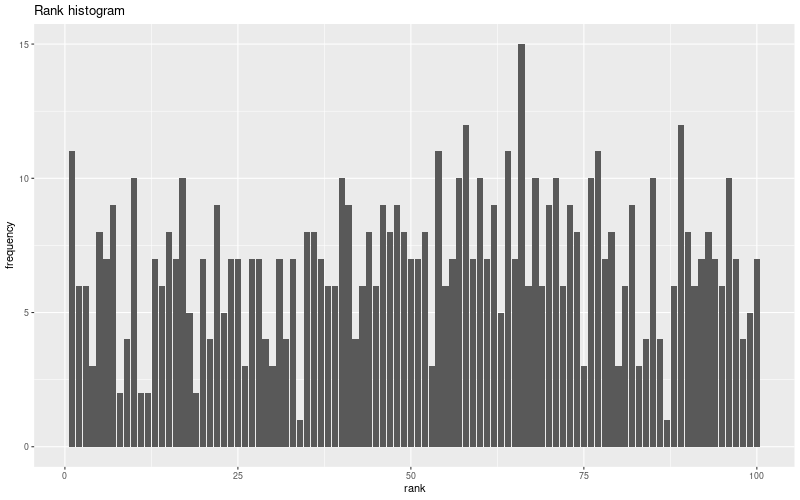
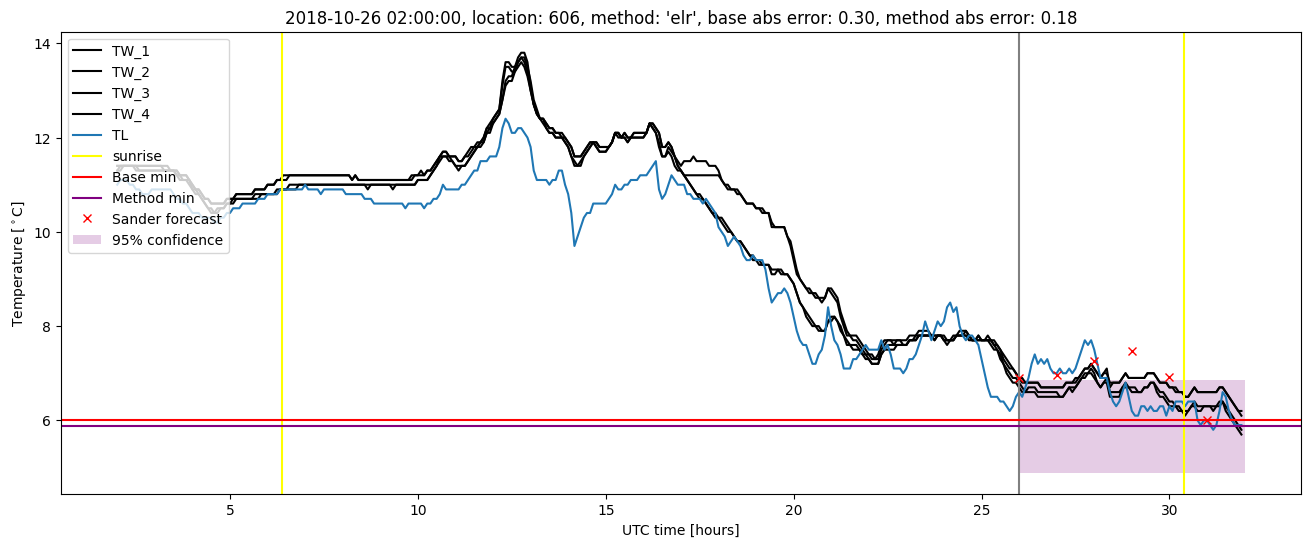
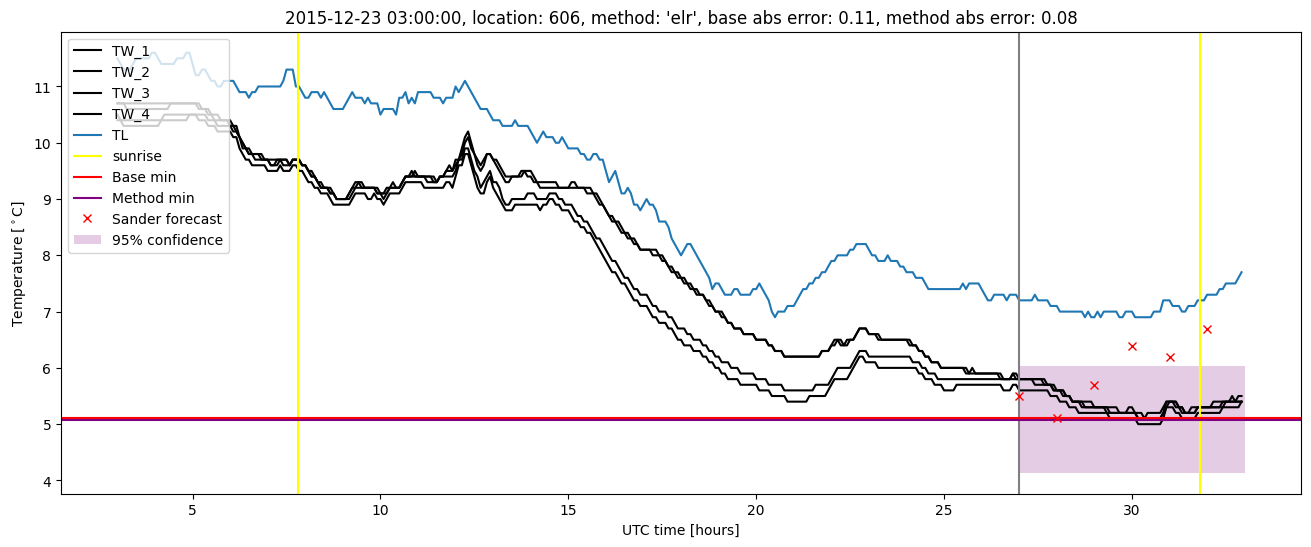
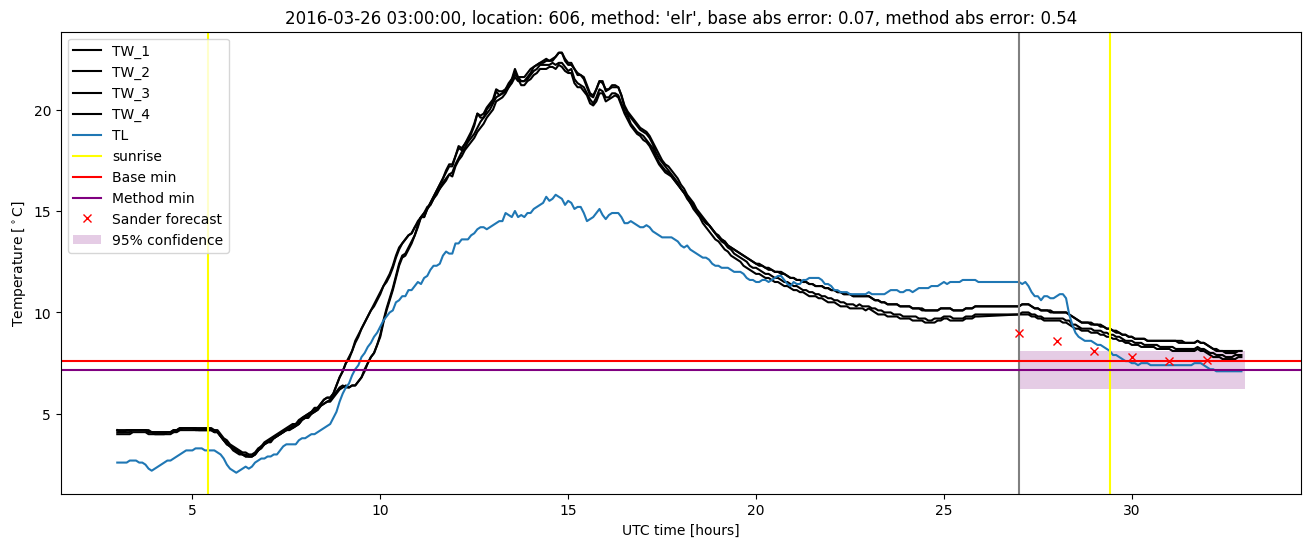
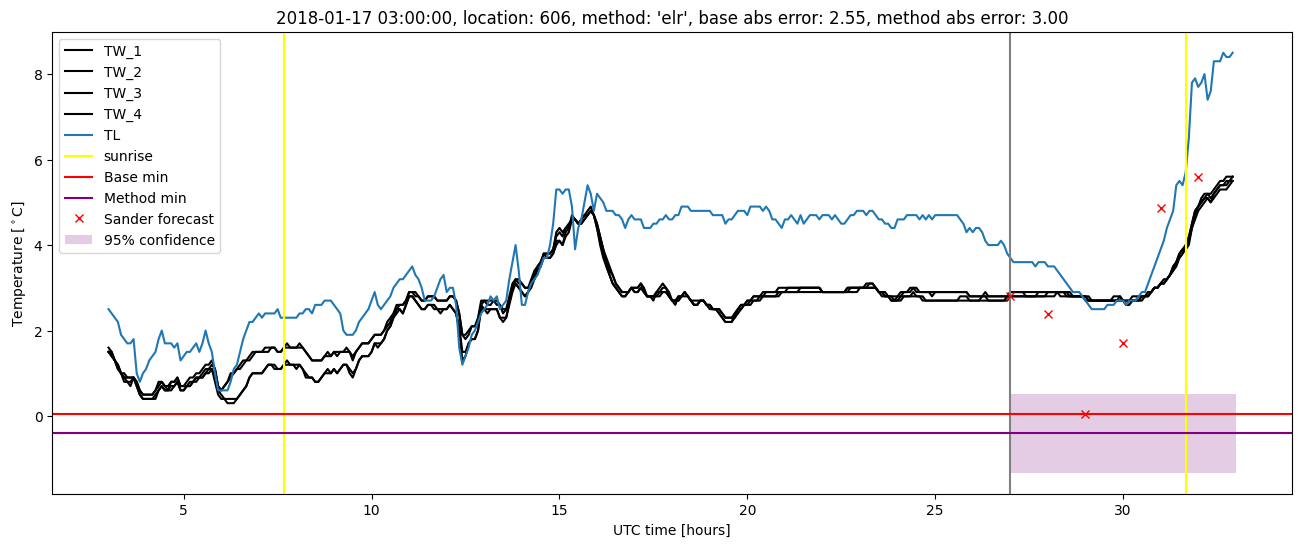
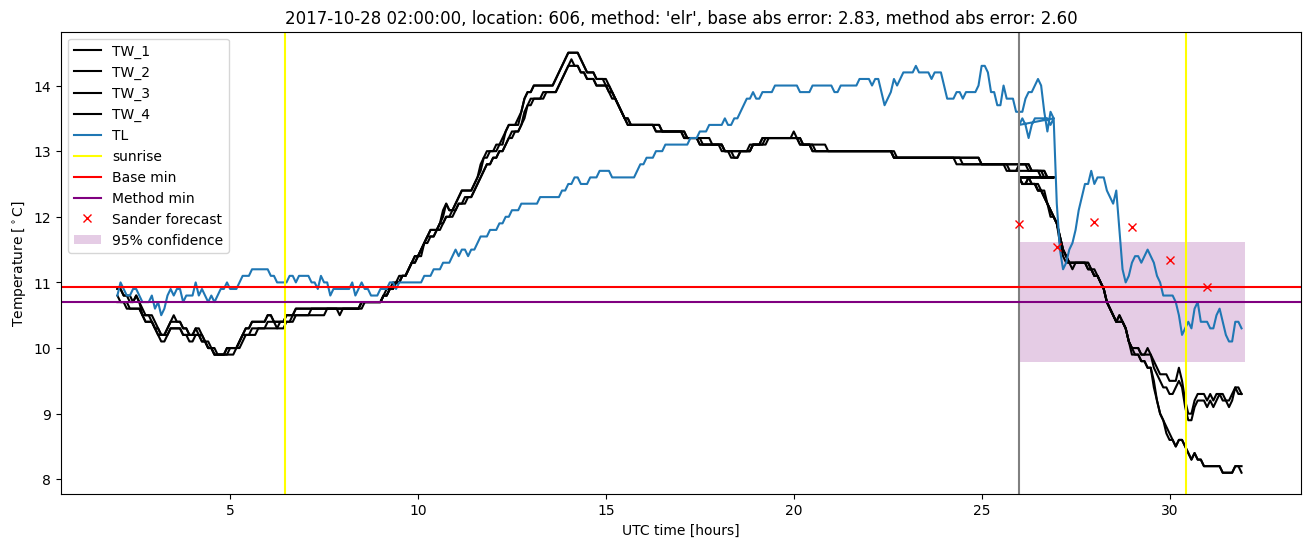
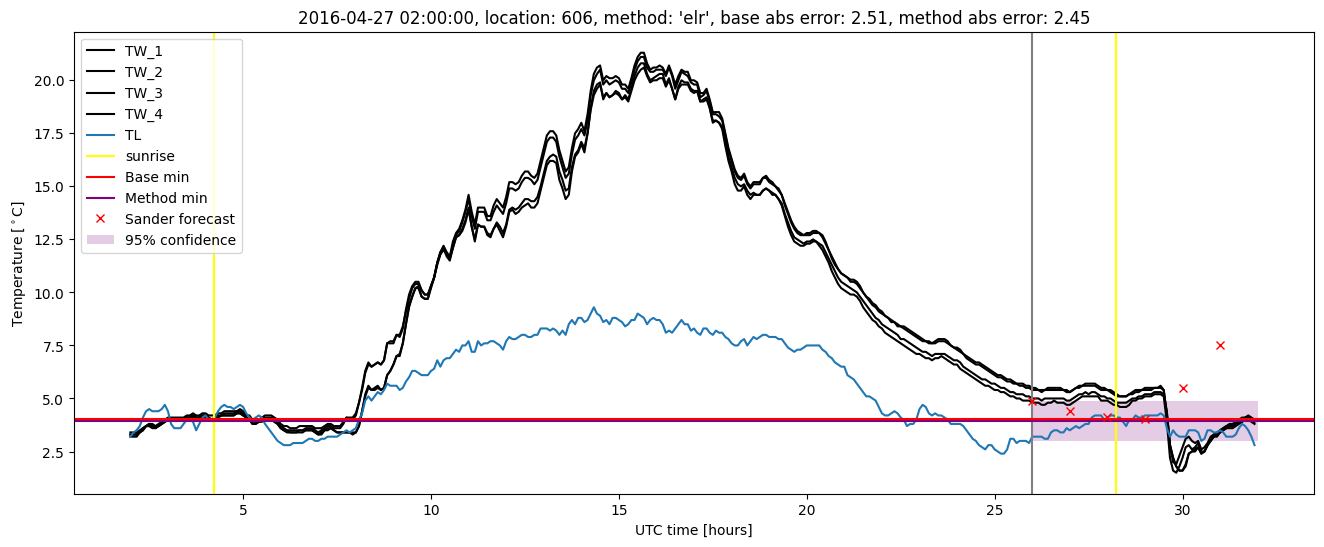
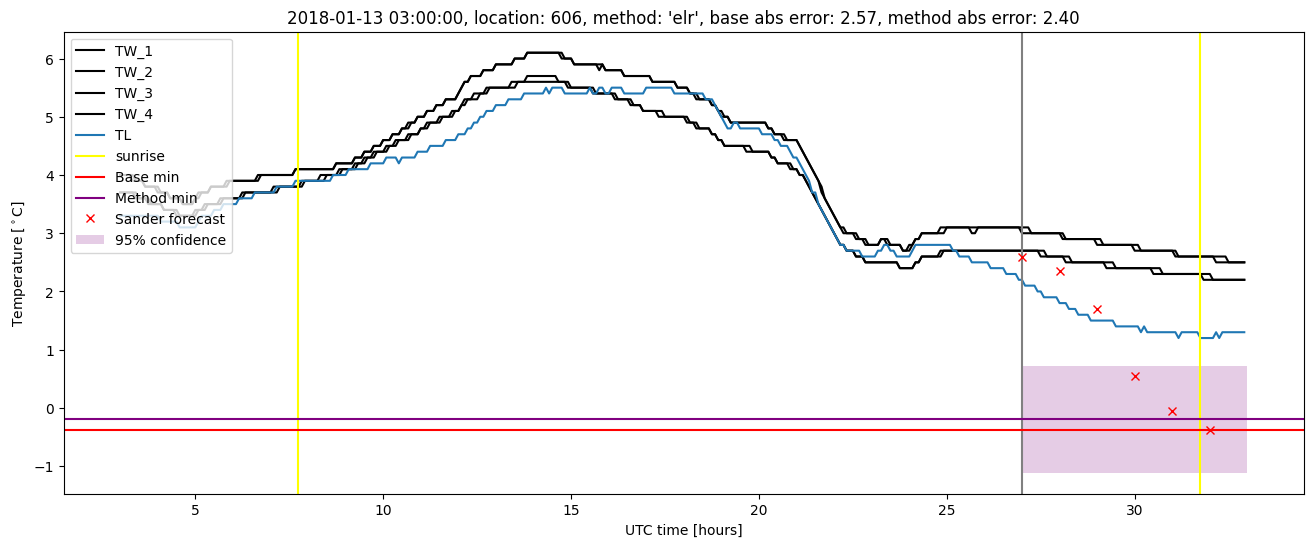
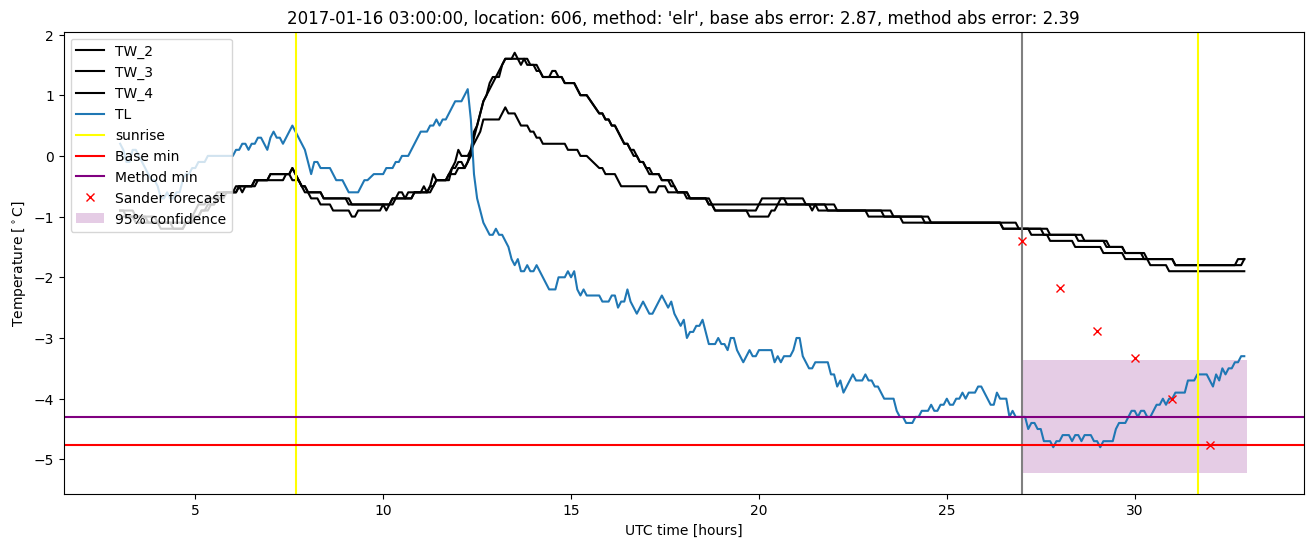
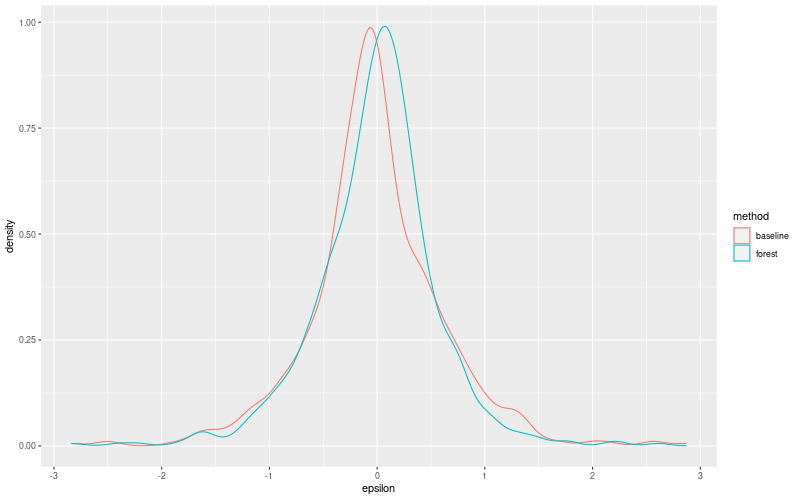
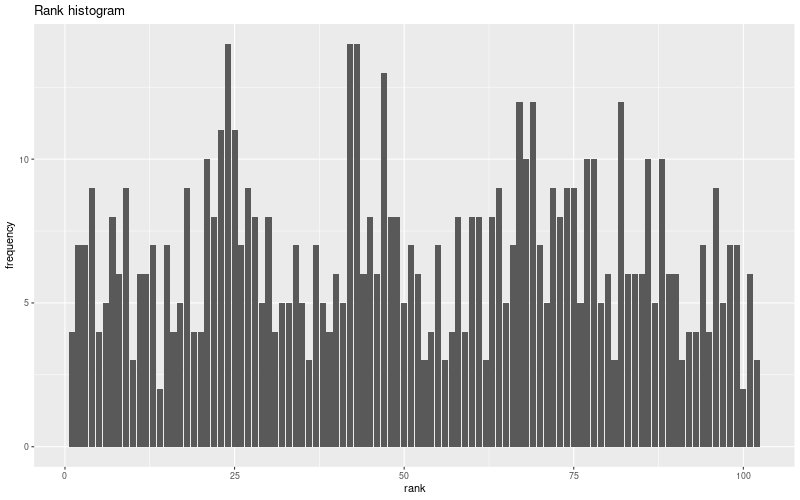
Extended logistic regression plots