GMS location: 605
Random forest results
| names |
period |
power |
significance |
meanSquareError |
absError |
maxError |
CRPS |
IGN |
| baseline |
winter 2016 |
0.995 |
0.095 |
0.378 |
0.459 |
2.183 |
NaN |
NaN |
| forest |
winter 2016 |
0.989 |
0.095 |
0.335 |
0.432 |
1.702 |
0.558 |
3.205 |
| baseline |
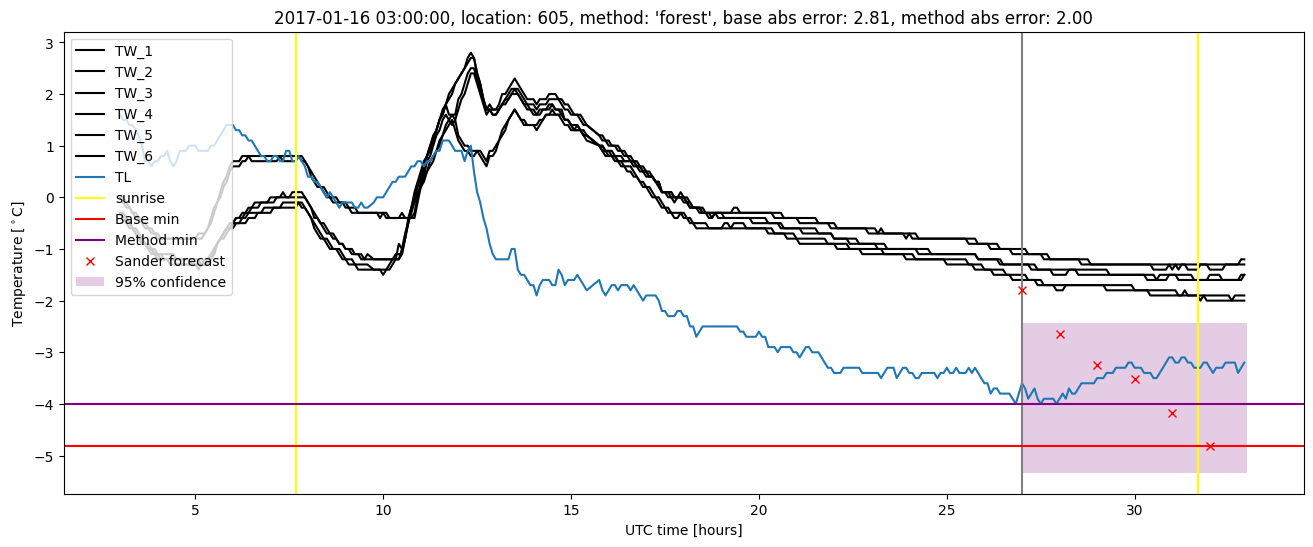
winter 2017 |
1.000 |
0.053 |
0.482 |
0.493 |
2.814 |
NaN |
NaN |
| forest |
winter 2017 |
1.000 |
0.053 |
0.402 |
0.455 |
2.080 |
0.517 |
3.173 |
| baseline |
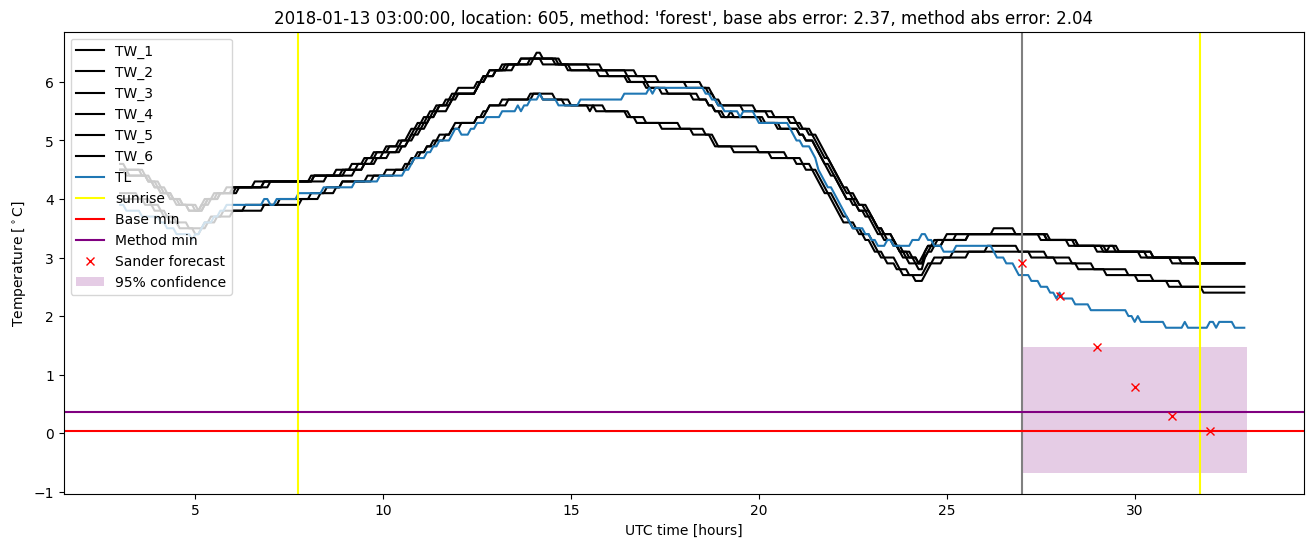
winter 2018 |
1.000 |
0.036 |
0.443 |
0.480 |
2.371 |
NaN |
NaN |
| forest |
winter 2018 |
0.993 |
0.036 |
0.394 |
0.474 |
2.037 |
0.549 |
3.448 |
| baseline |
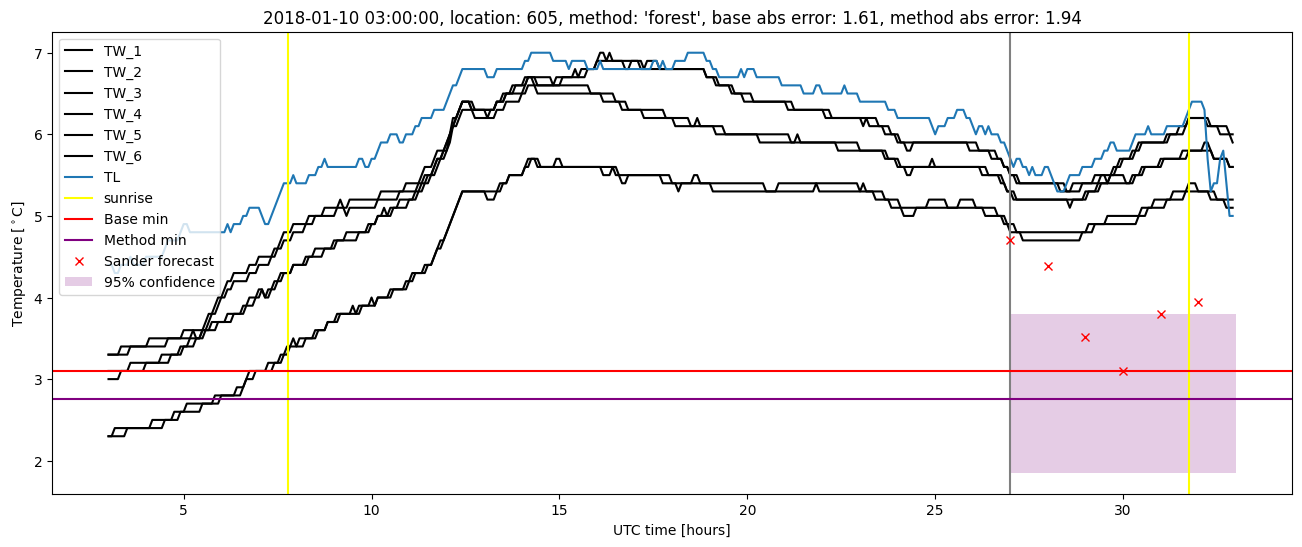
winter 2019 |
1.000 |
0.000e+00 |
0.265 |
0.379 |
1.671 |
NaN |
NaN |
| forest |
winter 2019 |
1.000 |
0.000e+00 |
0.189 |
0.334 |
1.255 |
0.542 |
2.453 |
| baseline |
all |
0.998 |
0.050 |
0.391 |
0.453 |
2.814 |
NaN |
NaN |
| forest |
all |
0.995 |
0.050 |
0.330 |
0.424 |
2.080 |
0.543 |
3.083 |
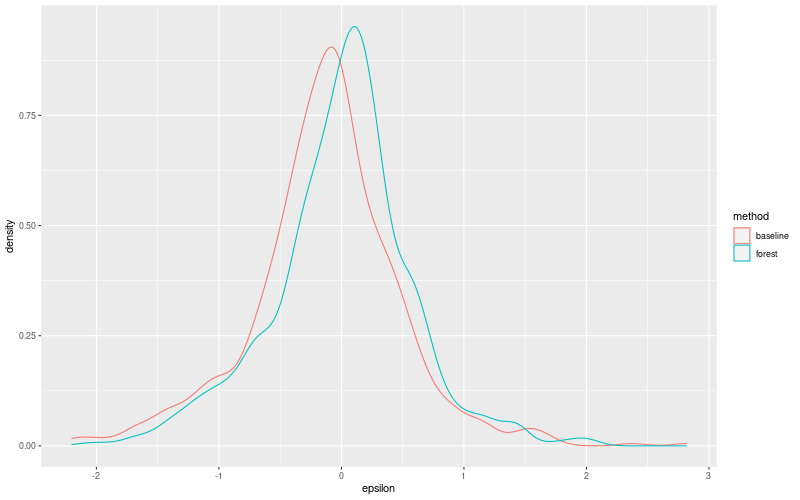
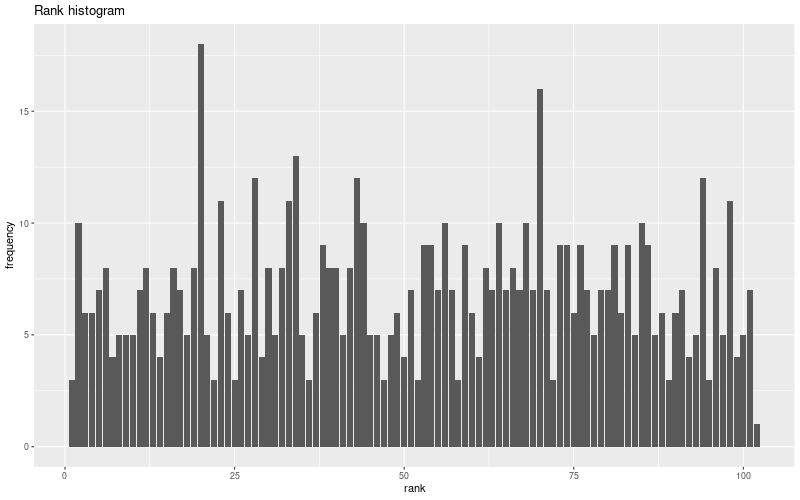
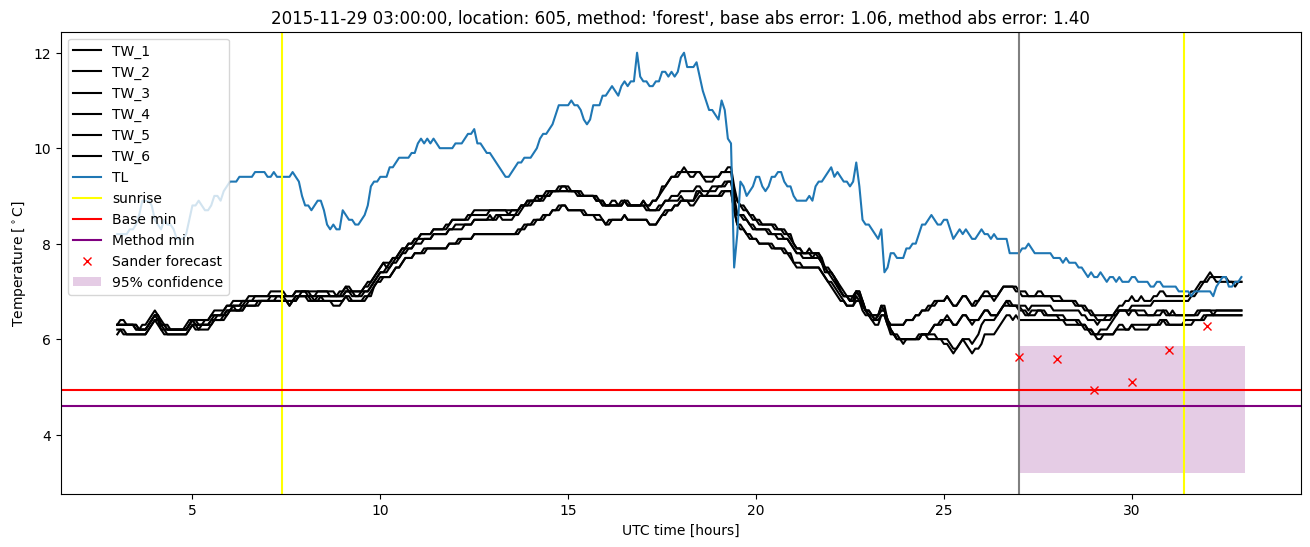
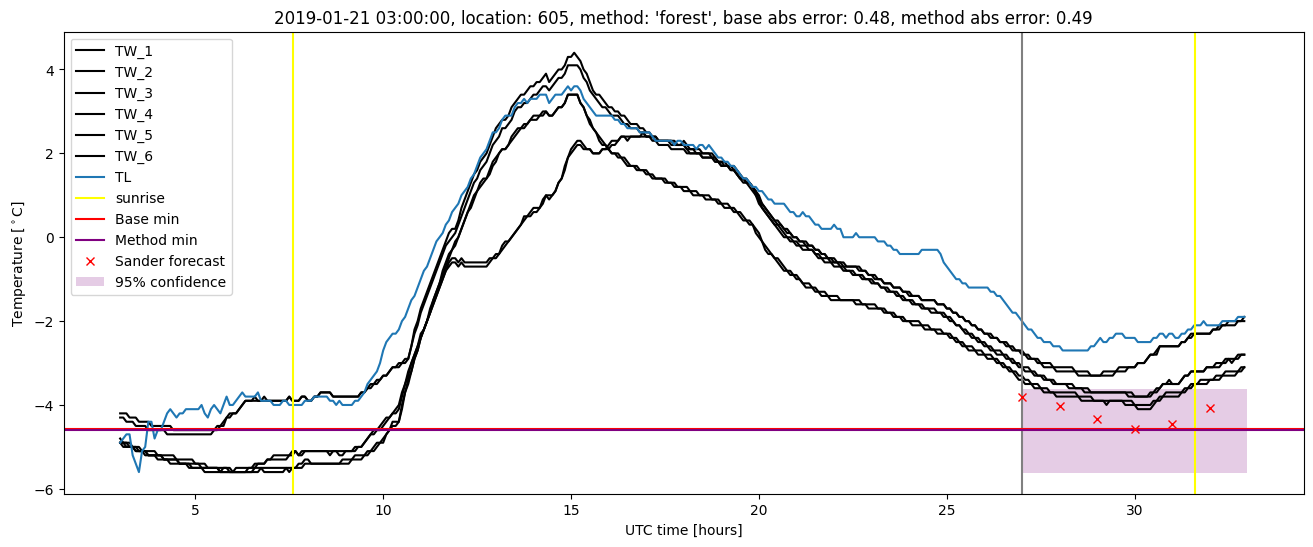
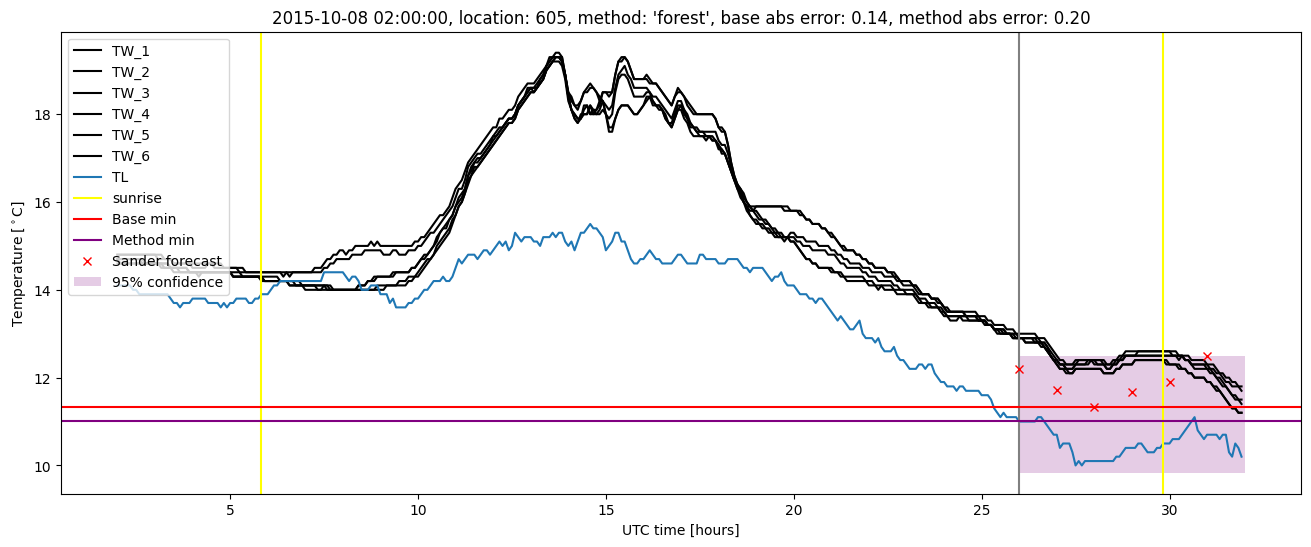
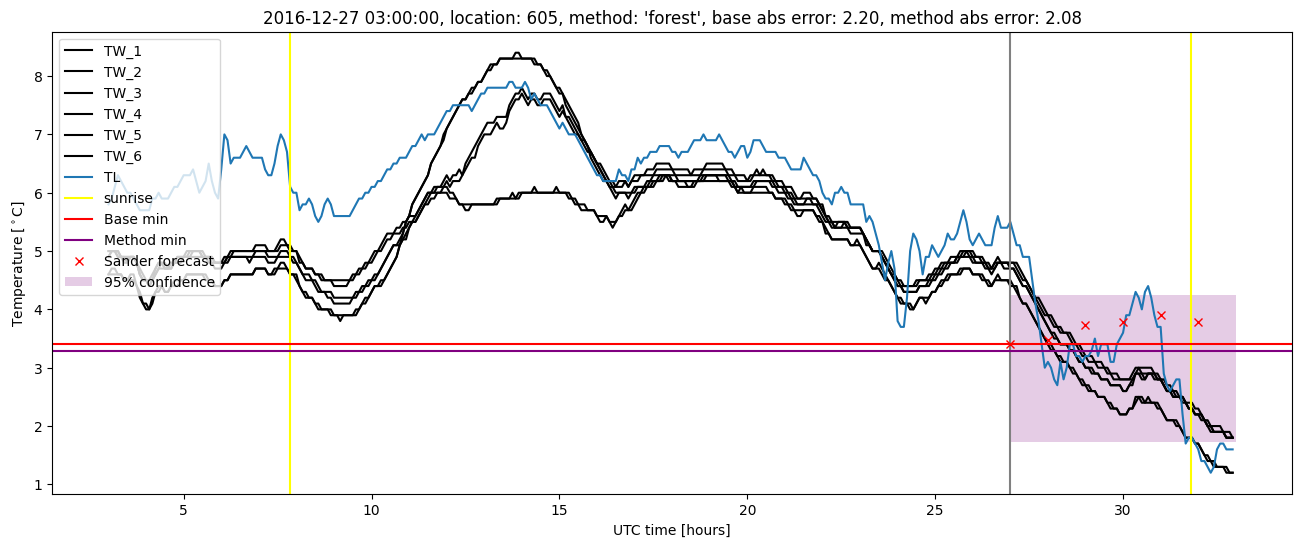
Random forest plots

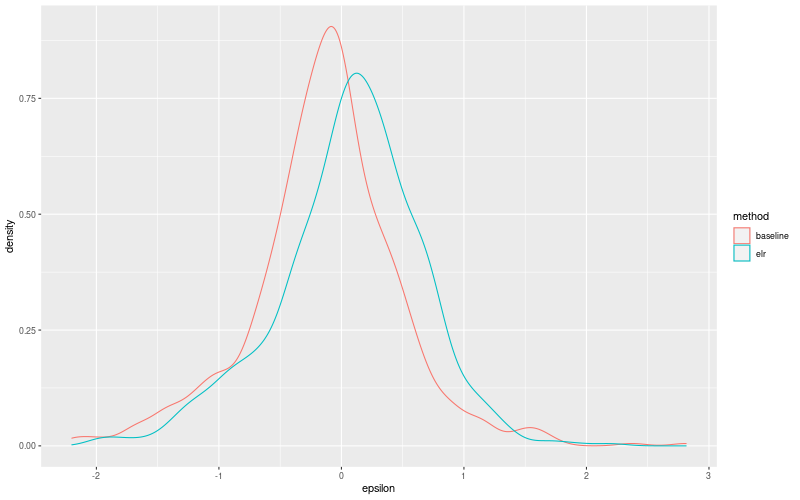
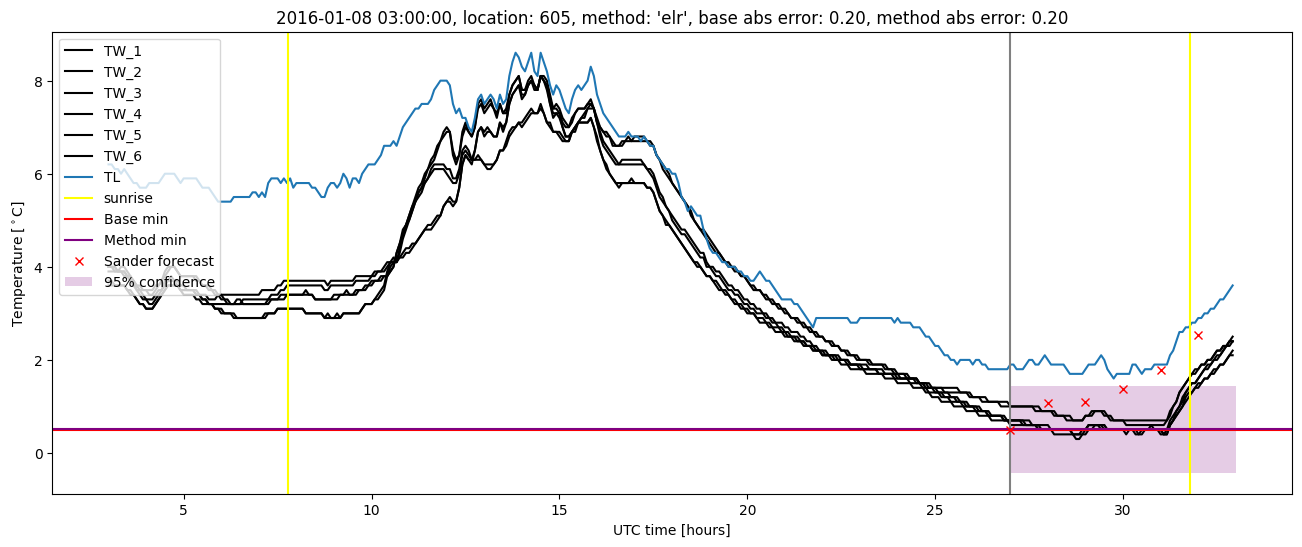
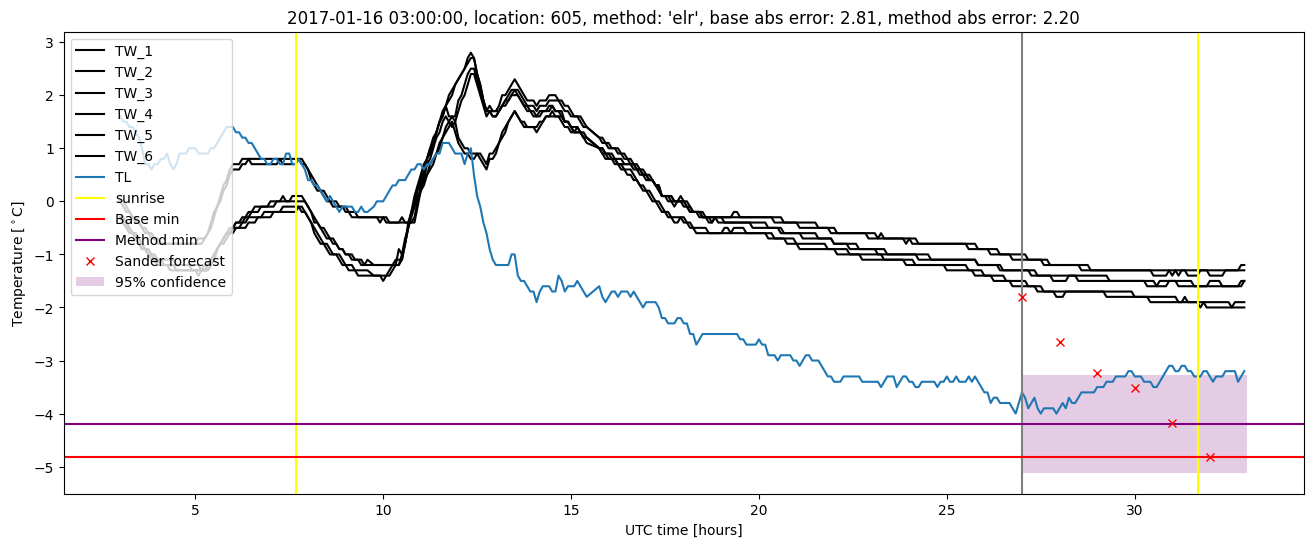
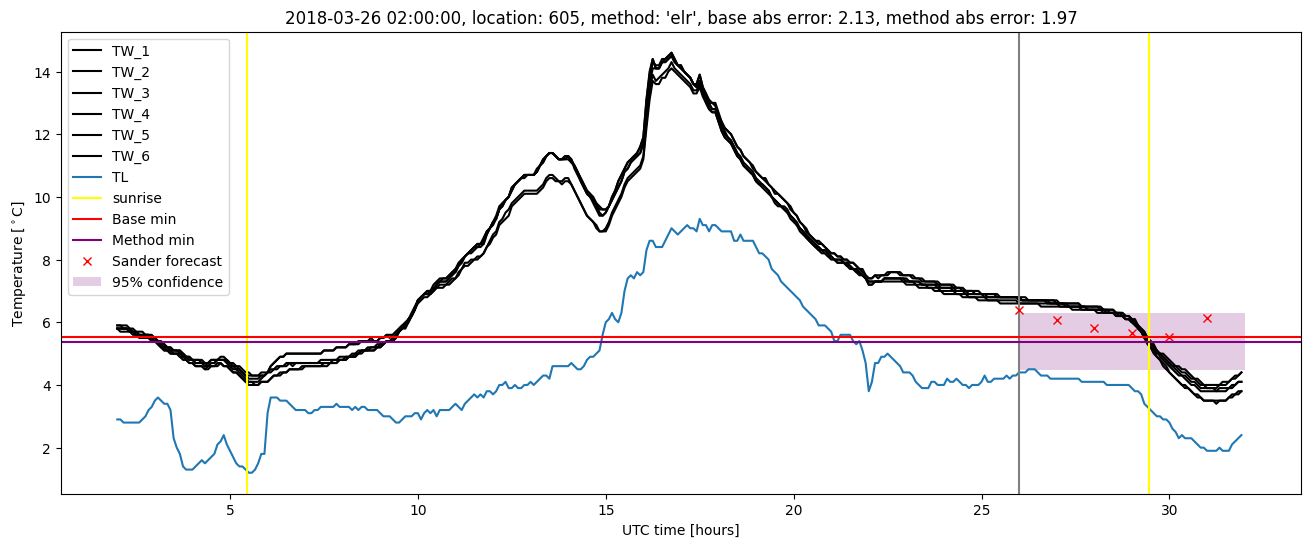
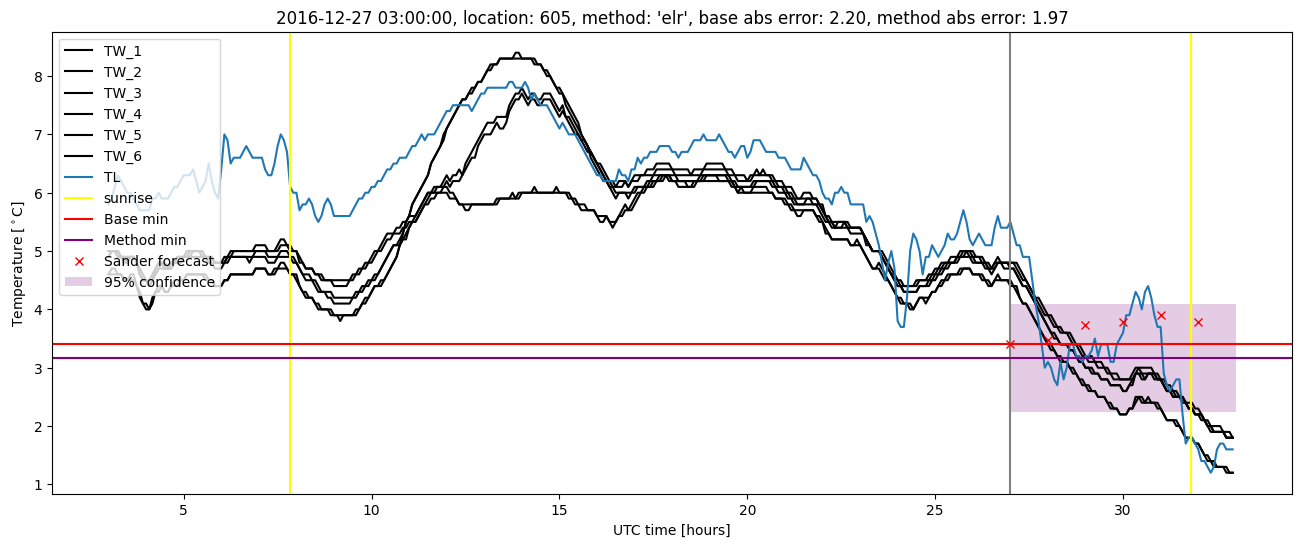
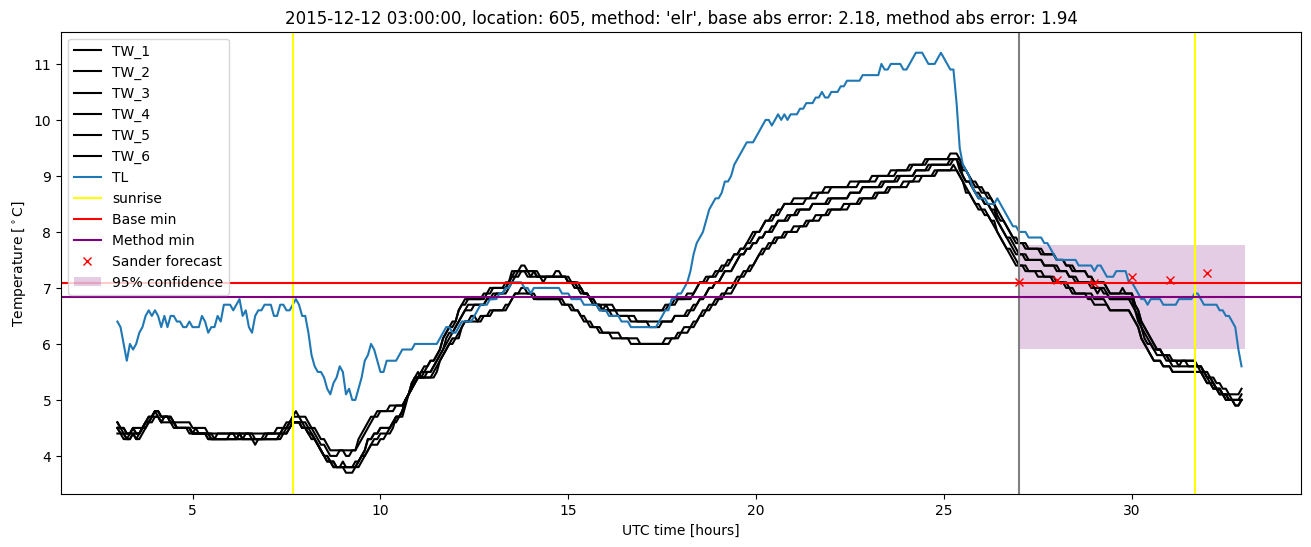
Extended logistic regression results
| names |
period |
power |
significance |
meanSquareError |
absError |
maxError |
CRPS |
IGN |
| baseline |
winter 2016 |
0.995 |
0.095 |
0.378 |
0.459 |
2.183 |
NaN |
NaN |
| elr |
winter 2016 |
0.978 |
0.095 |
0.365 |
0.474 |
1.941 |
0.682 |
5.223 |
| baseline |
winter 2017 |
1.000 |
0.053 |
0.482 |
0.493 |
2.814 |
NaN |
NaN |
| elr |
winter 2017 |
0.991 |
0.053 |
0.379 |
0.456 |
2.200 |
0.611 |
4.545 |
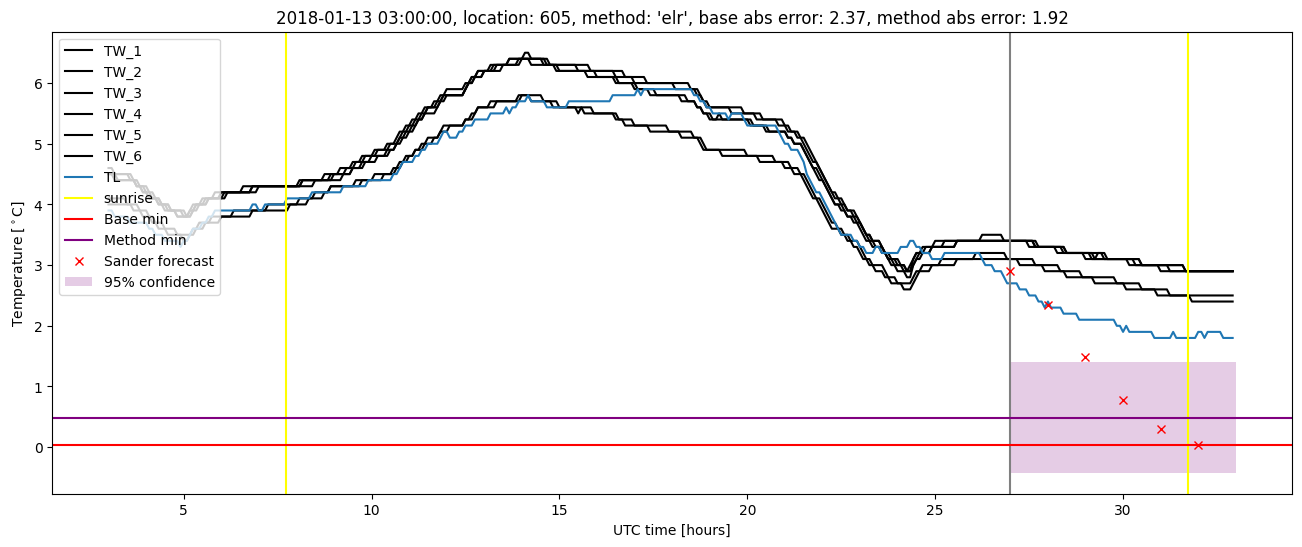
| baseline |
winter 2018 |
1.000 |
0.036 |
0.443 |
0.480 |
2.371 |
NaN |
NaN |
| elr |
winter 2018 |
0.987 |
0.071 |
0.422 |
0.507 |
1.975 |
0.645 |
5.175 |
| baseline |
winter 2019 |
1.000 |
0.000e+00 |
0.265 |
0.379 |
1.671 |
NaN |
NaN |
| elr |
winter 2019 |
1.000 |
0.000e+00 |
0.238 |
0.386 |
1.374 |
0.566 |
3.074 |
| baseline |
all |
0.998 |
0.050 |
0.391 |
0.453 |
2.814 |
NaN |
NaN |
| elr |
all |
0.988 |
0.059 |
0.353 |
0.458 |
2.200 |
0.630 |
4.558 |
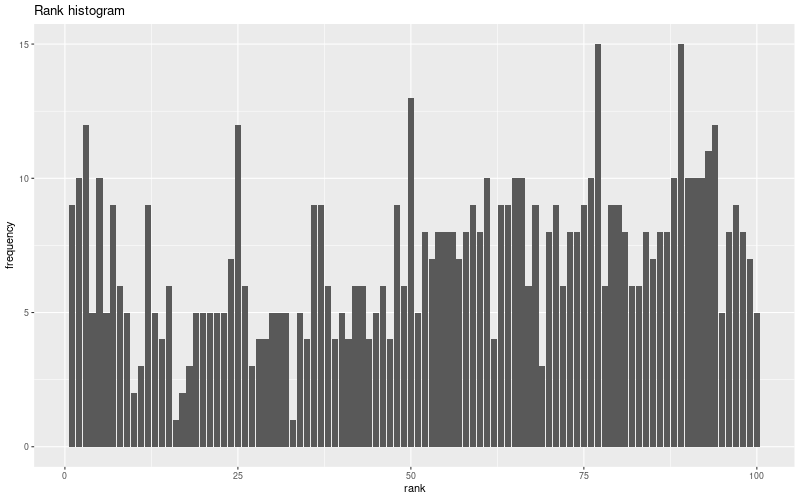
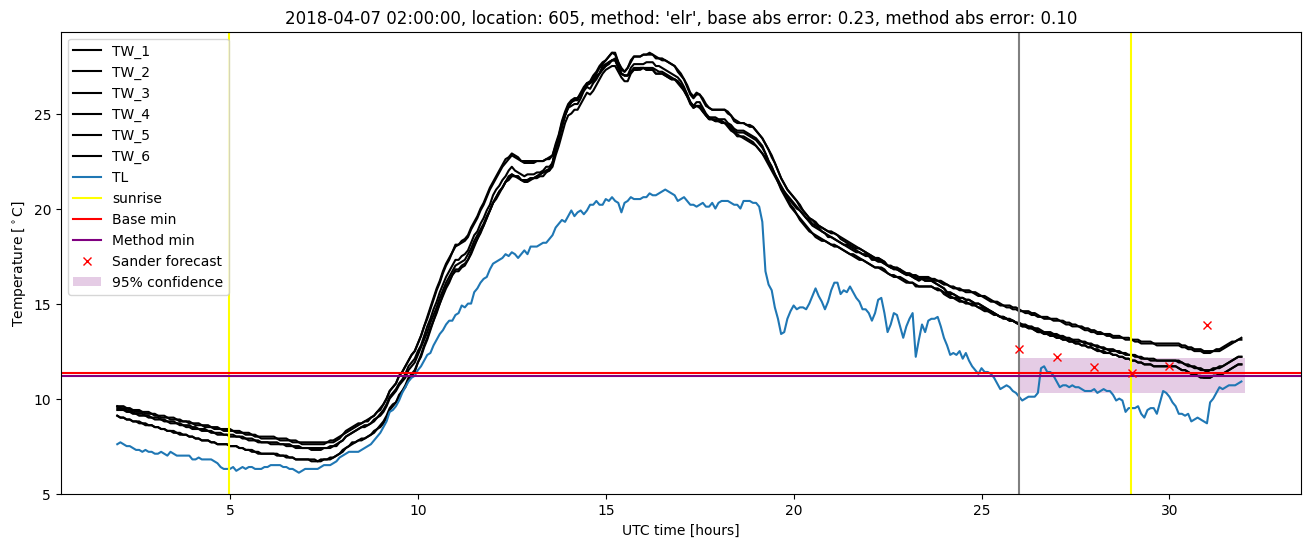
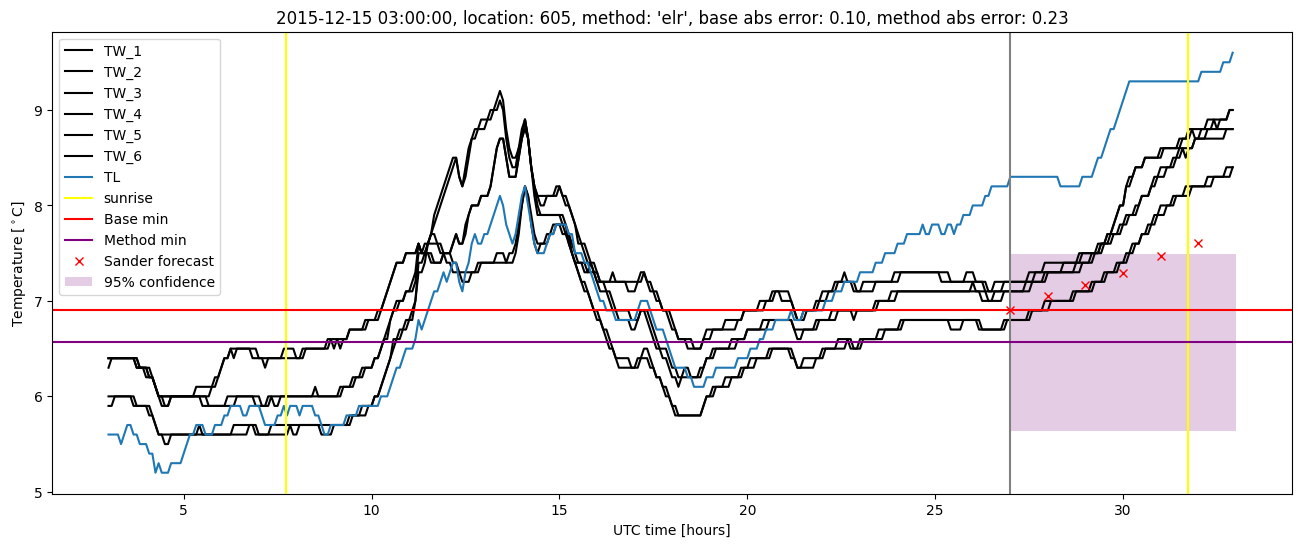
Extended logistic regression plots