GMS location: 604
Random forest results
| names |
period |
power |
significance |
meanSquareError |
absError |
maxError |
CRPS |
IGN |
| baseline |
winter 2016 |
0.995 |
0.045 |
0.325 |
0.432 |
1.708 |
NaN |
NaN |
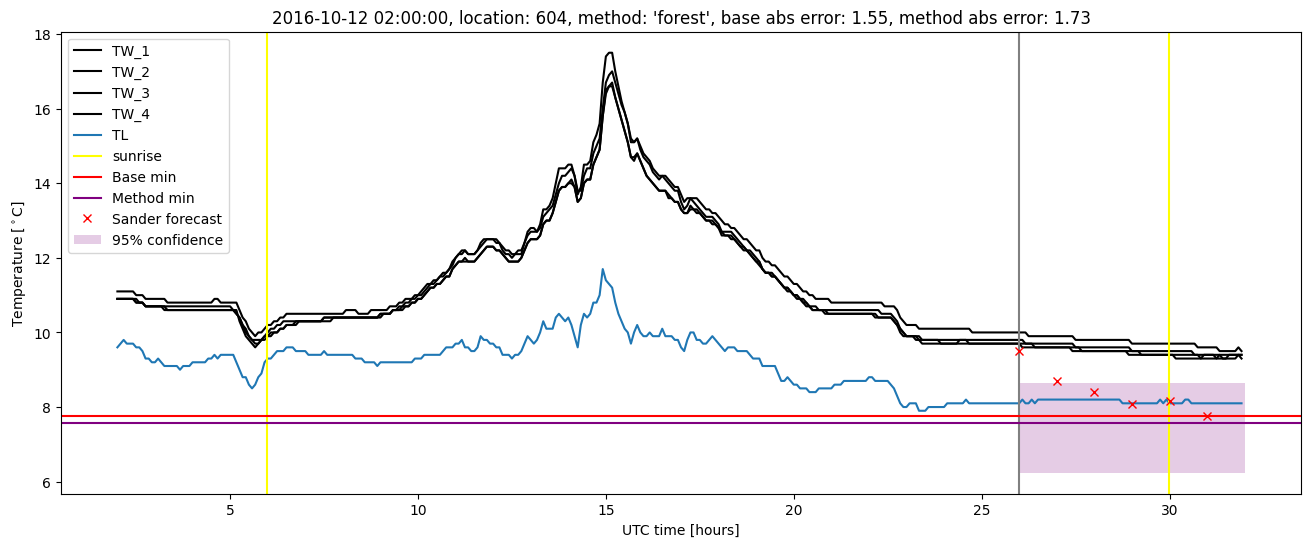
| forest |
winter 2016 |
1.000 |
0.045 |
0.235 |
0.364 |
1.551 |
0.469 |
3.936 |
| baseline |
winter 2017 |
0.950 |
0.000e+00 |
0.545 |
0.526 |
3.201 |
NaN |
NaN |
| forest |
winter 2017 |
0.959 |
0.000e+00 |
0.393 |
0.437 |
2.269 |
0.472 |
4.499 |
| baseline |
winter 2018 |
0.987 |
0.032 |
0.362 |
0.446 |
2.368 |
NaN |
NaN |
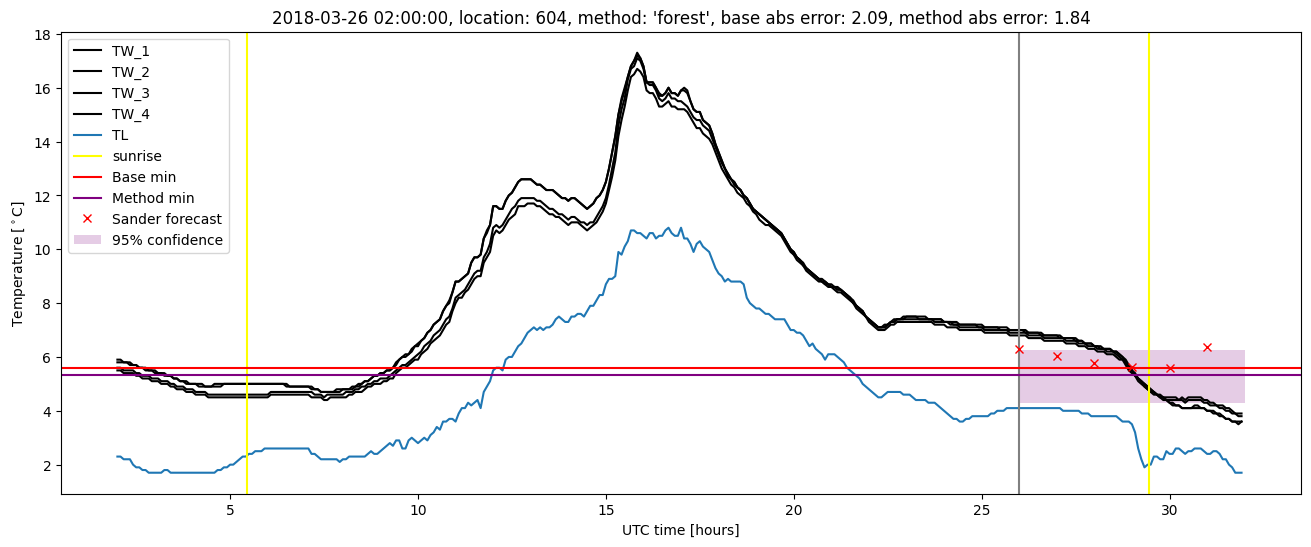
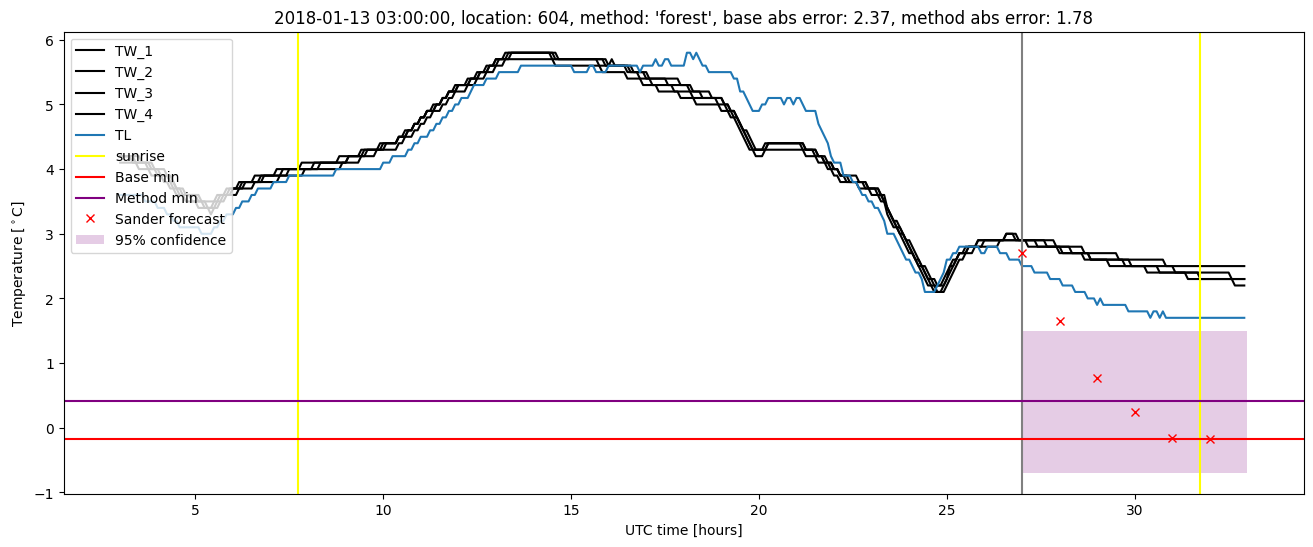
| forest |
winter 2018 |
0.993 |
0.065 |
0.282 |
0.404 |
1.841 |
0.476 |
3.440 |
| baseline |
winter 2019 |
0.993 |
0.000e+00 |
0.259 |
0.372 |
2.016 |
NaN |
NaN |
| forest |
winter 2019 |
1.000 |
0.000e+00 |
0.230 |
0.358 |
1.524 |
0.463 |
3.659 |
| baseline |
all |
0.984 |
0.021 |
0.367 |
0.442 |
3.201 |
NaN |
NaN |
| forest |
all |
0.990 |
0.031 |
0.280 |
0.389 |
2.269 |
0.470 |
3.867 |
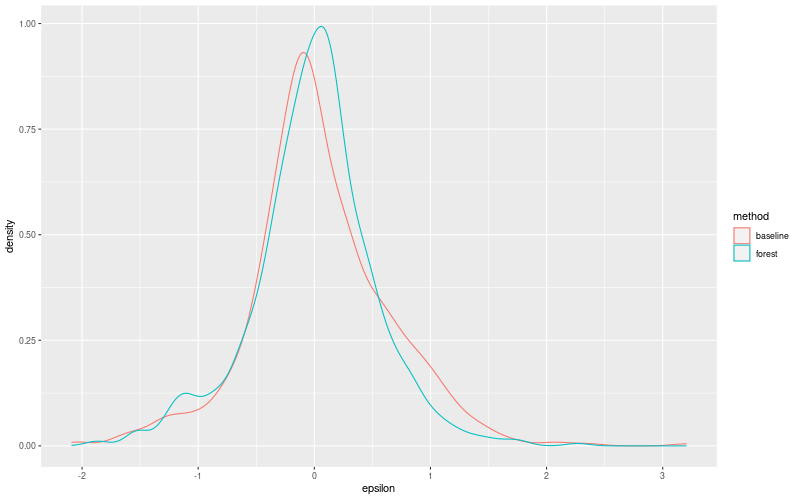
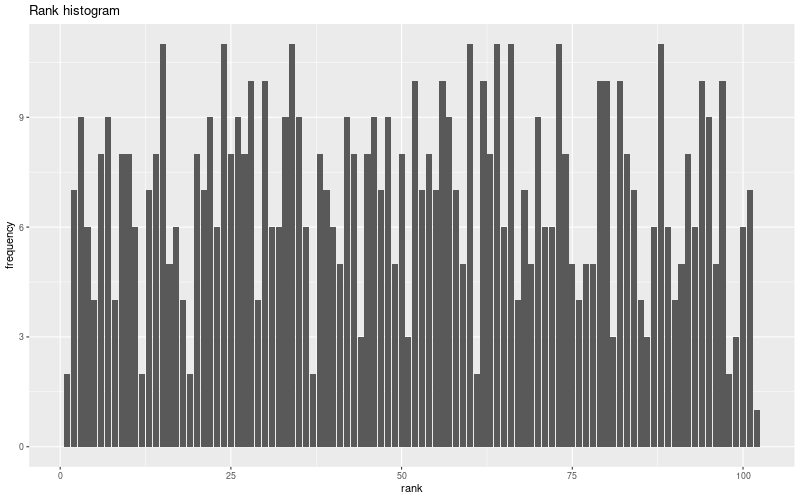
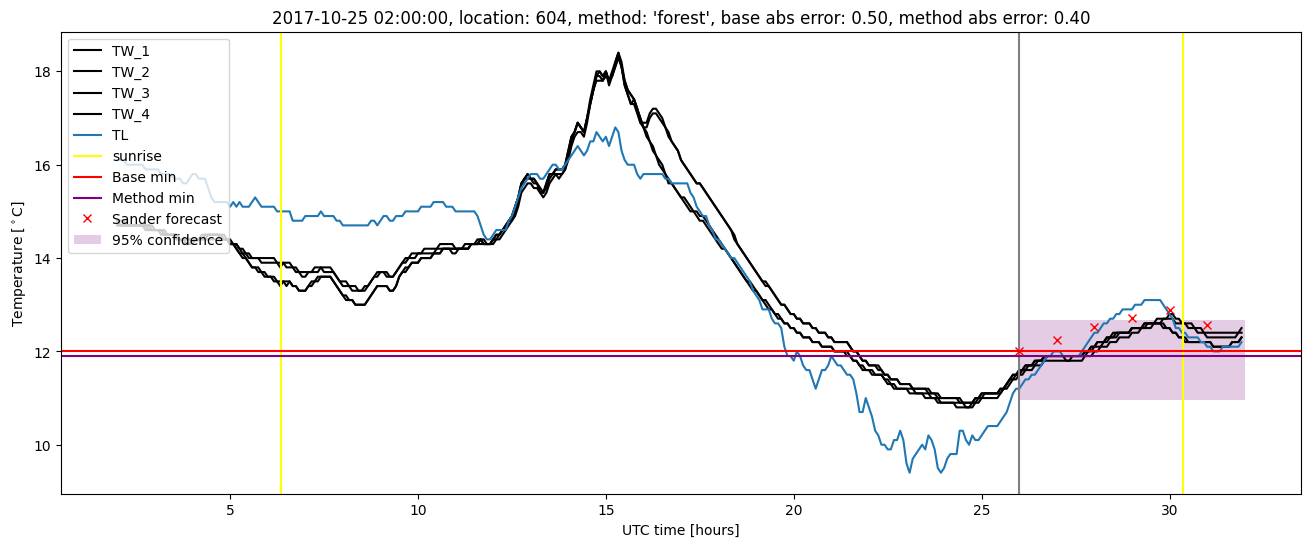
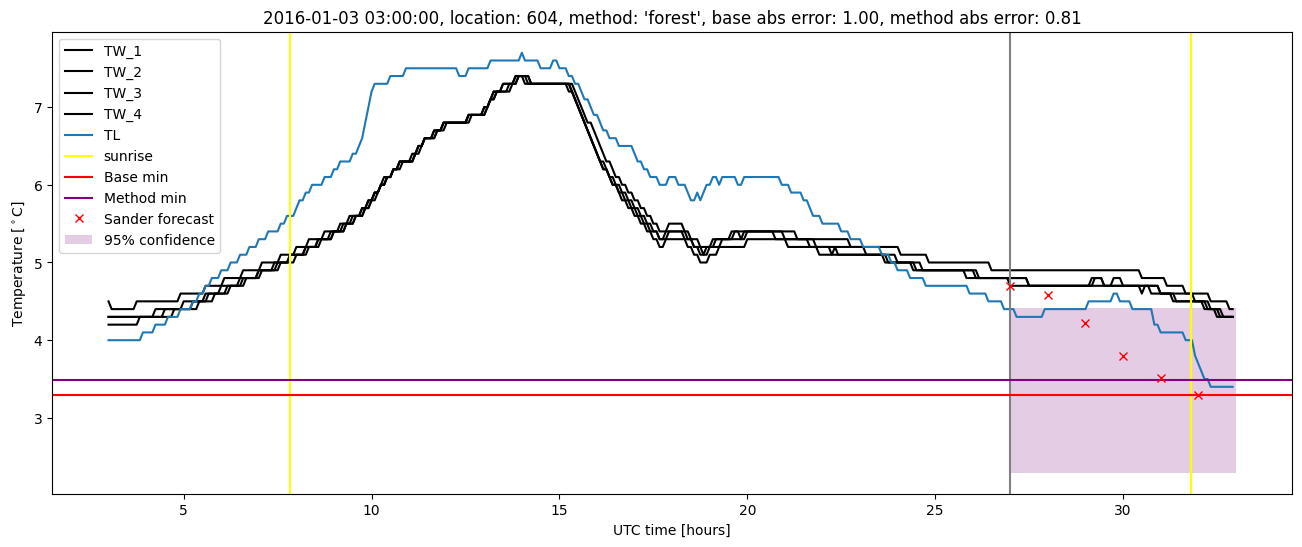
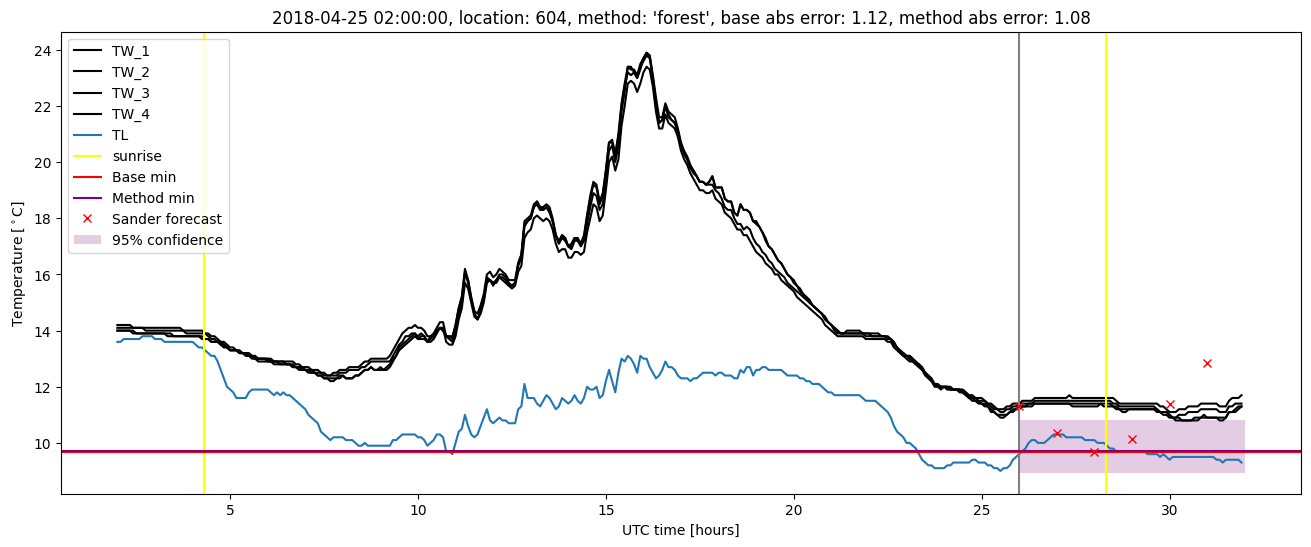
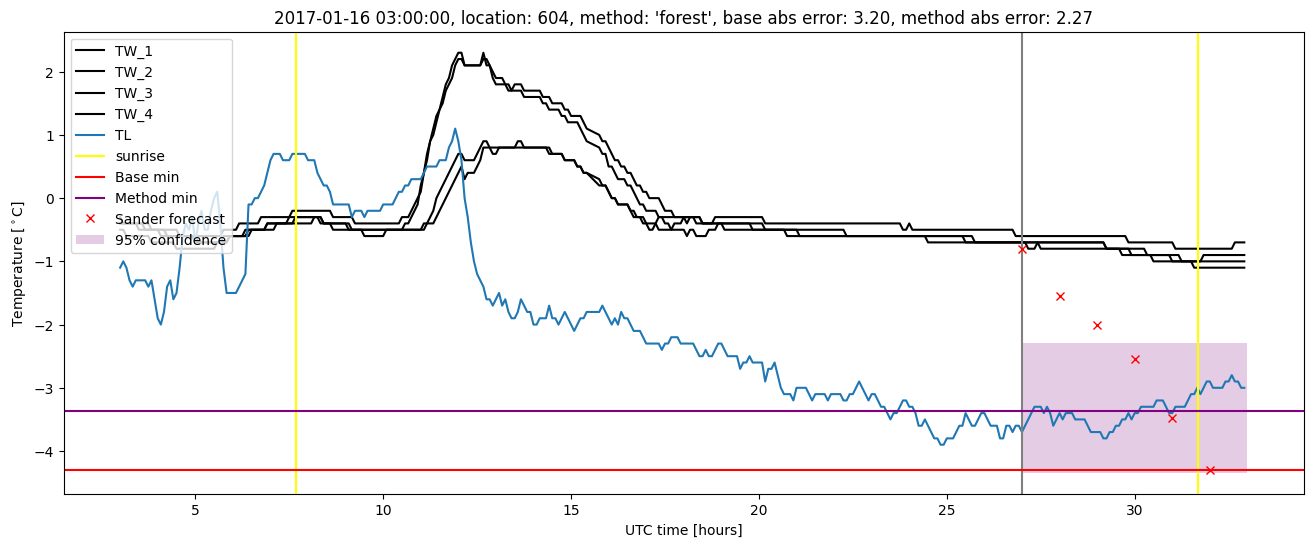
Random forest plots

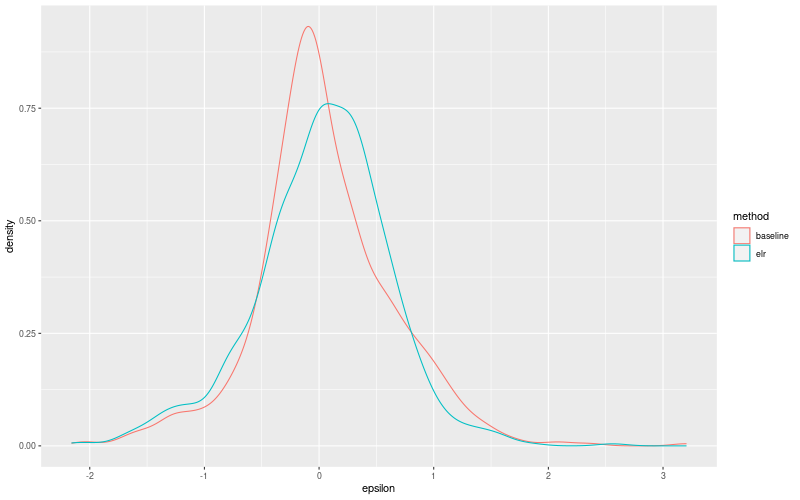
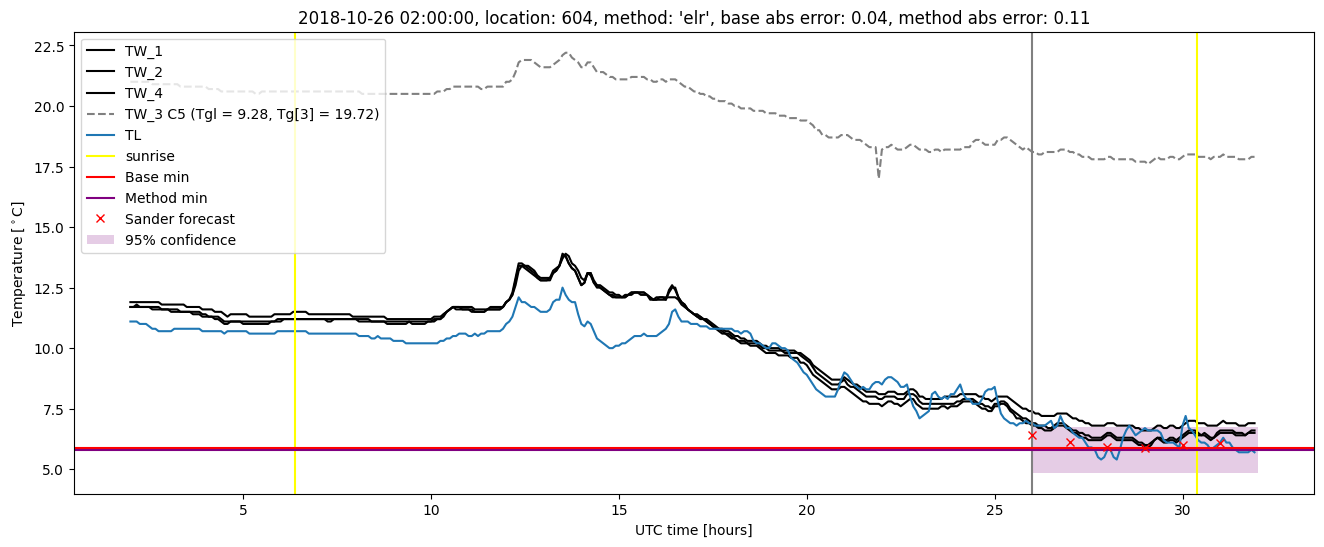
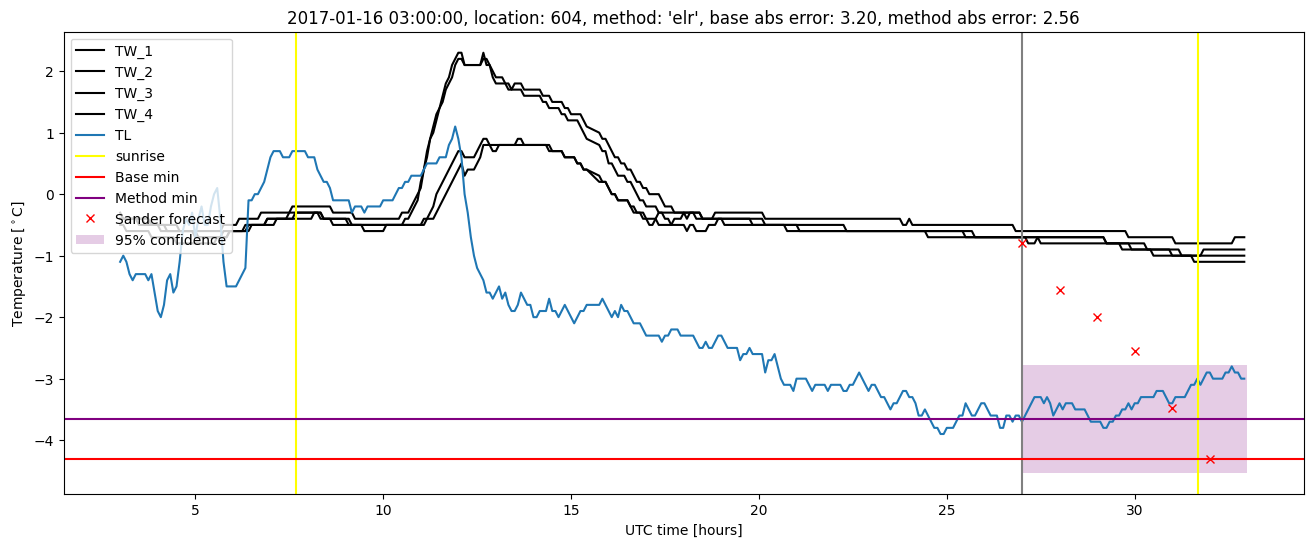
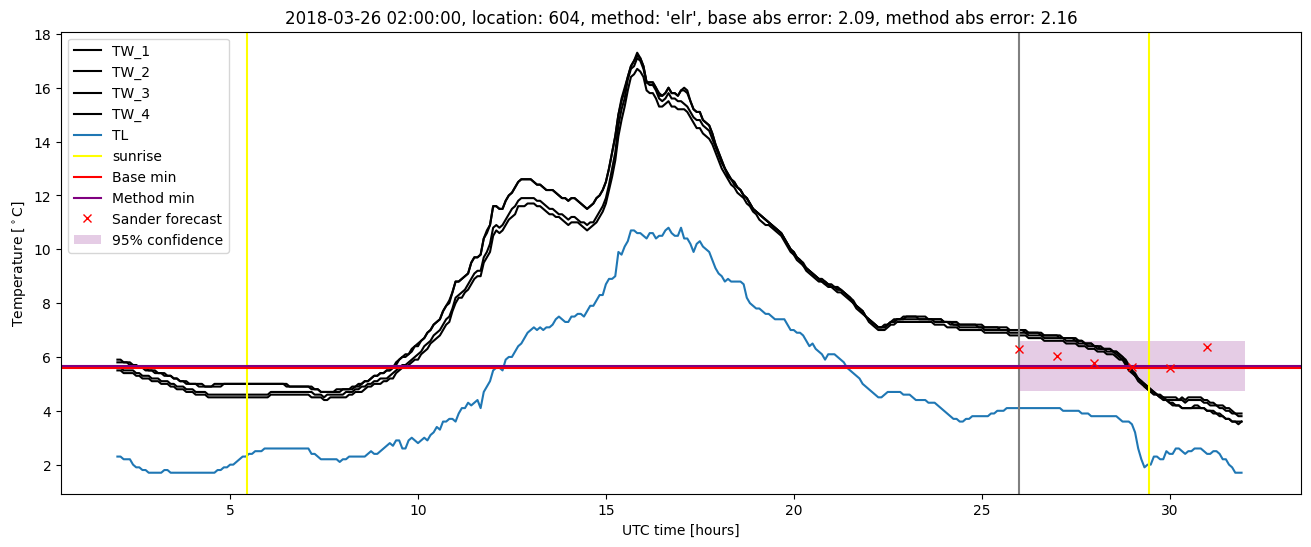
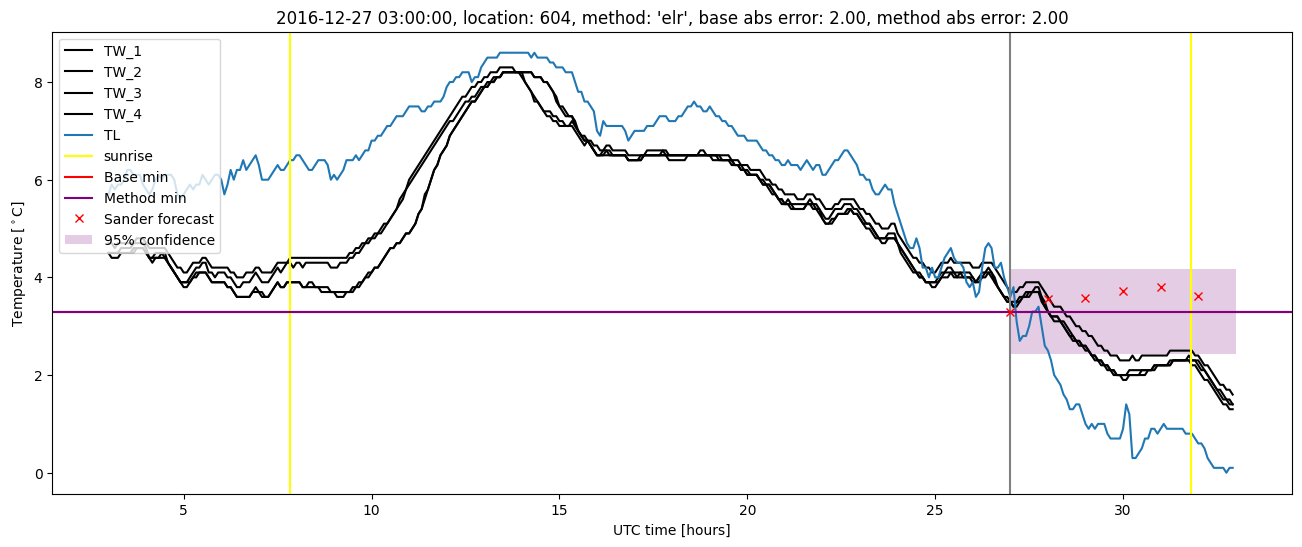
Extended logistic regression results
| names |
period |
power |
significance |
meanSquareError |
absError |
maxError |
CRPS |
IGN |
| baseline |
winter 2016 |
0.995 |
0.045 |
0.325 |
0.432 |
1.708 |
NaN |
NaN |
| elr |
winter 2016 |
0.995 |
0.045 |
0.307 |
0.426 |
1.706 |
0.543 |
3.790 |
| baseline |
winter 2017 |
0.950 |
0.000e+00 |
0.545 |
0.526 |
3.201 |
NaN |
NaN |
| elr |
winter 2017 |
0.959 |
0.062 |
0.441 |
0.478 |
2.560 |
0.476 |
3.402 |
| baseline |
winter 2018 |
0.987 |
0.032 |
0.362 |
0.446 |
2.368 |
NaN |
NaN |
| elr |
winter 2018 |
0.980 |
0.097 |
0.328 |
0.449 |
2.156 |
0.530 |
3.380 |
| baseline |
winter 2019 |
0.993 |
0.000e+00 |
0.259 |
0.372 |
2.016 |
NaN |
NaN |
| elr |
winter 2019 |
0.993 |
0.000e+00 |
0.319 |
0.443 |
1.713 |
0.496 |
2.930 |
| baseline |
all |
0.984 |
0.021 |
0.367 |
0.442 |
3.201 |
NaN |
NaN |
| elr |
all |
0.984 |
0.062 |
0.344 |
0.447 |
2.560 |
0.514 |
3.402 |
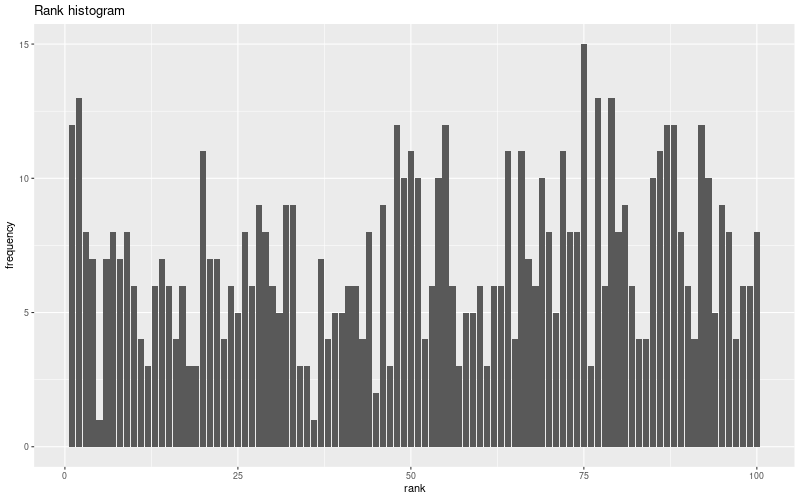
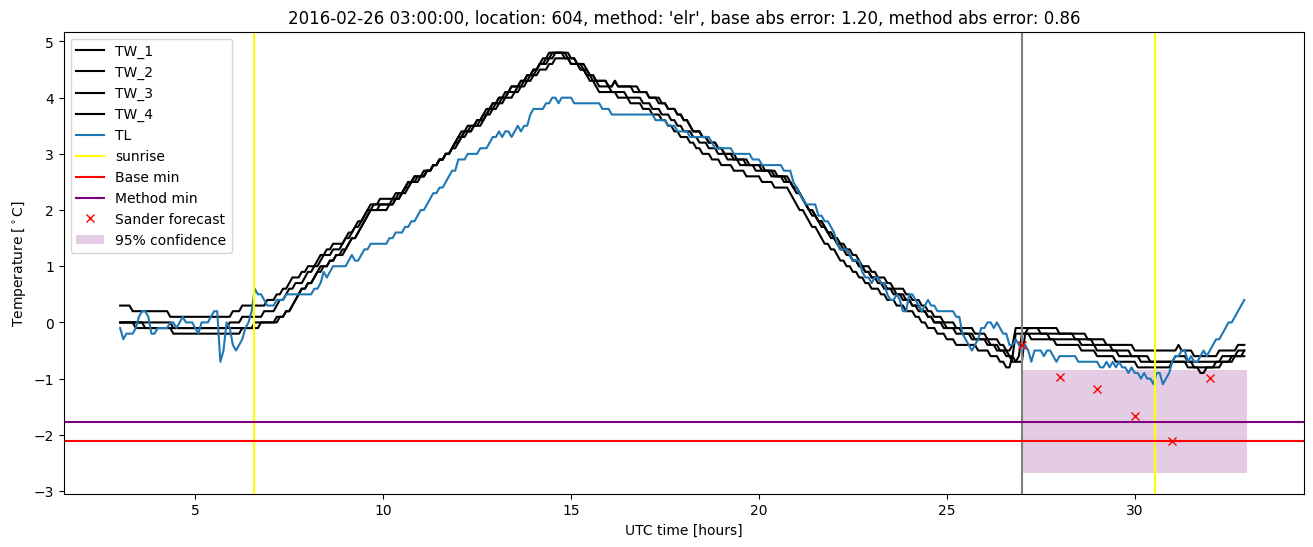
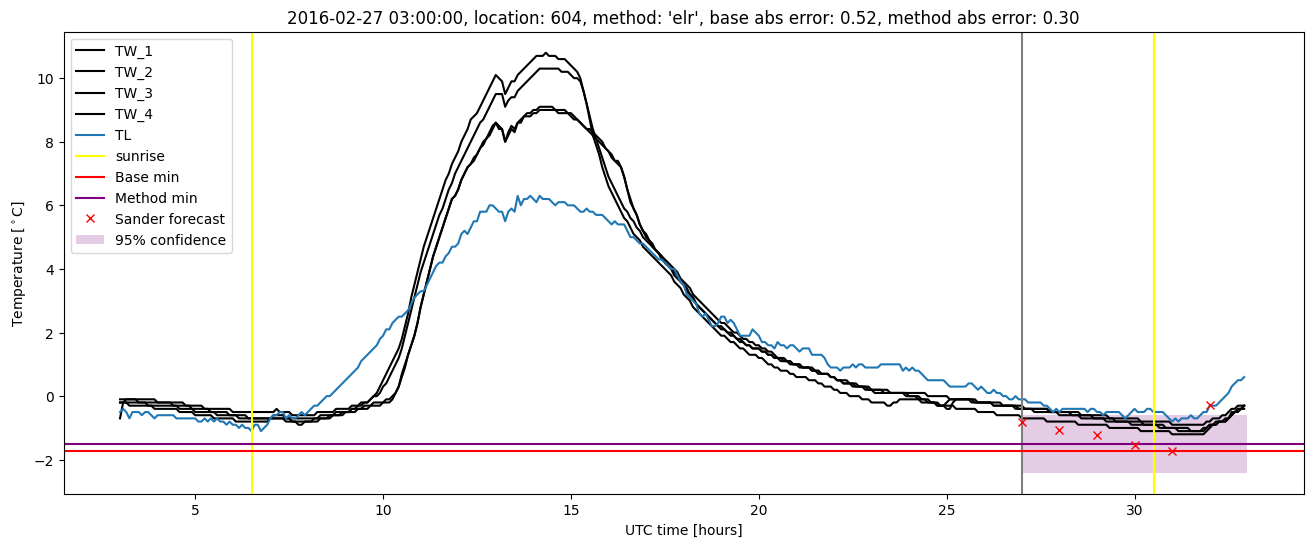
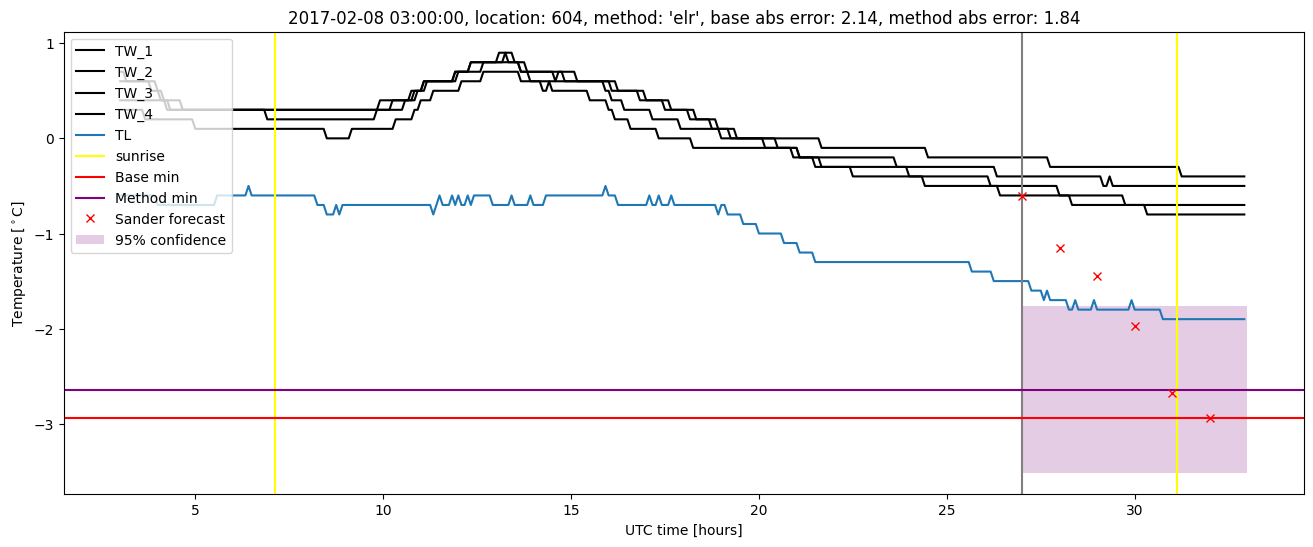
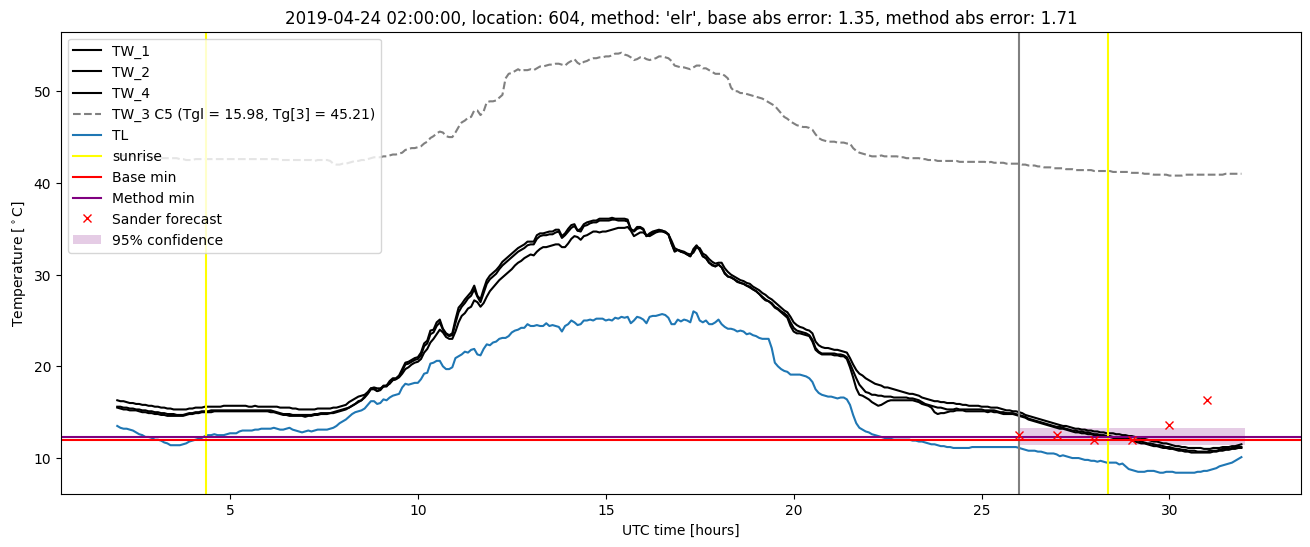
Extended logistic regression plots