GMS location: 603
Random forest results
| names |
period |
power |
significance |
meanSquareError |
absError |
maxError |
CRPS |
IGN |
| baseline |
winter 2016 |
0.995 |
0.000e+00 |
0.311 |
0.425 |
2.102 |
NaN |
NaN |
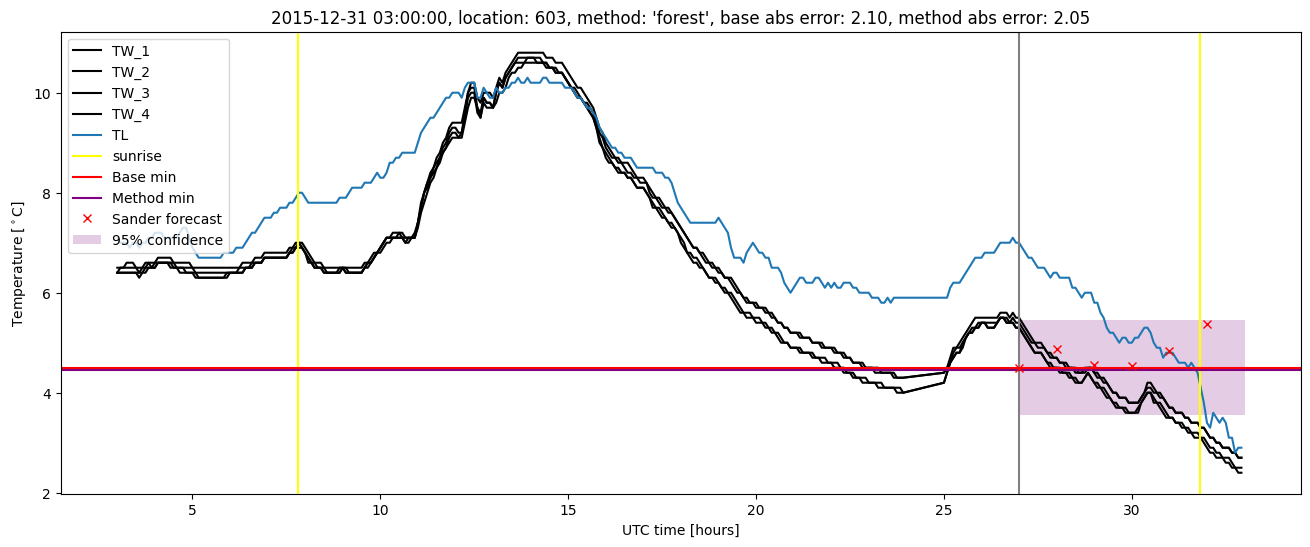
| forest |
winter 2016 |
0.995 |
0.000e+00 |
0.254 |
0.378 |
2.051 |
0.497 |
2.694 |
| baseline |
winter 2017 |
0.964 |
0.081 |
0.474 |
0.497 |
2.771 |
NaN |
NaN |
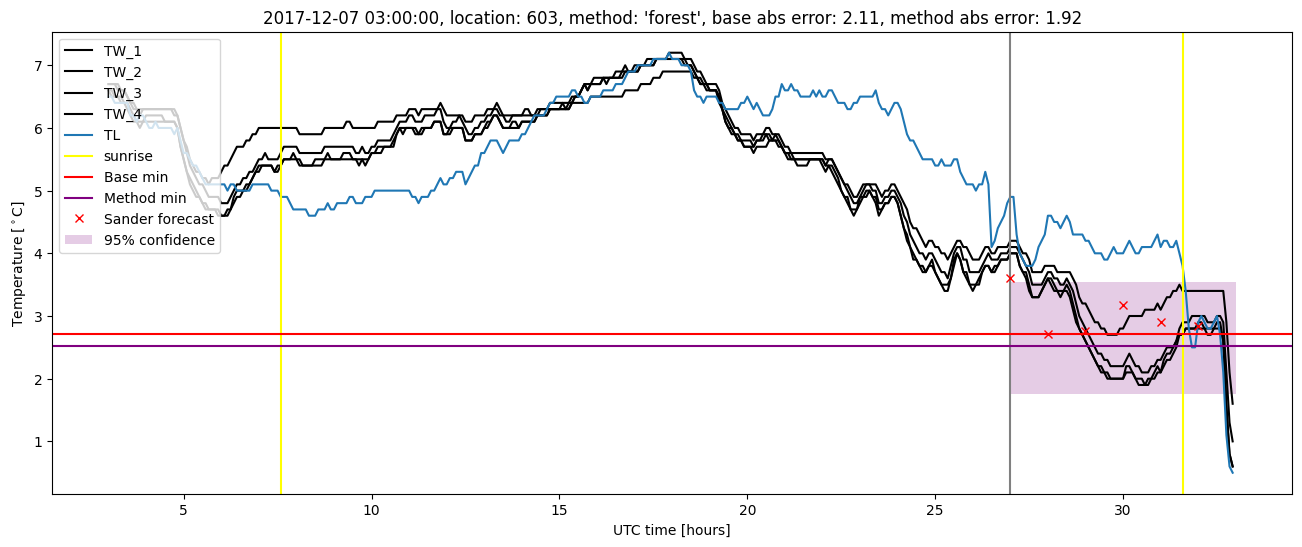
| forest |
winter 2017 |
0.955 |
0.108 |
0.374 |
0.442 |
2.040 |
0.480 |
3.281 |
| baseline |
winter 2018 |
0.993 |
0.100 |
0.396 |
0.456 |
2.243 |
NaN |
NaN |
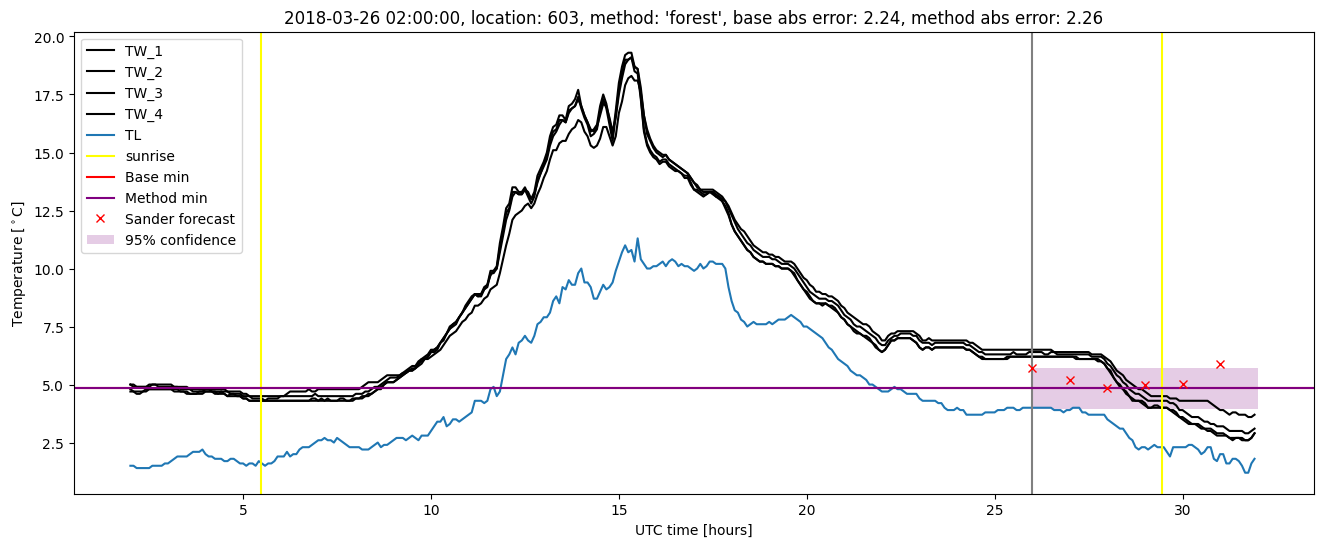
| forest |
winter 2018 |
0.993 |
0.133 |
0.322 |
0.422 |
2.263 |
0.504 |
2.813 |
| baseline |
winter 2019 |
0.993 |
0.000e+00 |
0.364 |
0.444 |
2.491 |
NaN |
NaN |
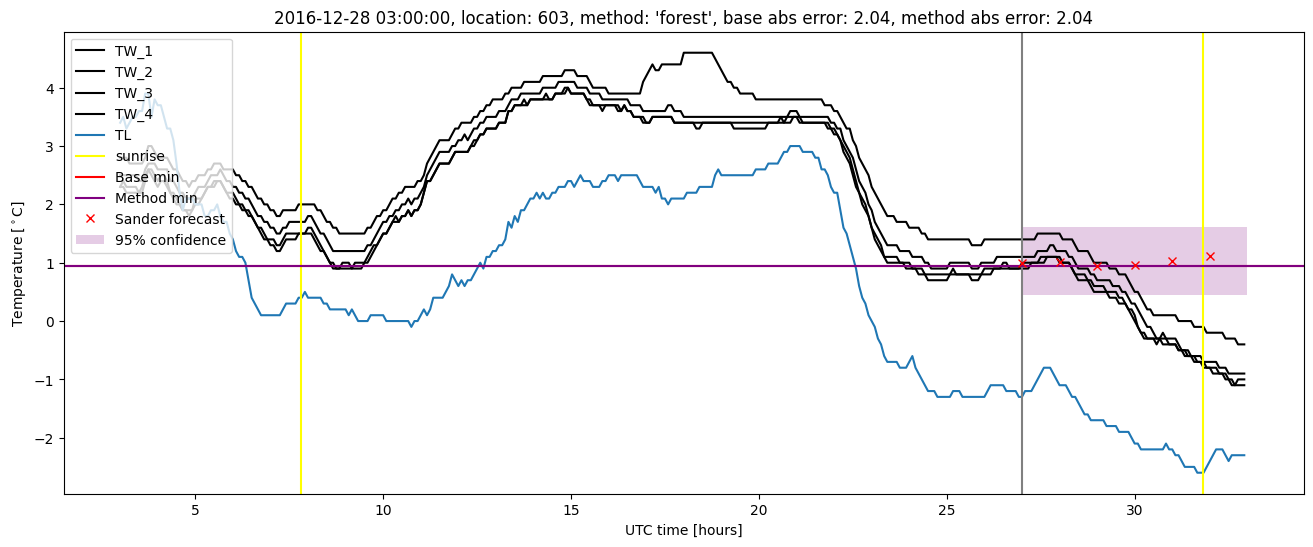
| forest |
winter 2019 |
1.000 |
0.000e+00 |
0.311 |
0.395 |
2.803 |
0.486 |
3.141 |
| baseline |
all |
0.988 |
0.060 |
0.380 |
0.453 |
2.771 |
NaN |
NaN |
| forest |
all |
0.988 |
0.080 |
0.310 |
0.407 |
2.803 |
0.493 |
2.957 |
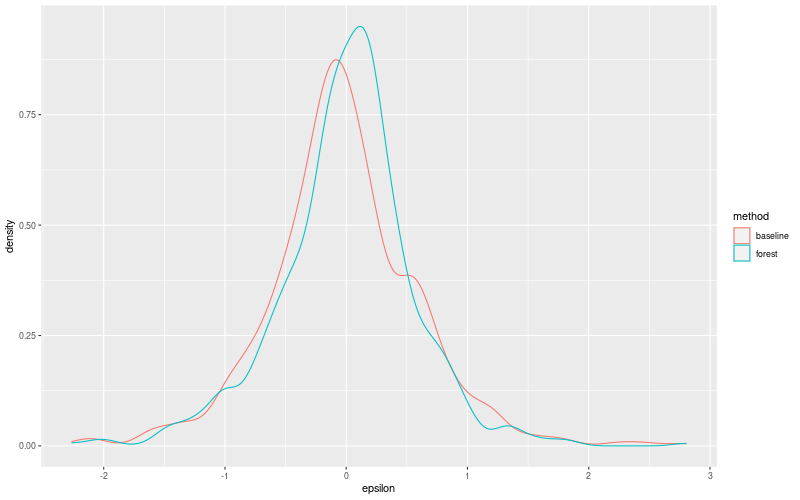
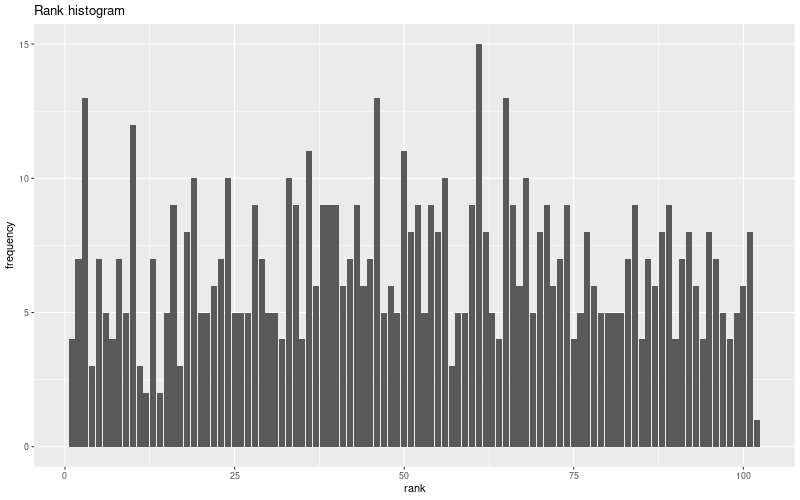
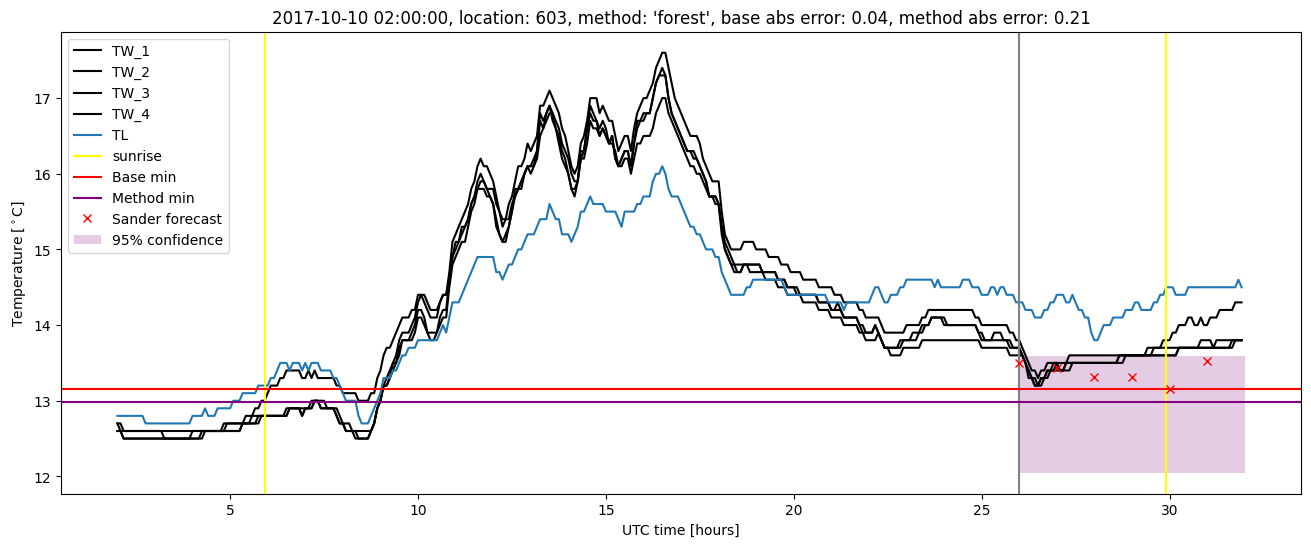
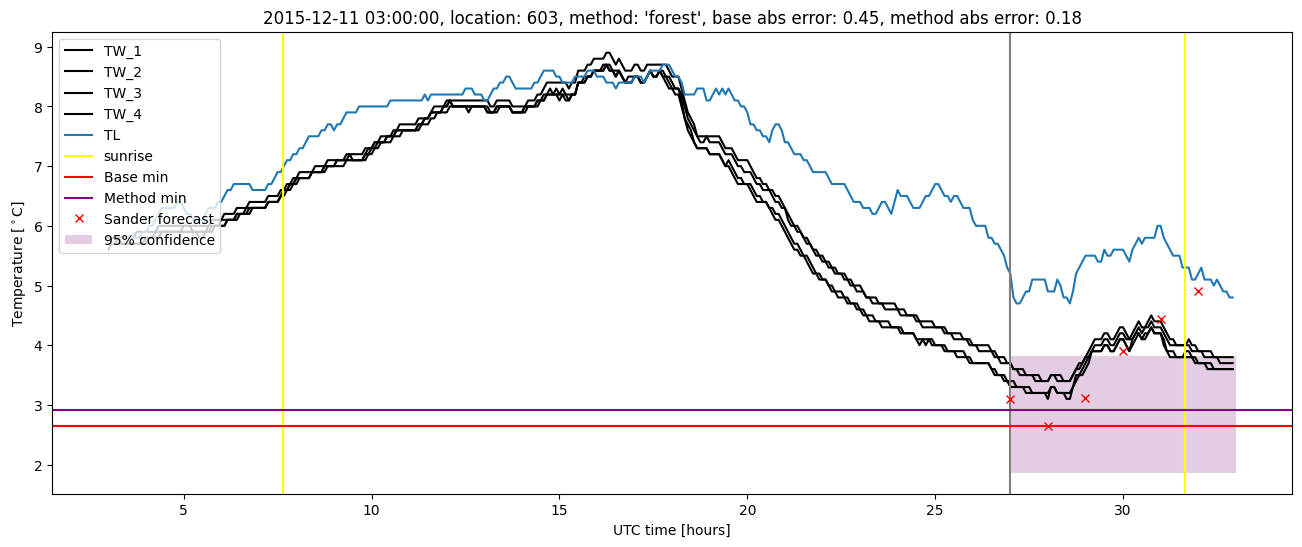
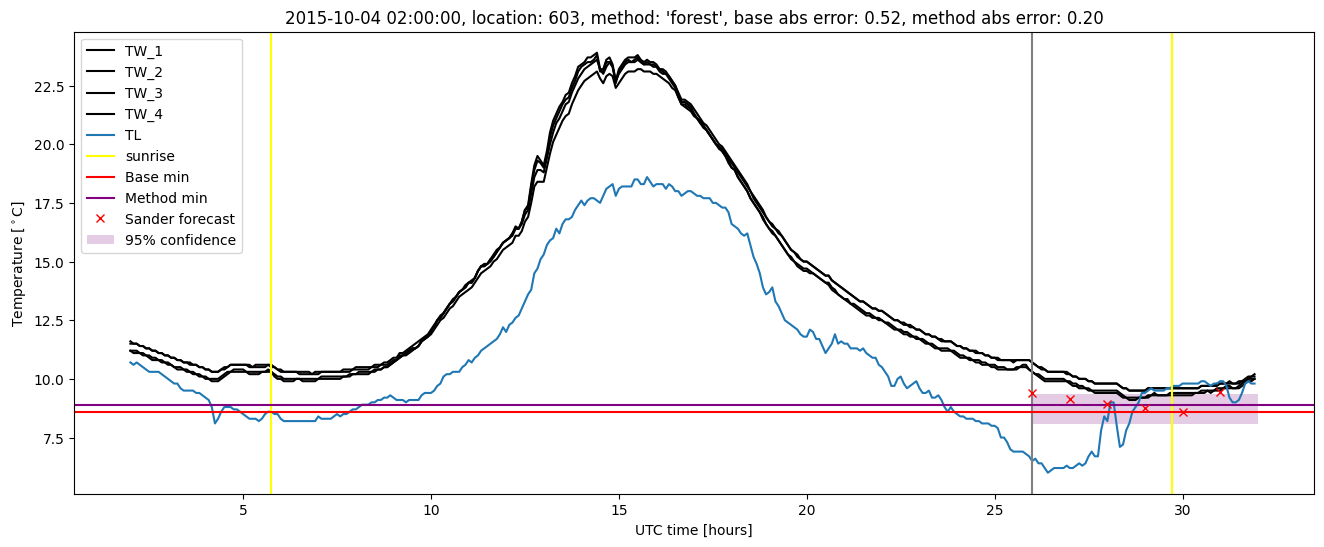
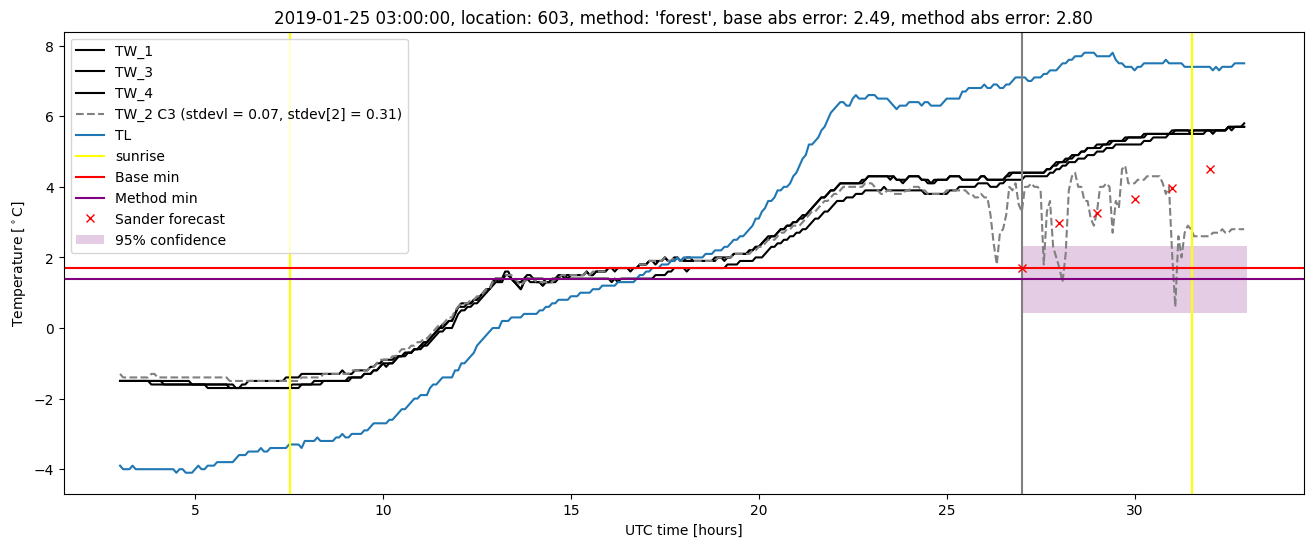
Random forest plots
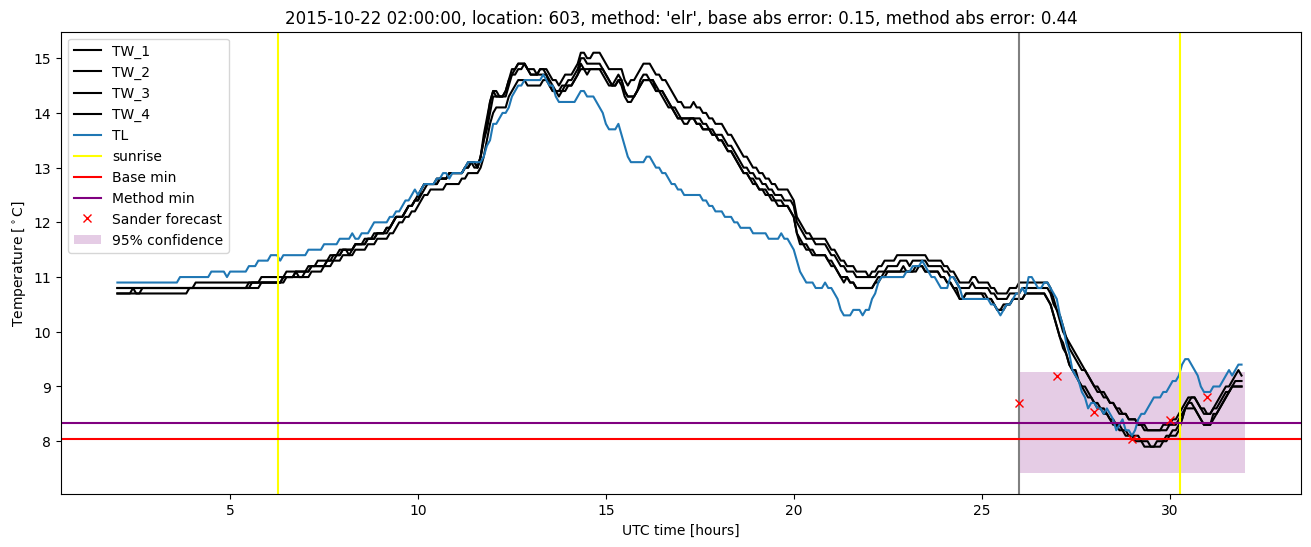
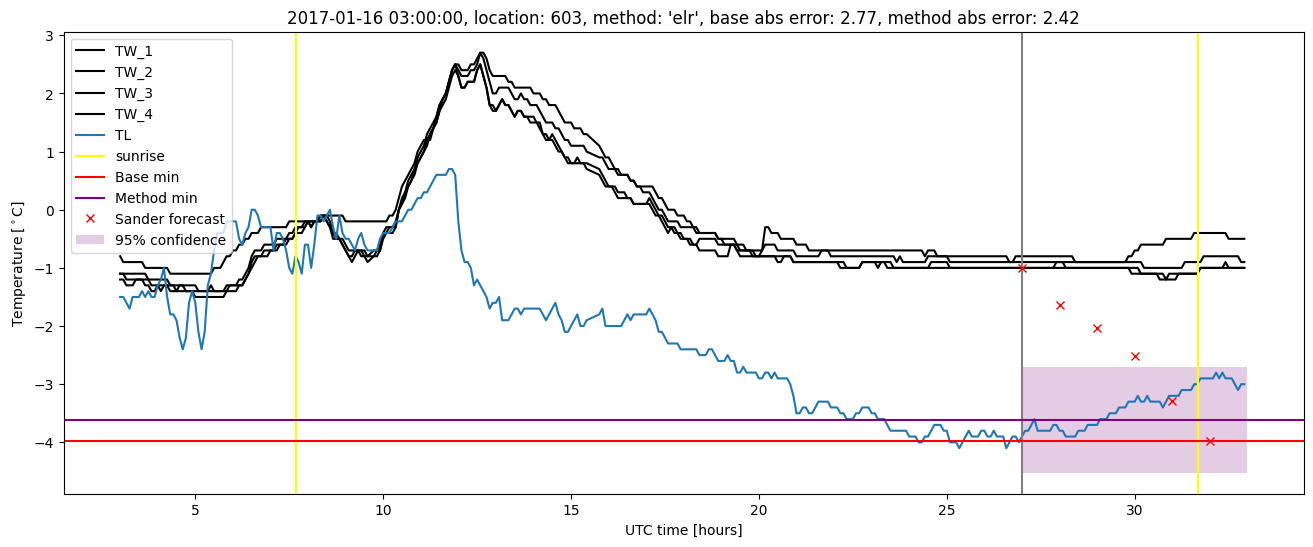
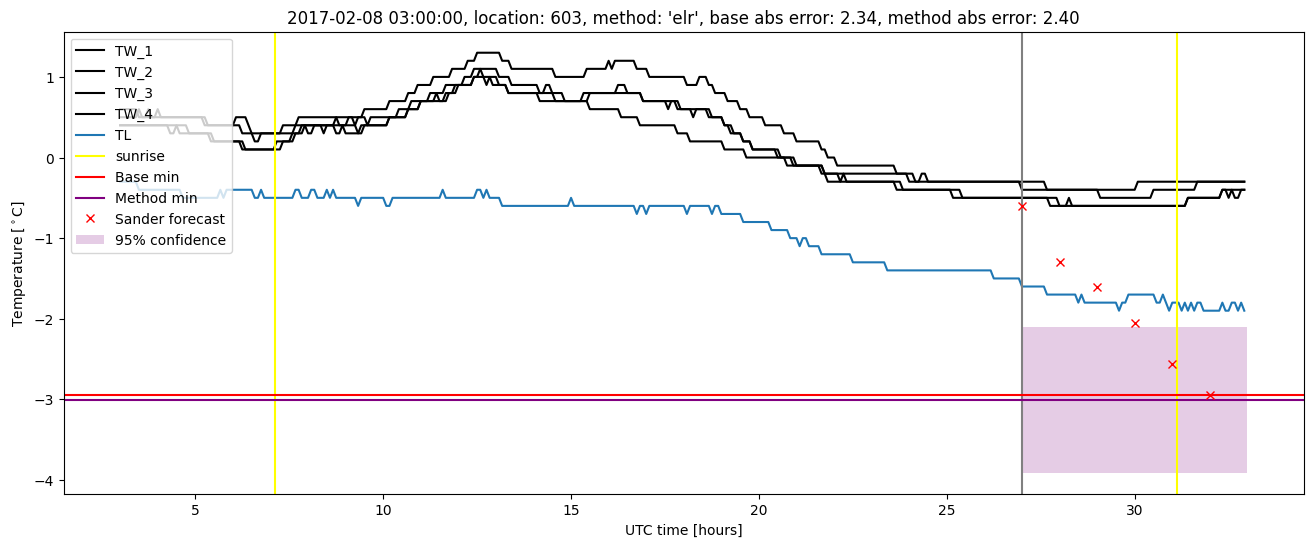
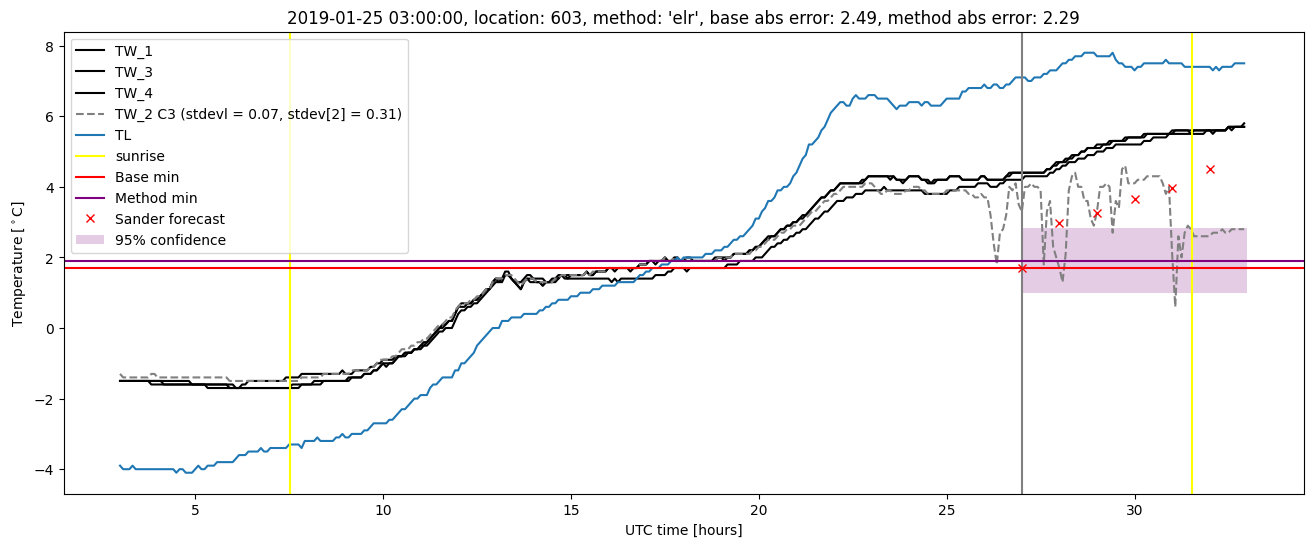
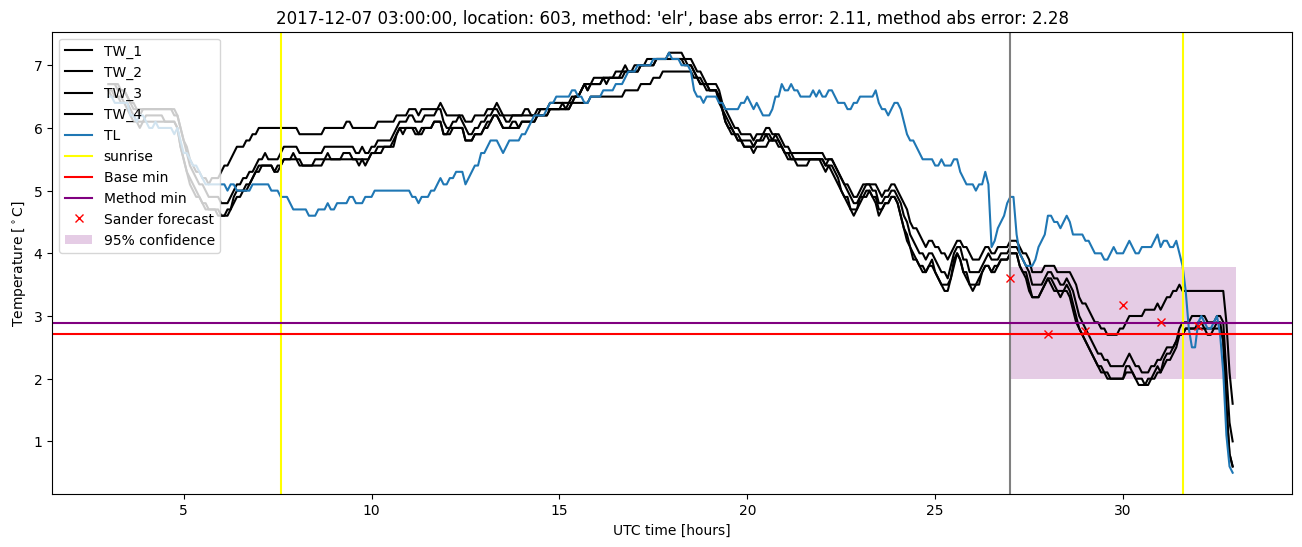
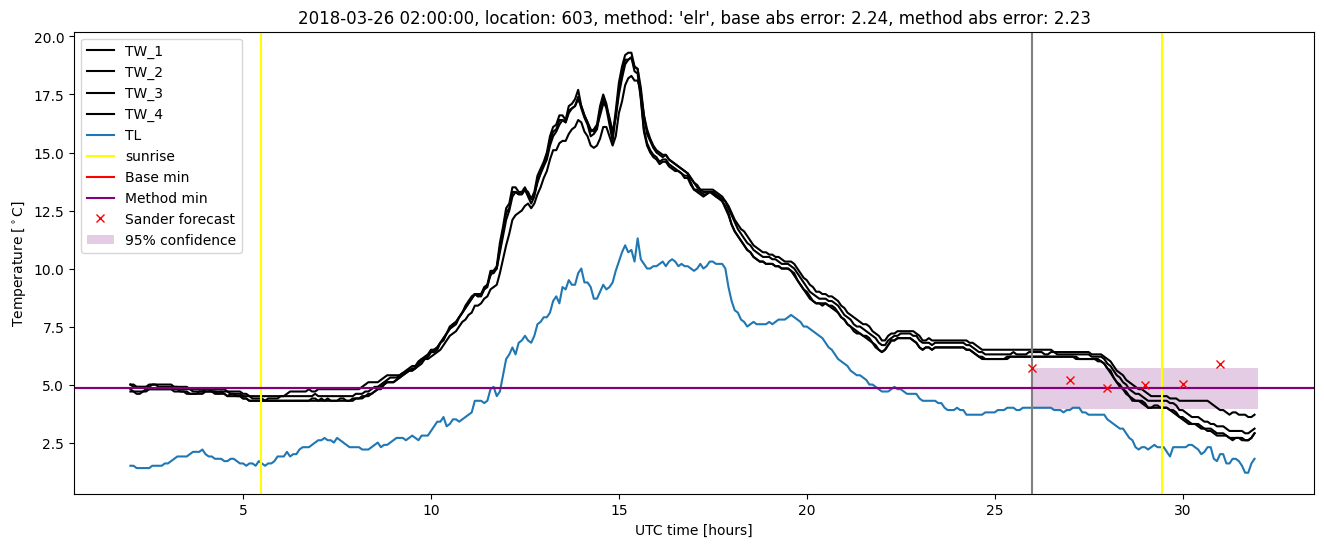
Extended logistic regression results
| names |
period |
power |
significance |
meanSquareError |
absError |
maxError |
CRPS |
IGN |
| baseline |
winter 2016 |
0.995 |
0.000e+00 |
0.311 |
0.425 |
2.102 |
NaN |
NaN |
| elr |
winter 2016 |
0.989 |
0.000e+00 |
0.295 |
0.424 |
1.960 |
0.563 |
4.005 |
| baseline |
winter 2017 |
0.964 |
0.081 |
0.474 |
0.497 |
2.771 |
NaN |
NaN |
| elr |
winter 2017 |
0.964 |
0.108 |
0.419 |
0.460 |
2.421 |
0.489 |
3.231 |
| baseline |
winter 2018 |
0.993 |
0.100 |
0.396 |
0.456 |
2.243 |
NaN |
NaN |
| elr |
winter 2018 |
0.993 |
0.100 |
0.352 |
0.448 |
2.282 |
0.555 |
4.255 |
| baseline |
winter 2019 |
0.993 |
0.000e+00 |
0.364 |
0.444 |
2.491 |
NaN |
NaN |
| elr |
winter 2019 |
0.993 |
0.000e+00 |
0.351 |
0.460 |
2.290 |
0.497 |
3.014 |
| baseline |
all |
0.988 |
0.060 |
0.380 |
0.453 |
2.771 |
NaN |
NaN |
| elr |
all |
0.986 |
0.070 |
0.350 |
0.446 |
2.421 |
0.529 |
3.666 |
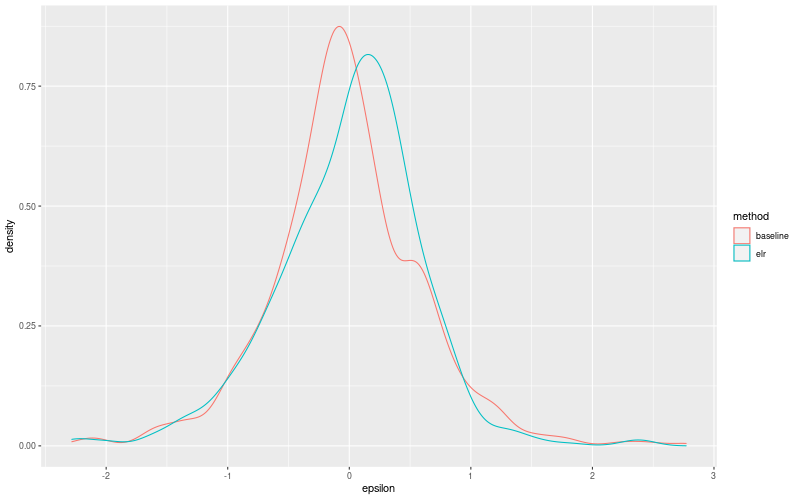
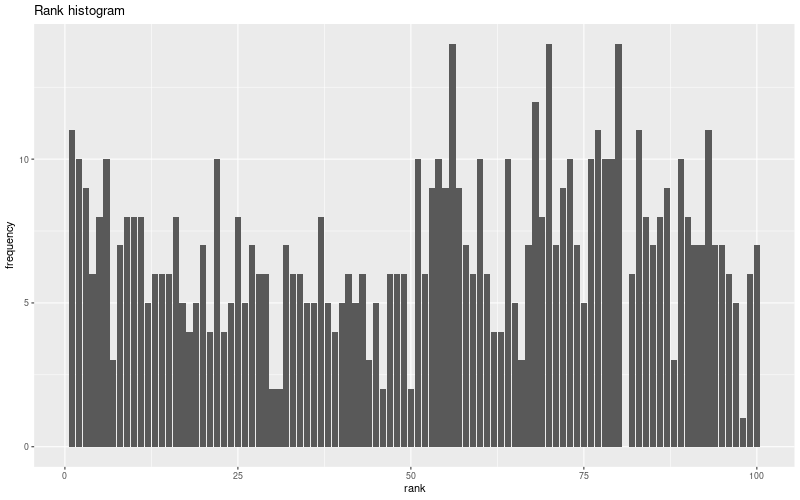
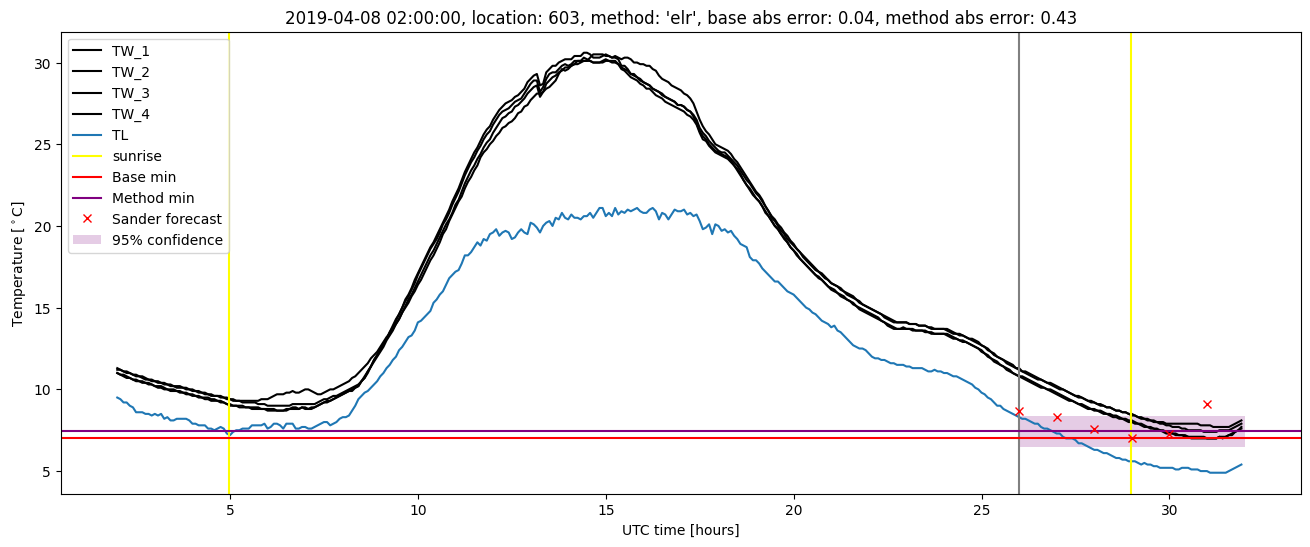
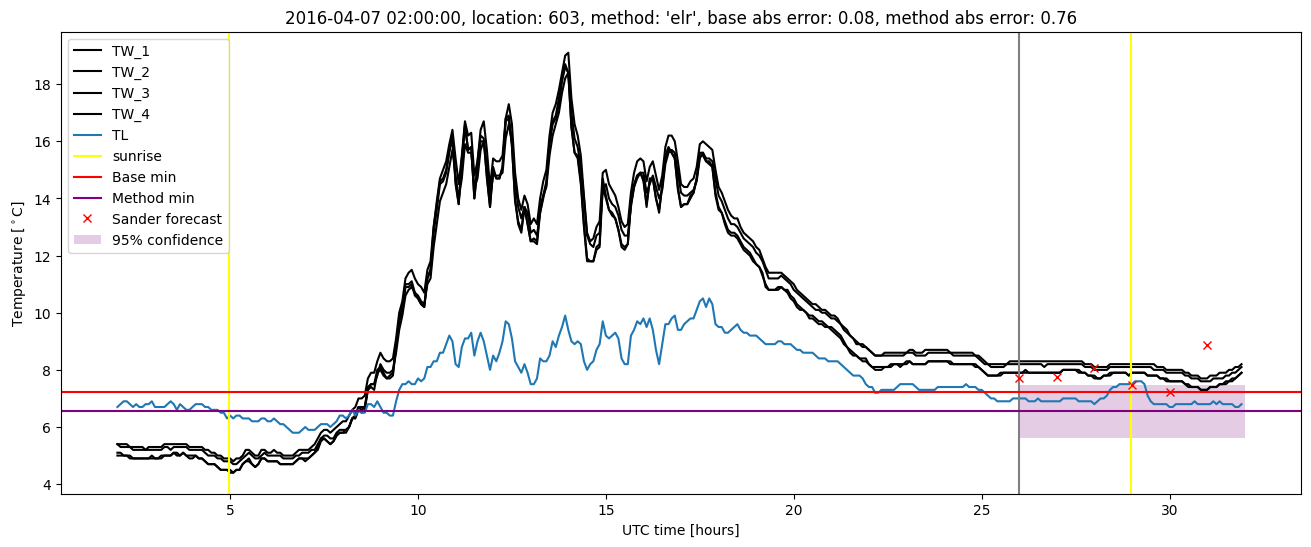
Extended logistic regression plots