GMS location: 571
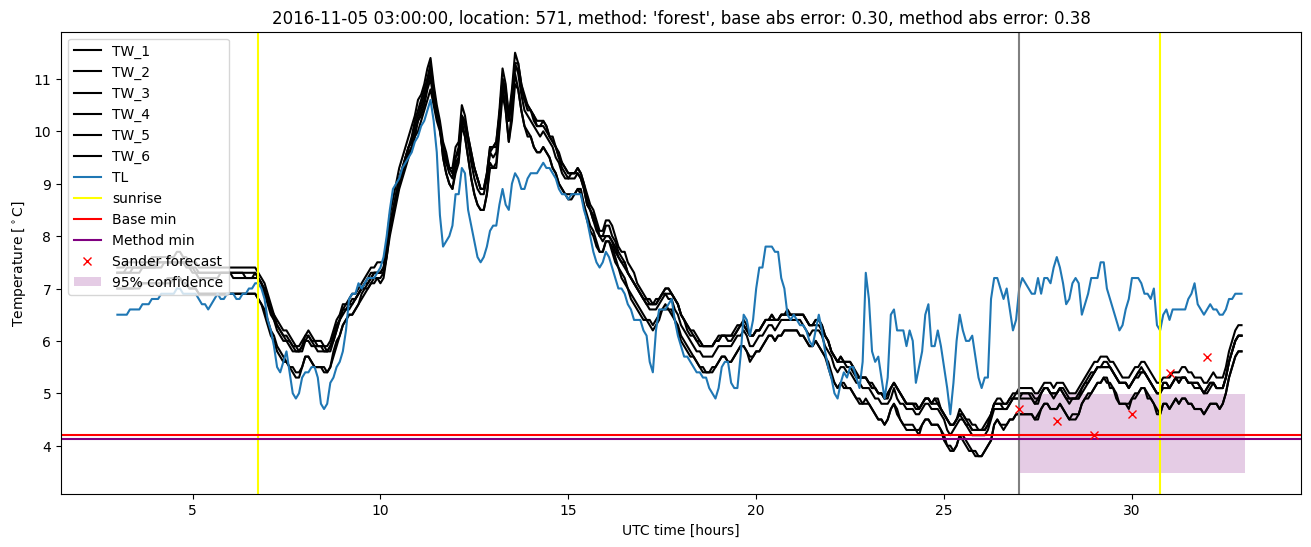
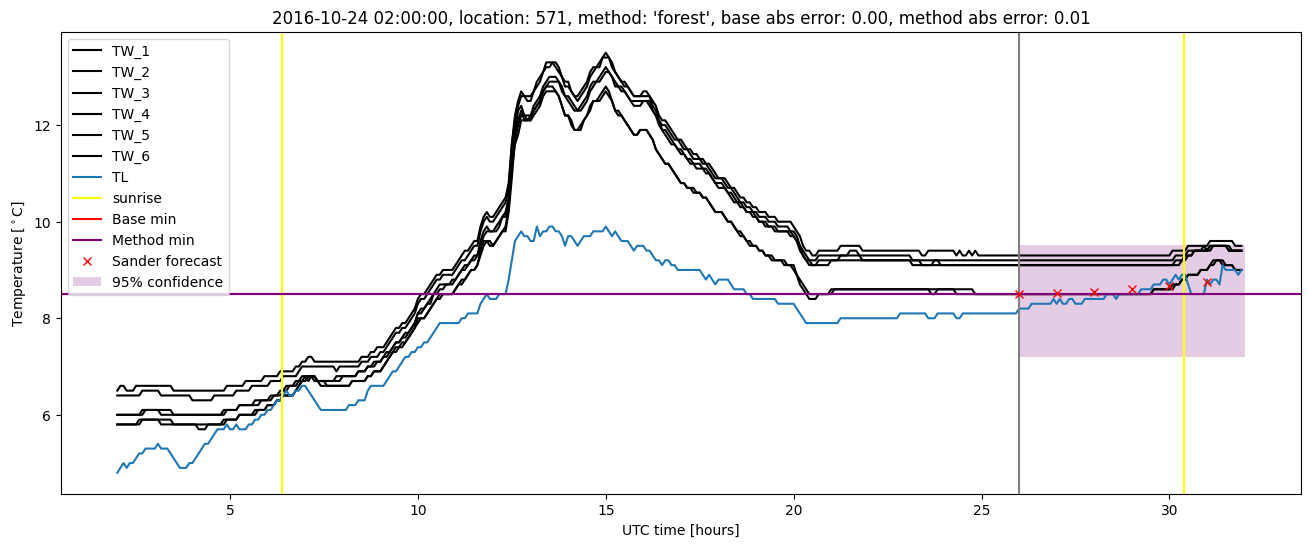
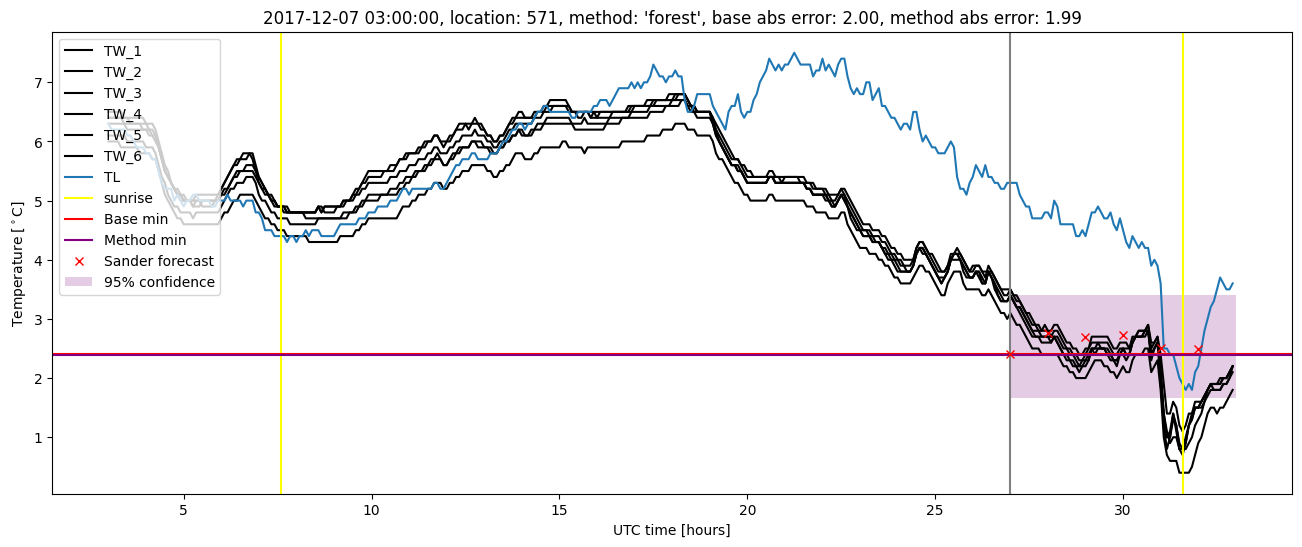
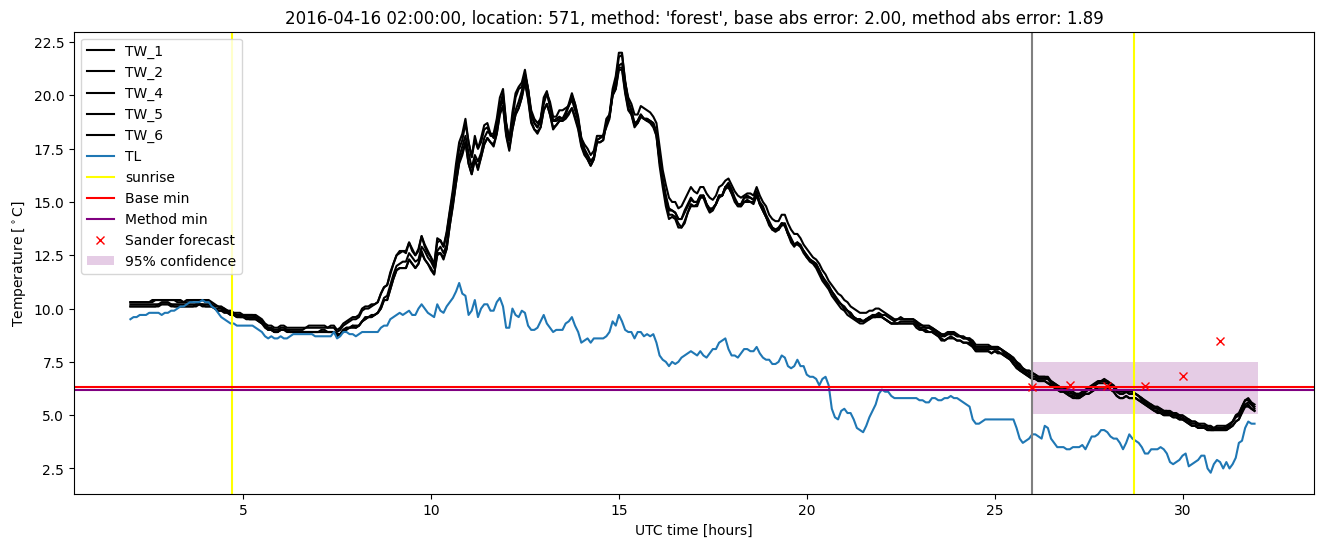
Random forest results
| names |
period |
power |
significance |
meanSquareError |
absError |
maxError |
CRPS |
IGN |
| baseline |
winter 2016 |
0.984 |
0.200 |
0.319 |
0.425 |
1.998 |
NaN |
NaN |
| forest |
winter 2016 |
0.984 |
0.200 |
0.287 |
0.412 |
1.895 |
0.514 |
4.722 |
| baseline |
winter 2017 |
0.974 |
0.029 |
0.400 |
0.473 |
2.069 |
NaN |
NaN |
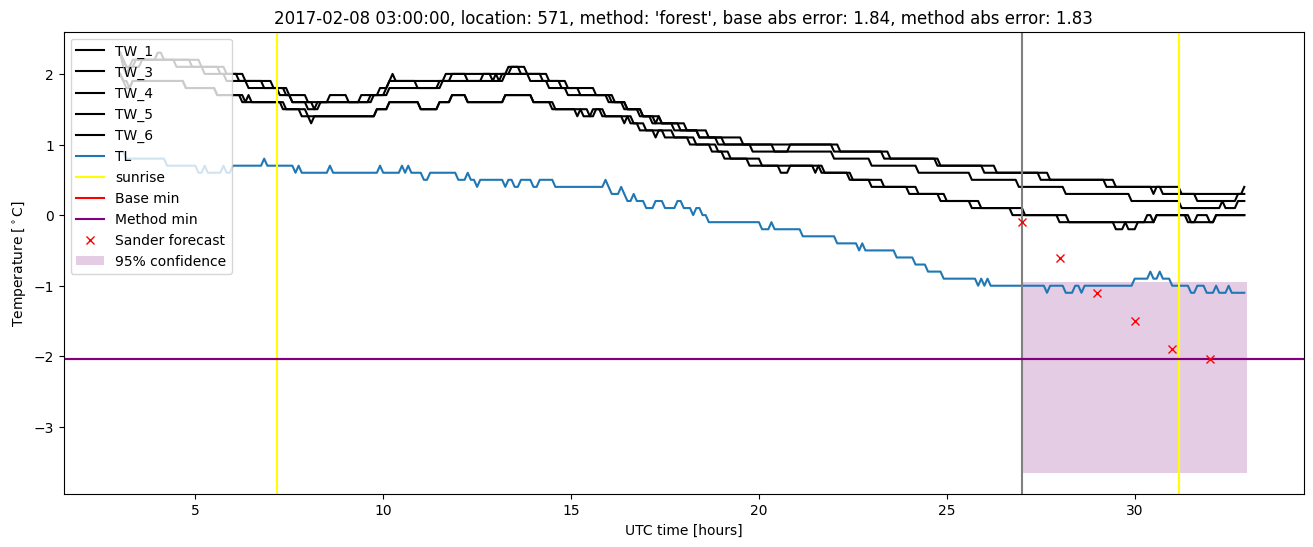
| forest |
winter 2017 |
0.966 |
0.057 |
0.329 |
0.428 |
1.834 |
0.492 |
4.398 |
| baseline |
winter 2018 |
0.993 |
0.029 |
0.341 |
0.437 |
2.002 |
NaN |
NaN |
| forest |
winter 2018 |
0.993 |
0.088 |
0.284 |
0.396 |
1.991 |
0.507 |
3.130 |
| baseline |
winter 2019 |
0.991 |
0.000e+00 |
0.268 |
0.392 |
1.527 |
NaN |
NaN |
| forest |
winter 2019 |
0.983 |
0.000e+00 |
0.242 |
0.372 |
1.512 |
0.497 |
3.133 |
| baseline |
all |
0.986 |
0.037 |
0.336 |
0.434 |
2.069 |
NaN |
NaN |
| forest |
all |
0.982 |
0.074 |
0.288 |
0.403 |
1.991 |
0.503 |
3.809 |
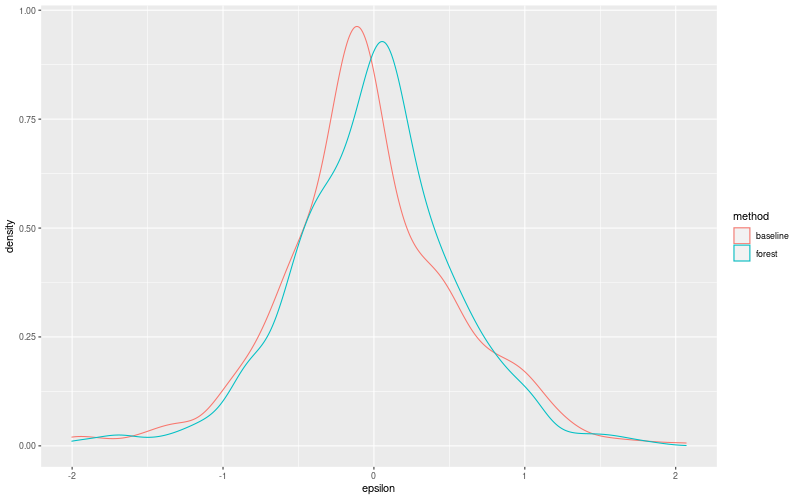
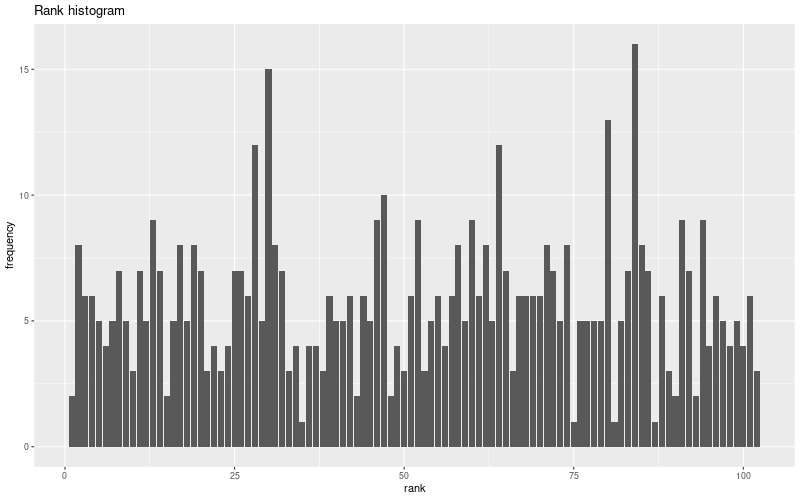
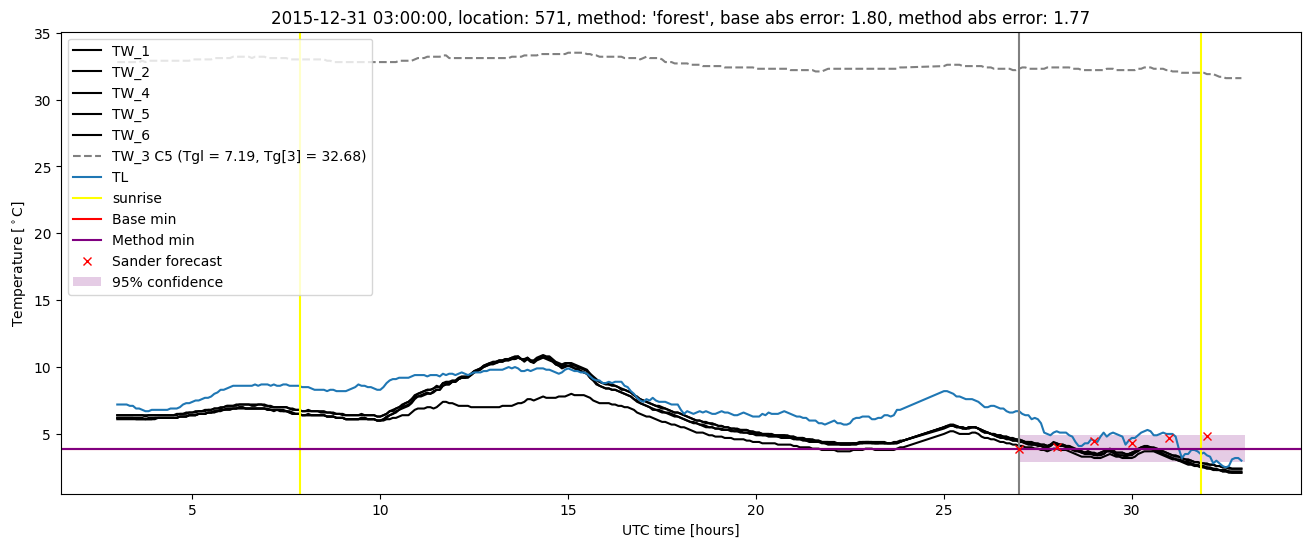
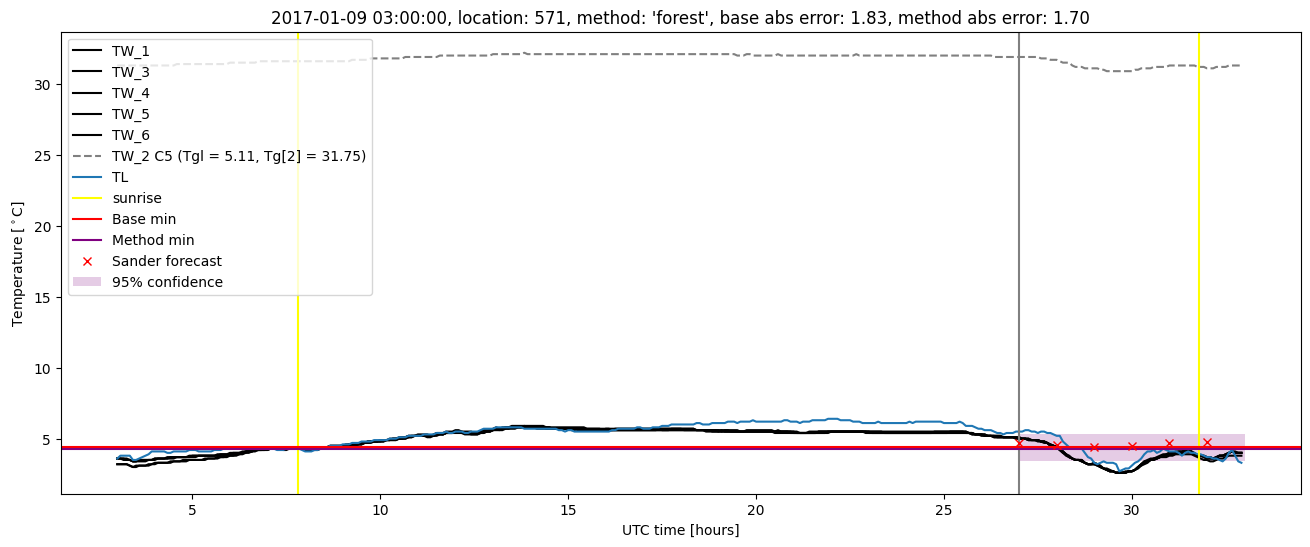
Random forest plots

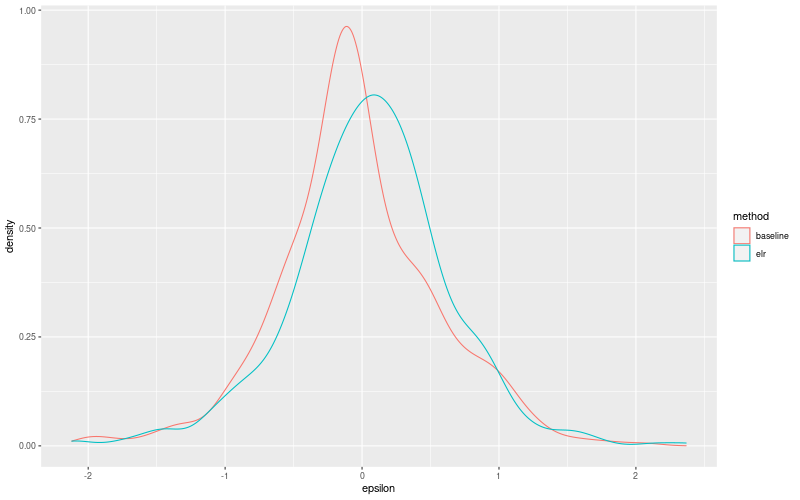
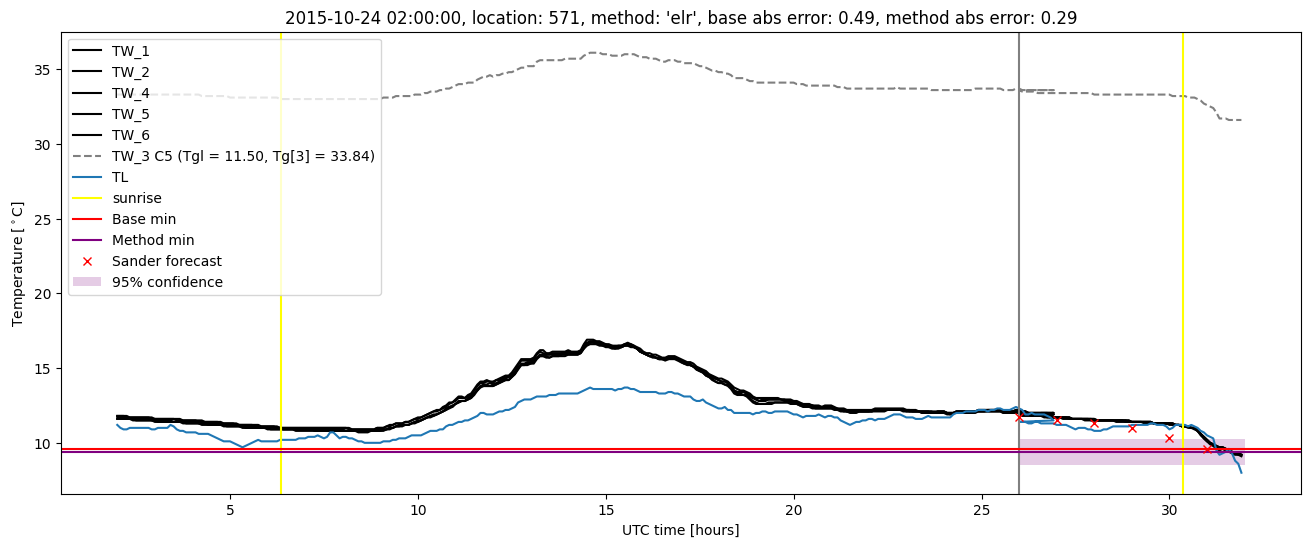
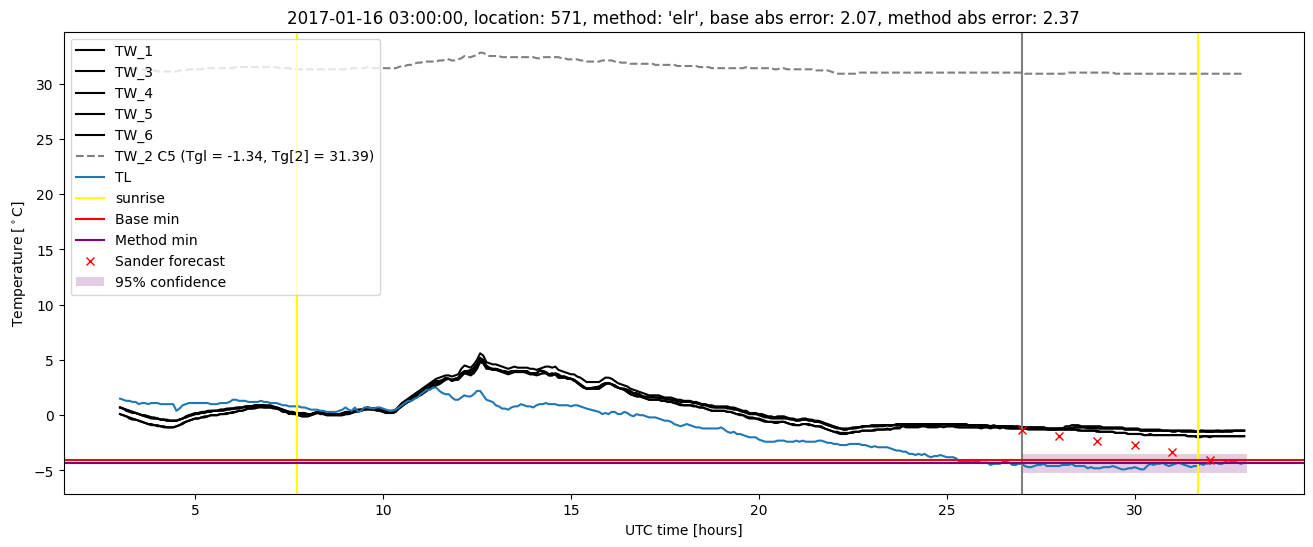
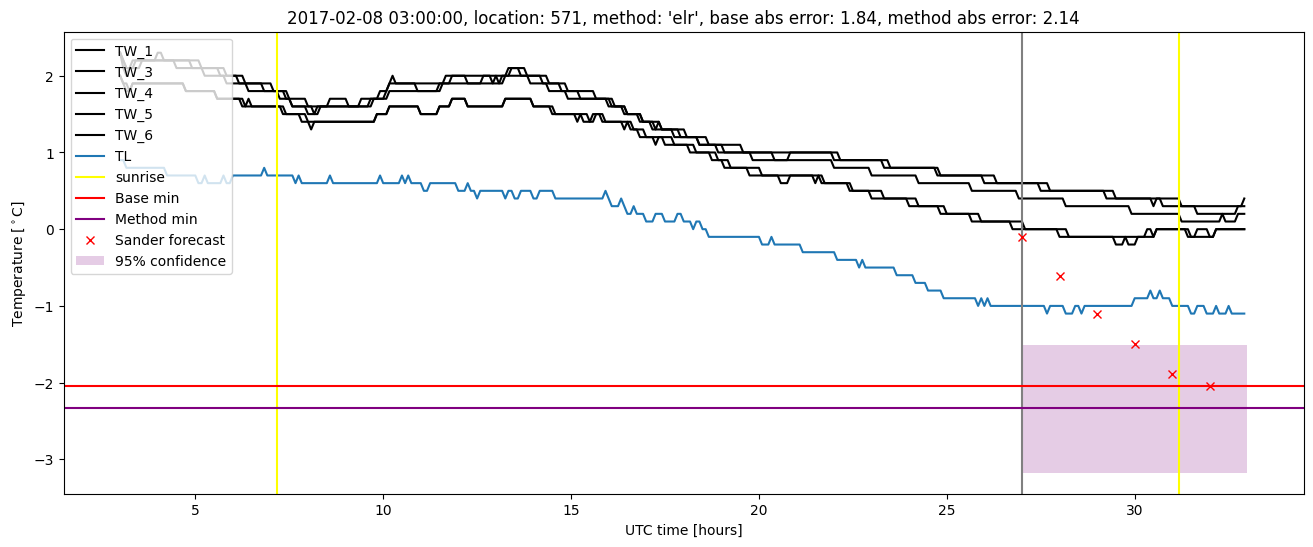
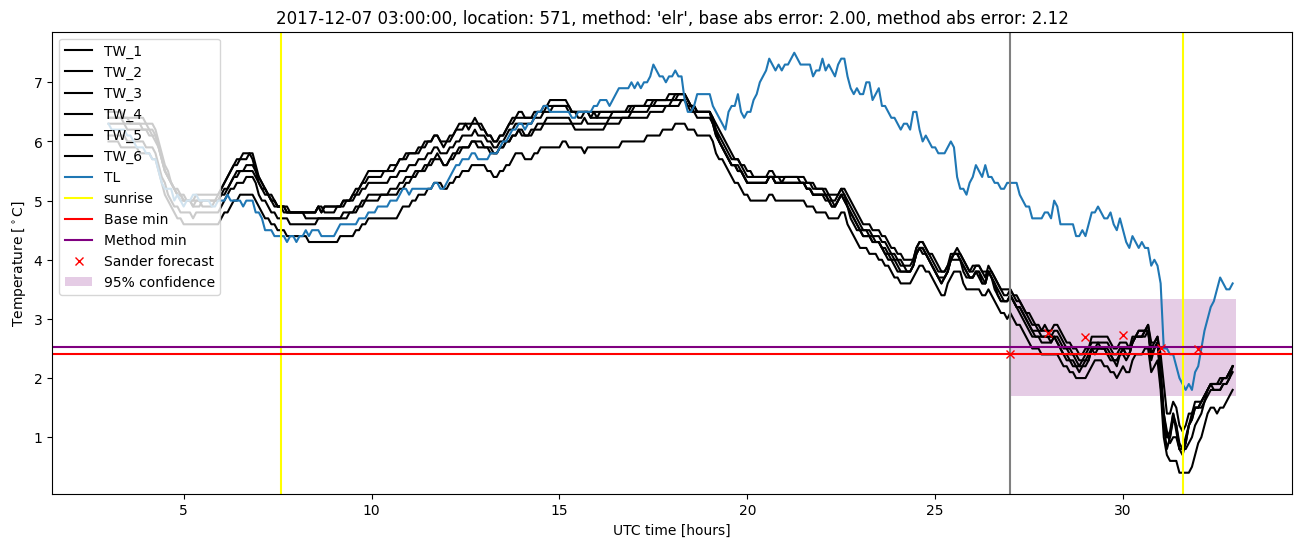
Extended logistic regression results
| names |
period |
power |
significance |
meanSquareError |
absError |
maxError |
CRPS |
IGN |
| baseline |
winter 2016 |
0.984 |
0.200 |
0.319 |
0.425 |
1.998 |
NaN |
NaN |
| elr |
winter 2016 |
0.984 |
0.200 |
0.316 |
0.449 |
1.670 |
0.624 |
5.592 |
| baseline |
winter 2017 |
0.974 |
0.029 |
0.400 |
0.473 |
2.069 |
NaN |
NaN |
| elr |
winter 2017 |
0.957 |
0.057 |
0.397 |
0.472 |
2.367 |
0.566 |
5.670 |
| baseline |
winter 2018 |
0.993 |
0.029 |
0.341 |
0.437 |
2.002 |
NaN |
NaN |
| elr |
winter 2018 |
0.993 |
0.029 |
0.300 |
0.393 |
2.119 |
0.571 |
6.092 |
| baseline |
winter 2019 |
0.991 |
0.000e+00 |
0.268 |
0.392 |
1.527 |
NaN |
NaN |
| elr |
winter 2019 |
0.991 |
0.000e+00 |
0.327 |
0.437 |
1.485 |
0.562 |
4.810 |
| baseline |
all |
0.986 |
0.037 |
0.336 |
0.434 |
2.069 |
NaN |
NaN |
| elr |
all |
0.982 |
0.049 |
0.334 |
0.435 |
2.367 |
0.580 |
5.606 |
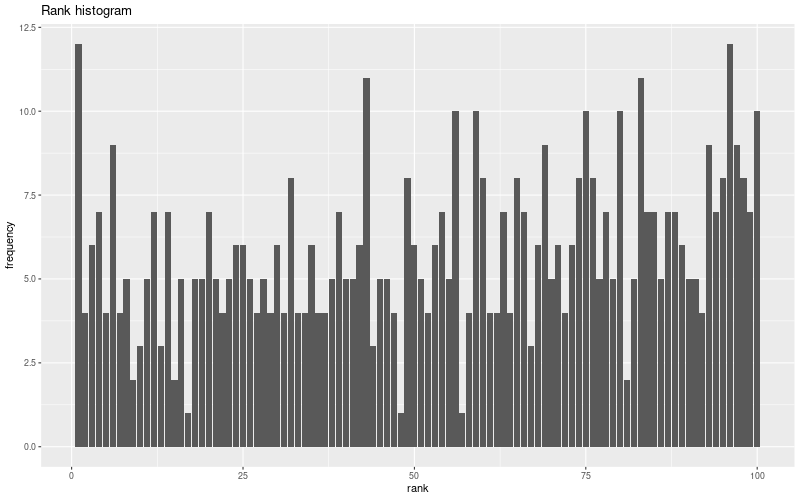
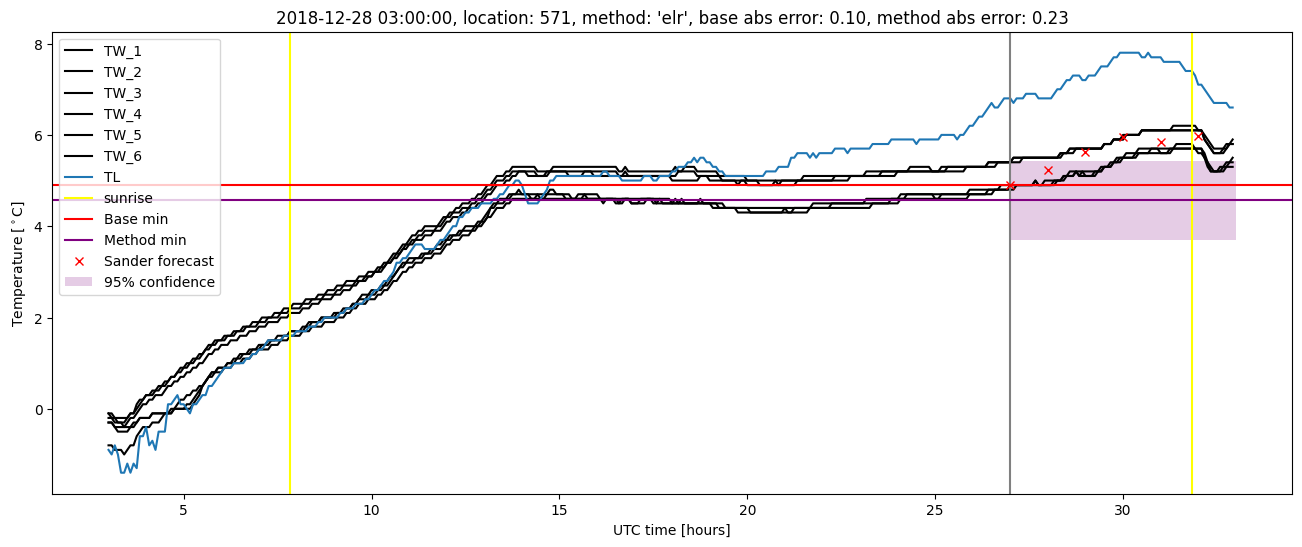
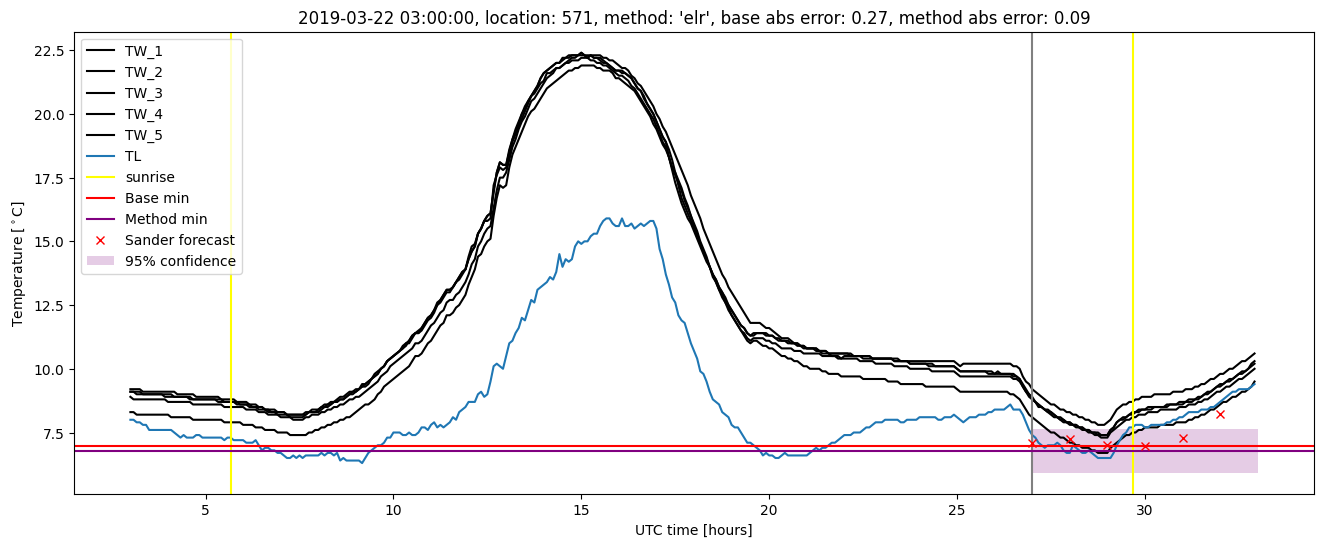
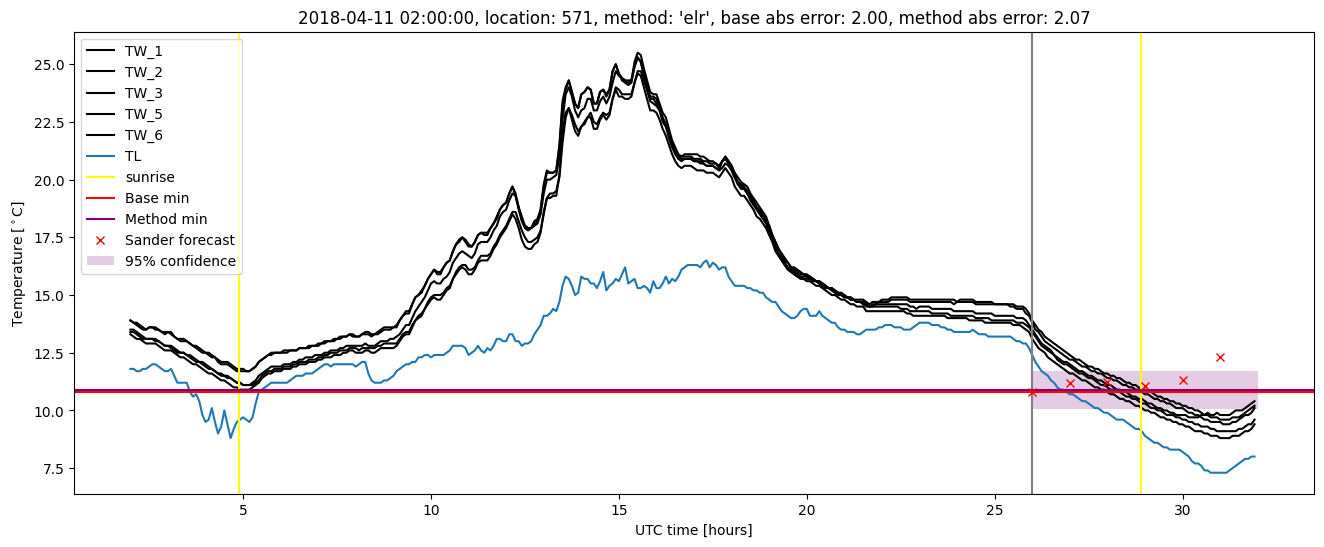
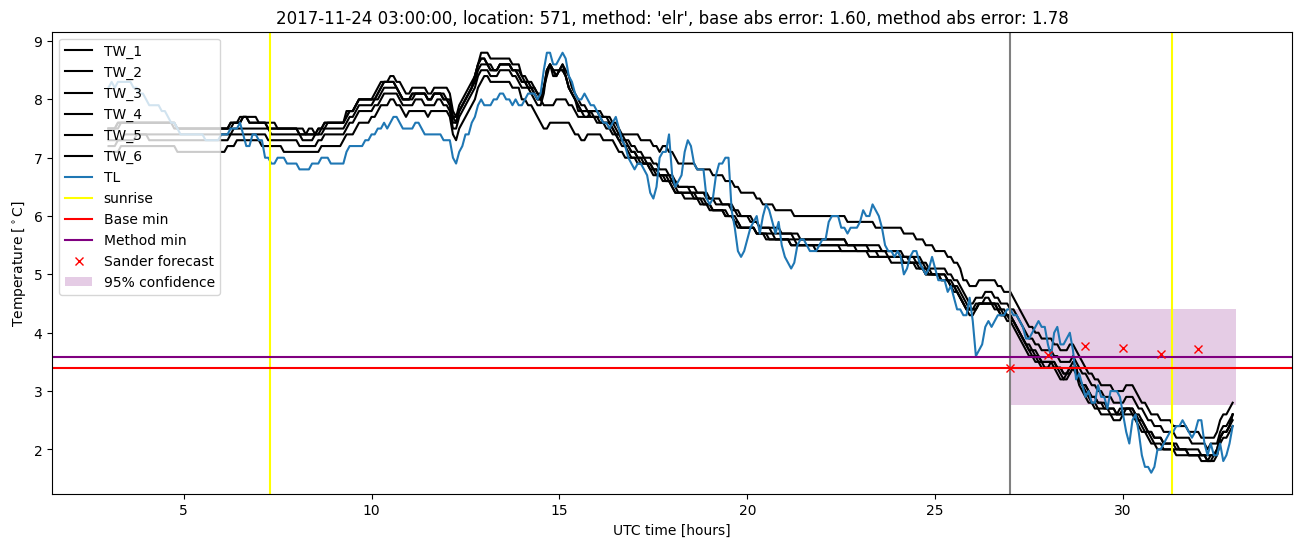
Extended logistic regression plots