GMS location: 570
Random forest results
| names |
period |
power |
significance |
meanSquareError |
absError |
maxError |
CRPS |
IGN |
| baseline |
winter 2016 |
1.000 |
0.000e+00 |
0.377 |
0.445 |
2.612 |
NaN |
NaN |
| forest |
winter 2016 |
1.000 |
0.100 |
0.328 |
0.416 |
2.615 |
0.437 |
4.750 |
| baseline |
winter 2017 |
0.976 |
0.000e+00 |
0.379 |
0.460 |
2.565 |
NaN |
NaN |
| forest |
winter 2017 |
0.984 |
0.040 |
0.269 |
0.395 |
1.540 |
0.449 |
3.553 |
| baseline |
winter 2018 |
0.992 |
0.091 |
0.298 |
0.405 |
1.830 |
NaN |
NaN |
| forest |
winter 2018 |
1.000 |
0.091 |
0.236 |
0.362 |
1.731 |
0.440 |
2.630 |
| baseline |
winter 2019 |
0.993 |
0.000e+00 |
0.340 |
0.395 |
2.107 |
NaN |
NaN |
| forest |
winter 2019 |
0.993 |
0.000e+00 |
0.251 |
0.363 |
1.591 |
0.439 |
3.137 |
| baseline |
all |
0.992 |
0.018 |
0.351 |
0.428 |
2.612 |
NaN |
NaN |
| forest |
all |
0.995 |
0.054 |
0.276 |
0.387 |
2.615 |
0.441 |
3.616 |
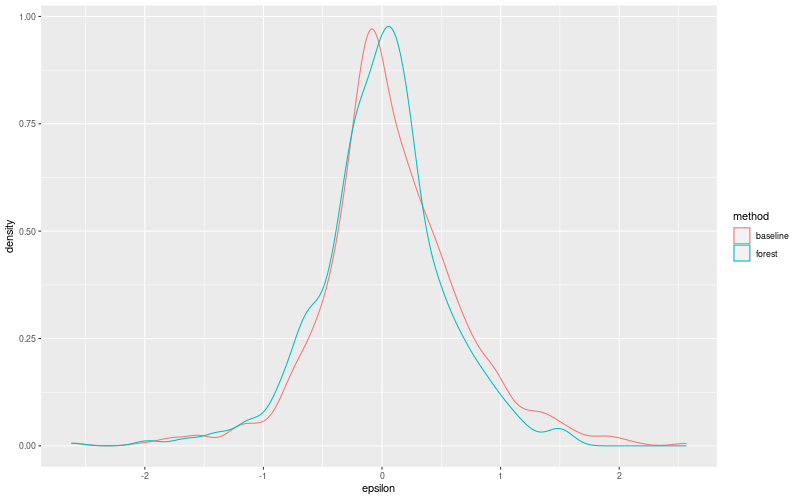
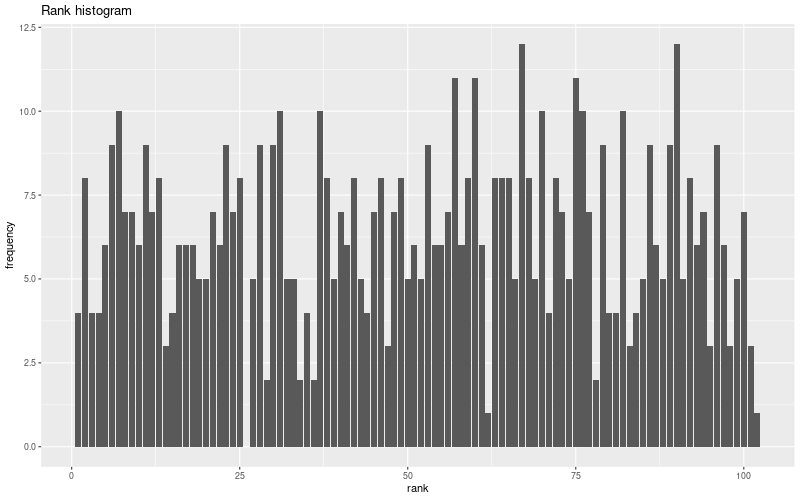
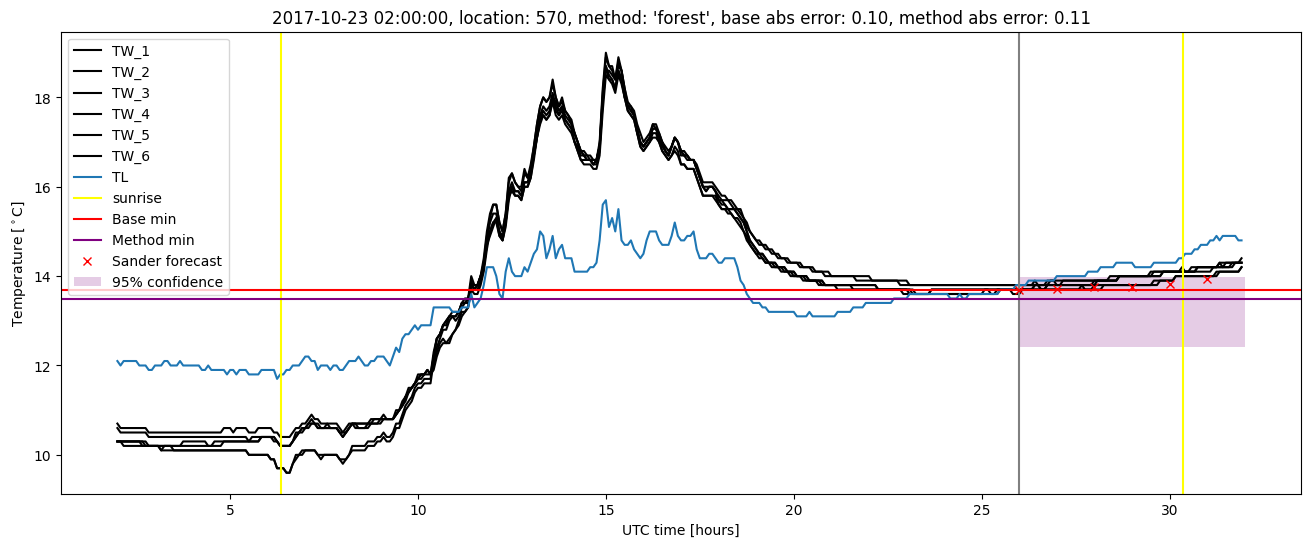
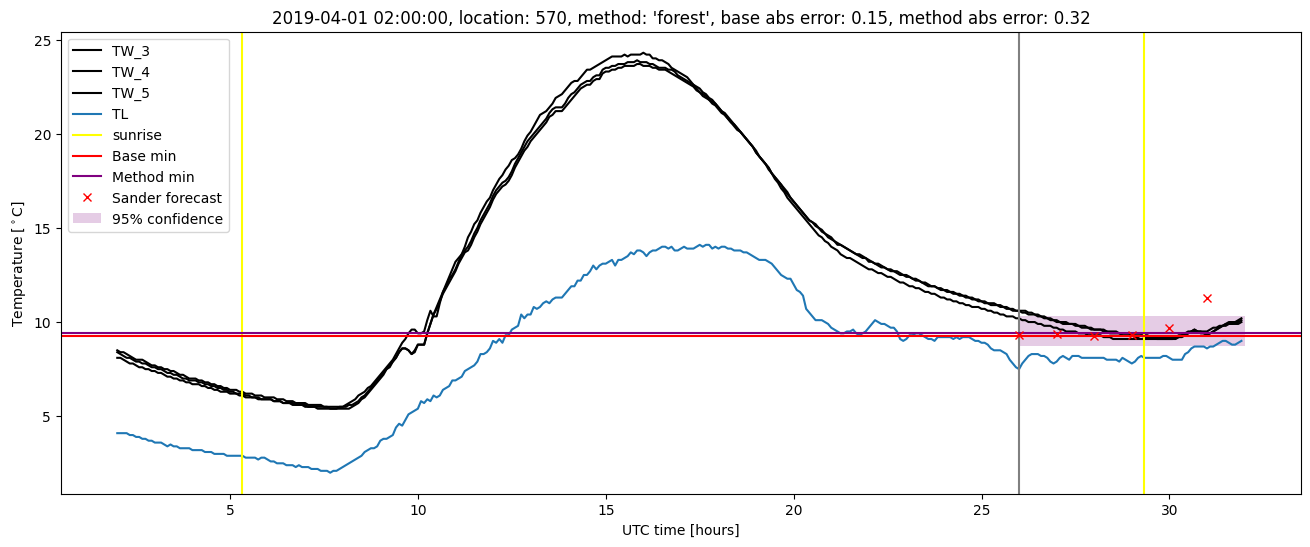
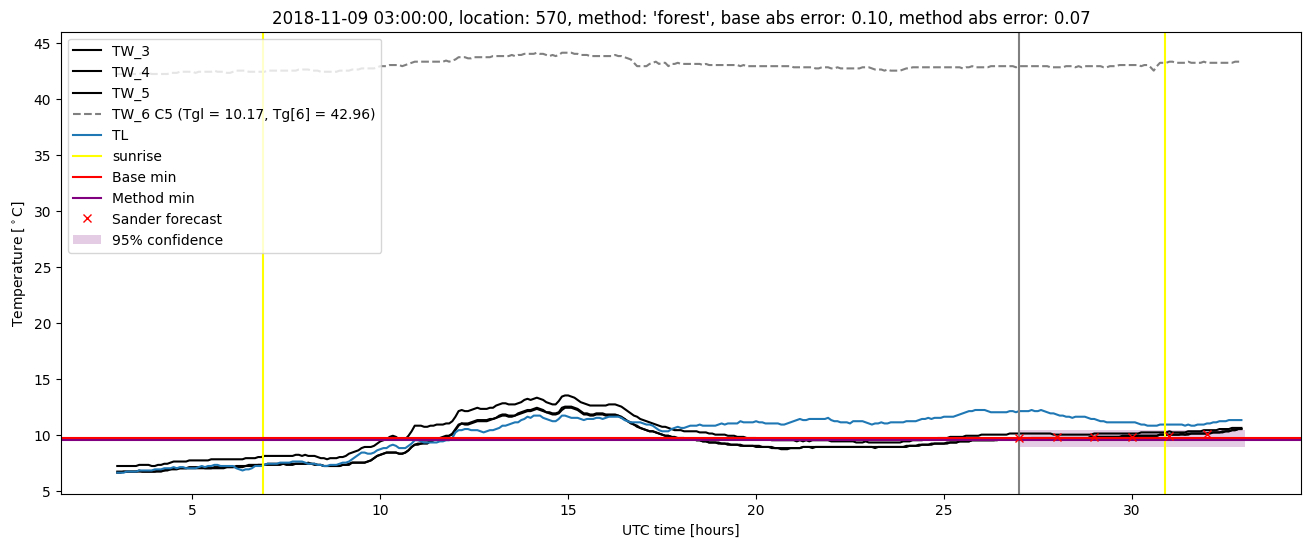
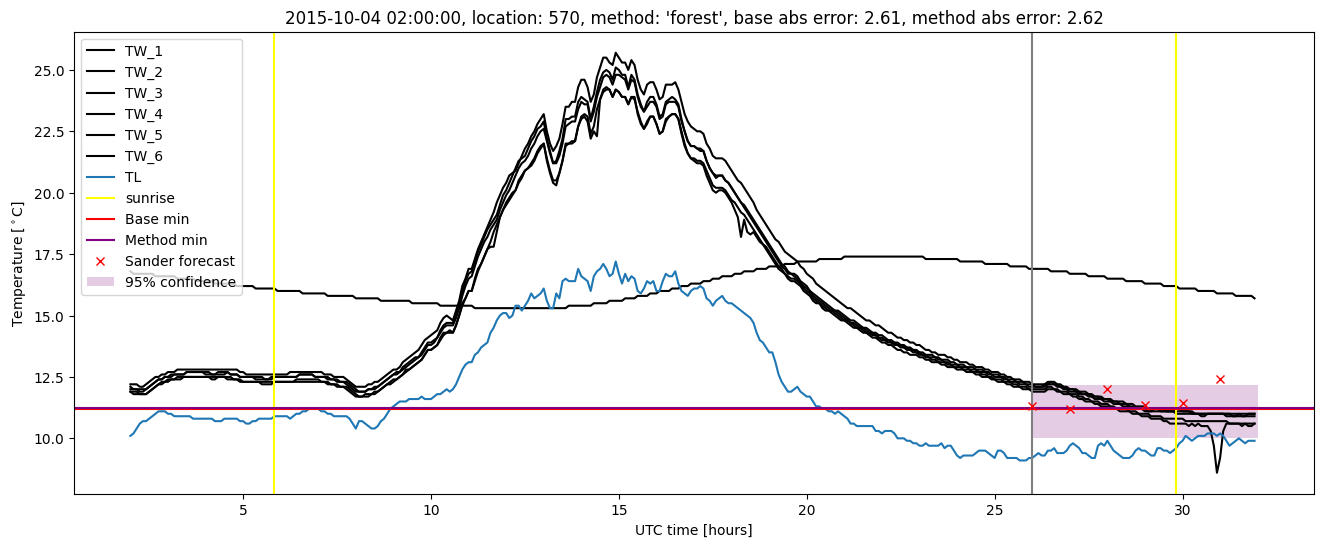
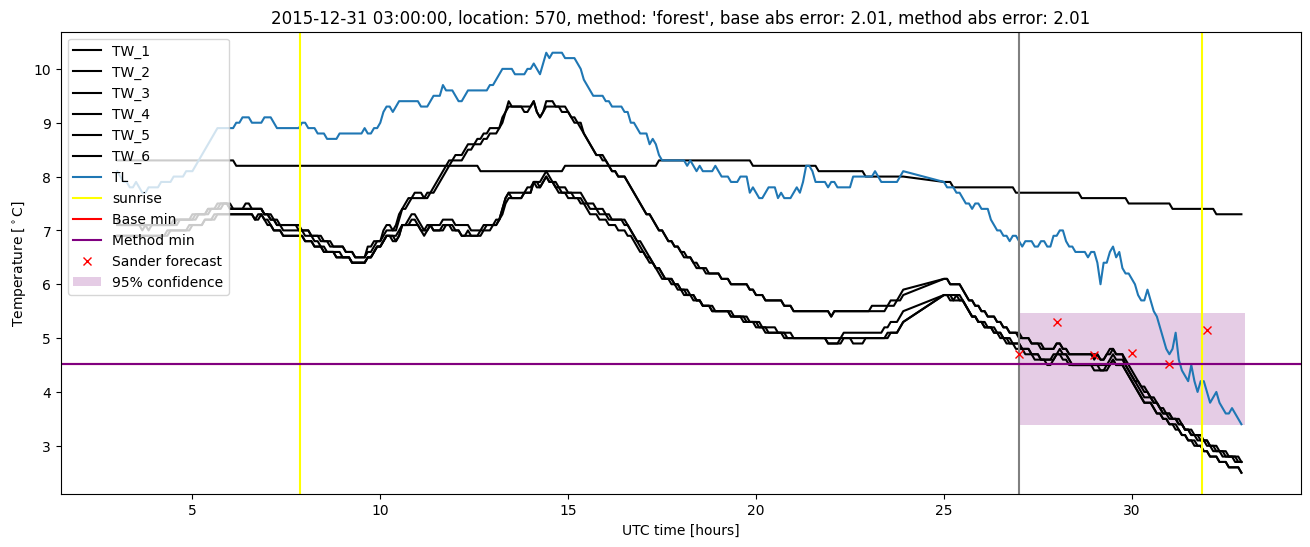
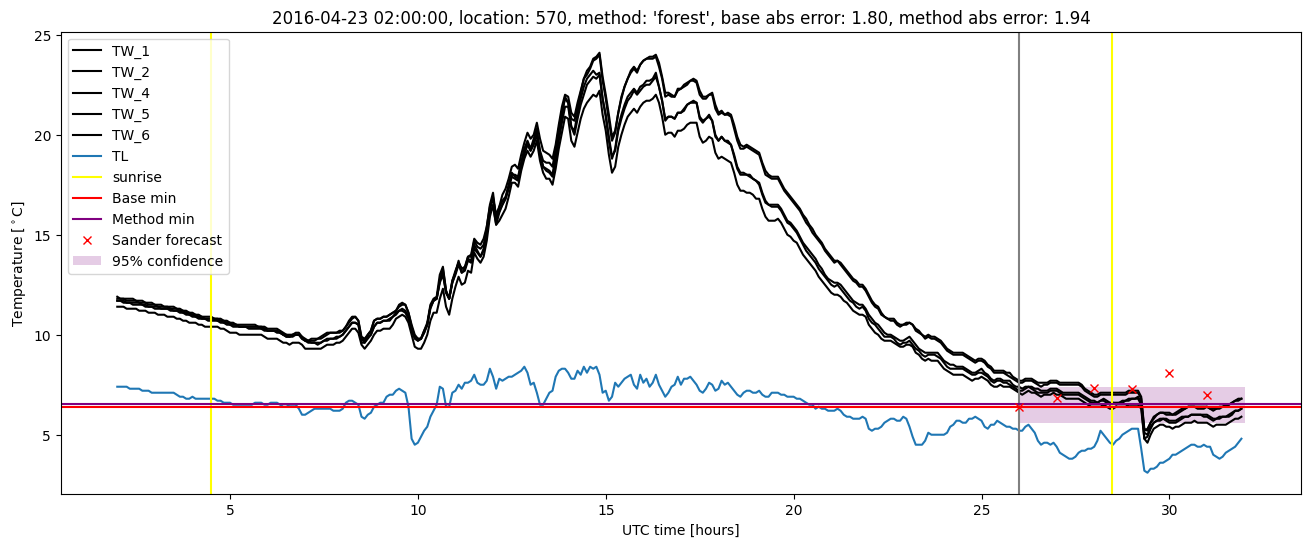
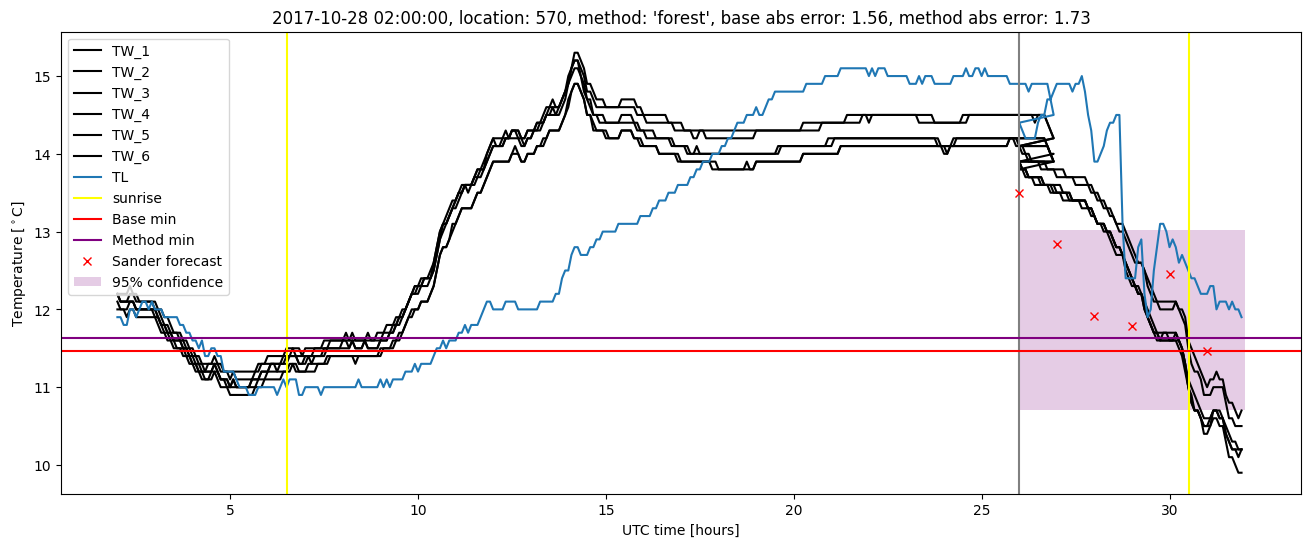
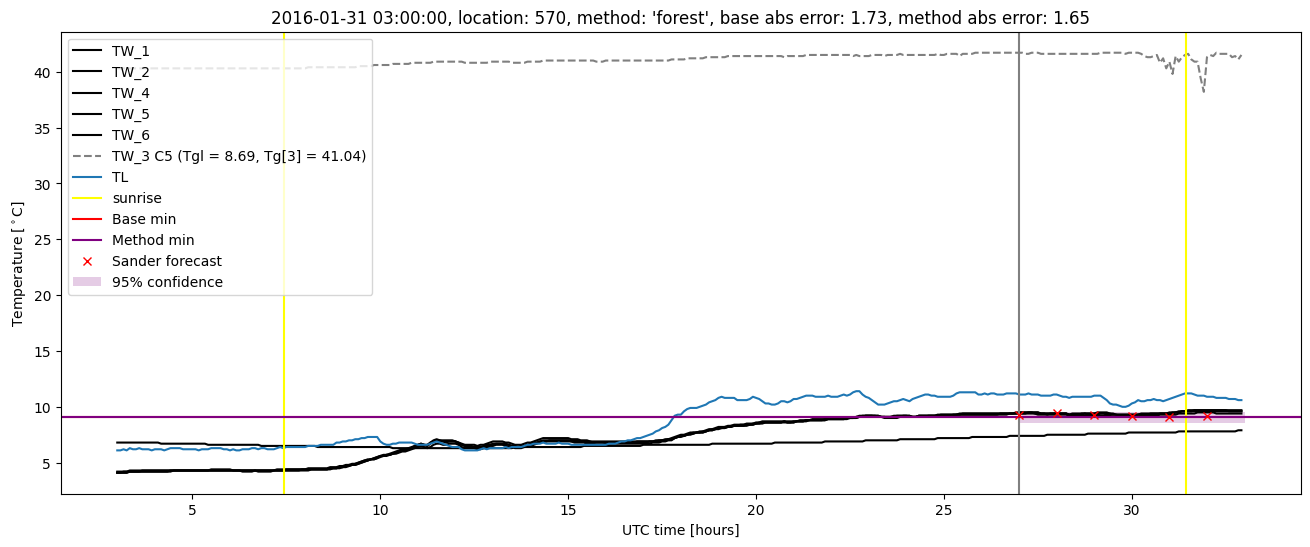
Random forest plots
Extended logistic regression results
| names |
period |
power |
significance |
meanSquareError |
absError |
maxError |
CRPS |
IGN |
| baseline |
winter 2016 |
1.000 |
0.000e+00 |
0.377 |
0.445 |
2.612 |
NaN |
NaN |
| elr |
winter 2016 |
1.000 |
0.100 |
0.319 |
0.420 |
2.550 |
0.524 |
4.786 |
| baseline |
winter 2017 |
0.976 |
0.000e+00 |
0.379 |
0.460 |
2.565 |
NaN |
NaN |
| elr |
winter 2017 |
0.984 |
0.040 |
0.308 |
0.430 |
1.976 |
0.528 |
4.603 |
| baseline |
winter 2018 |
0.992 |
0.091 |
0.298 |
0.405 |
1.830 |
NaN |
NaN |
| elr |
winter 2018 |
1.000 |
0.091 |
0.255 |
0.377 |
2.246 |
0.506 |
4.129 |
| baseline |
winter 2019 |
0.993 |
0.000e+00 |
0.340 |
0.395 |
2.107 |
NaN |
NaN |
| elr |
winter 2019 |
0.986 |
0.000e+00 |
0.280 |
0.399 |
1.759 |
0.501 |
4.543 |
| baseline |
all |
0.992 |
0.018 |
0.351 |
0.428 |
2.612 |
NaN |
NaN |
| elr |
all |
0.993 |
0.054 |
0.292 |
0.408 |
2.550 |
0.515 |
4.540 |
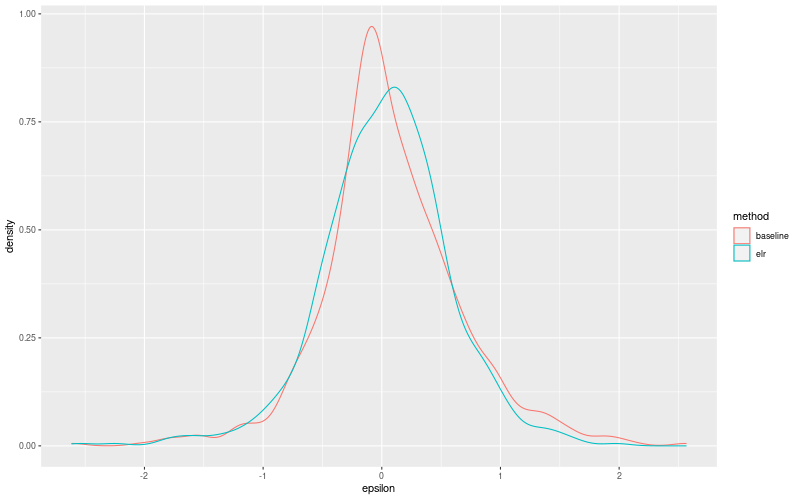
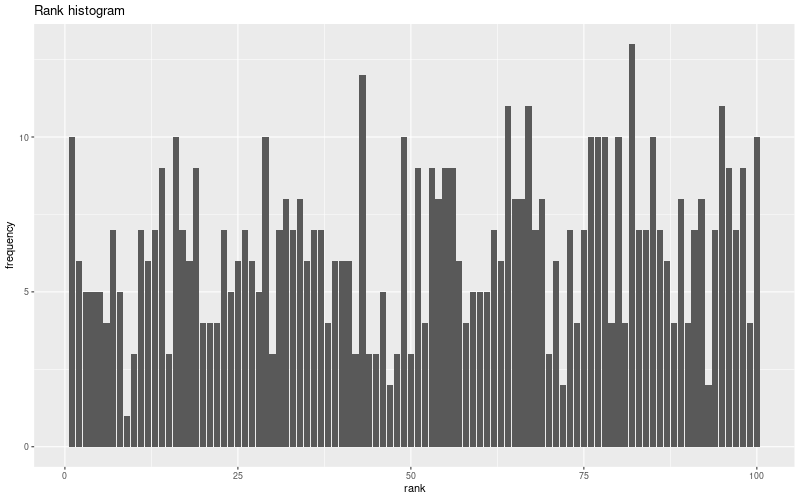
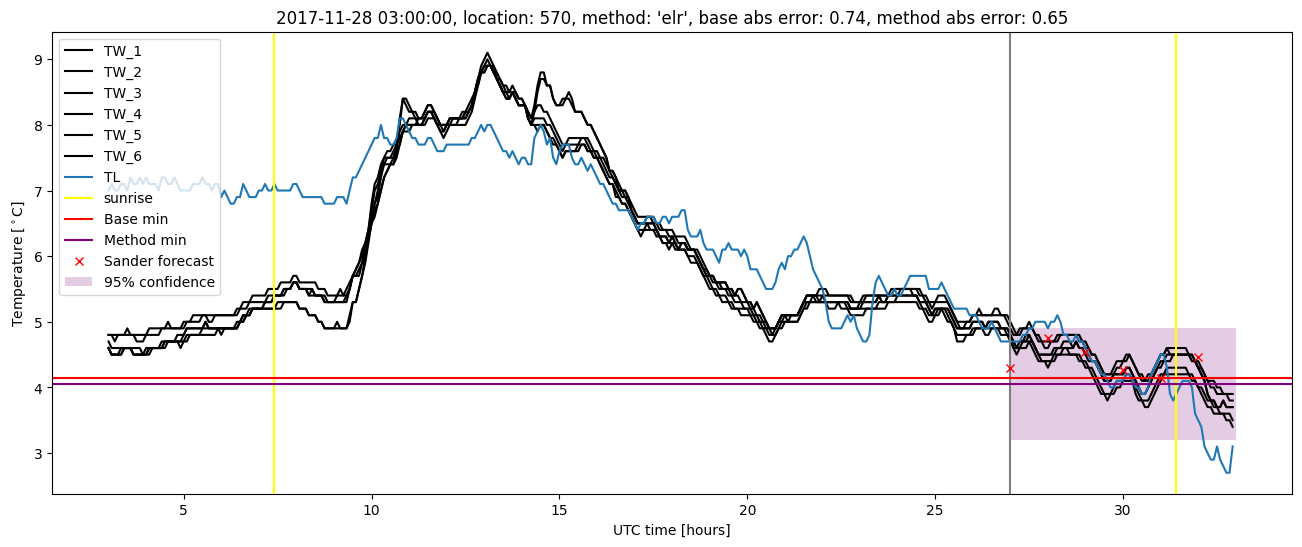
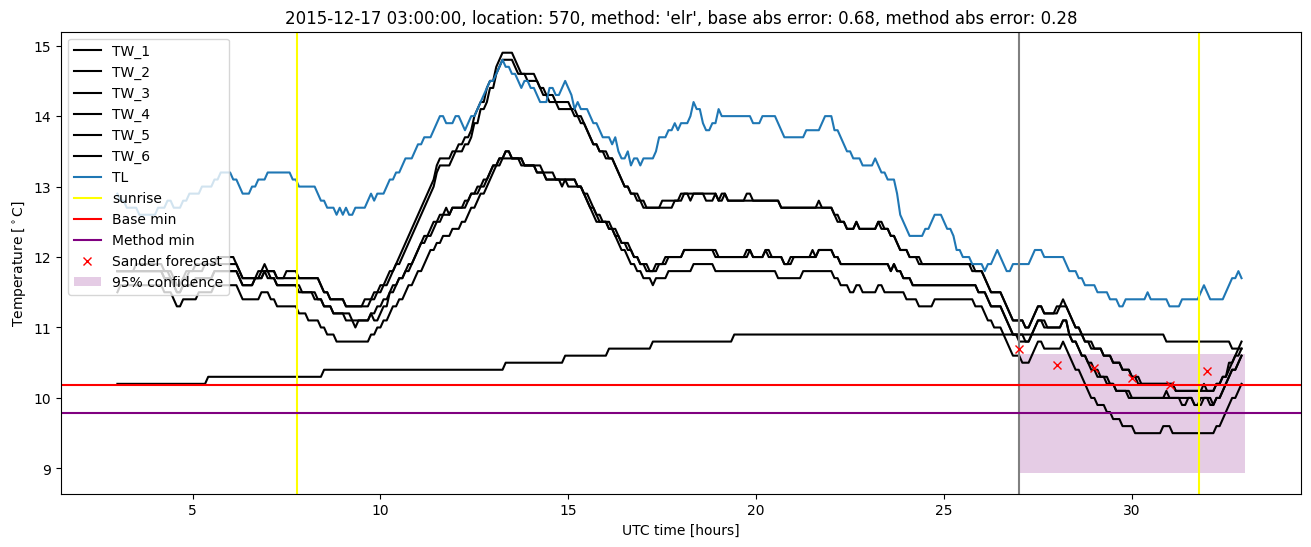
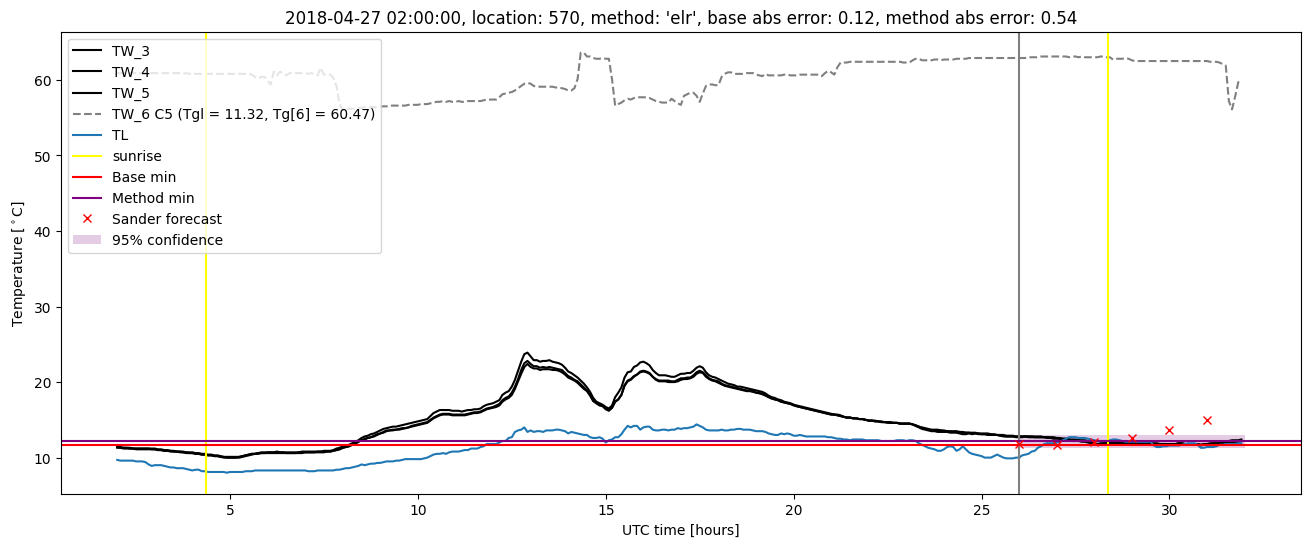
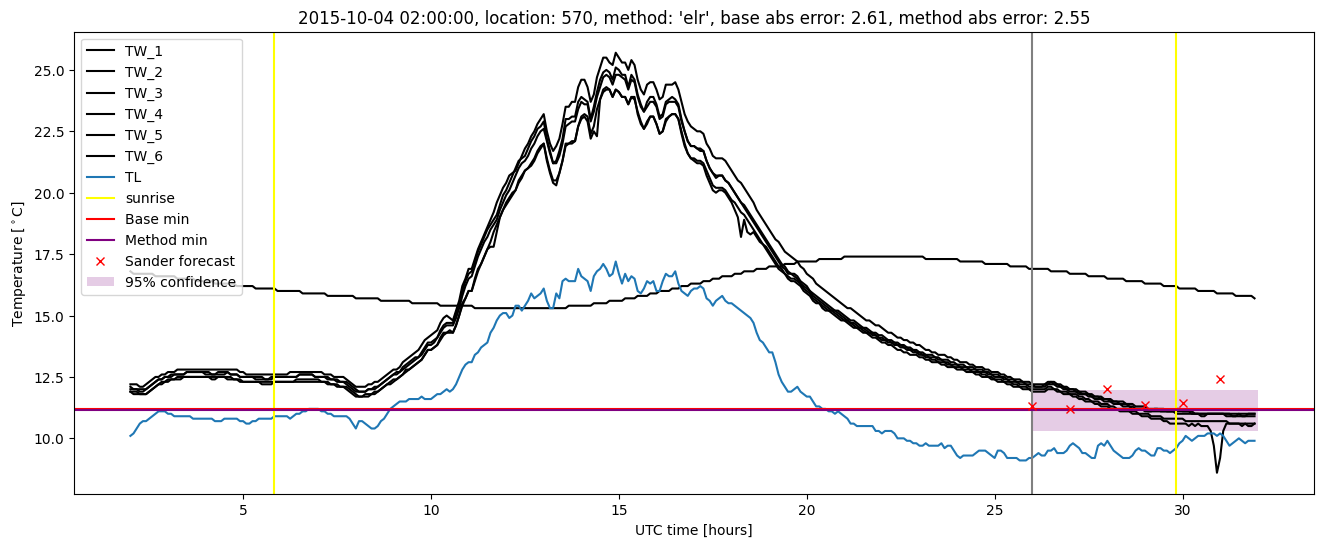
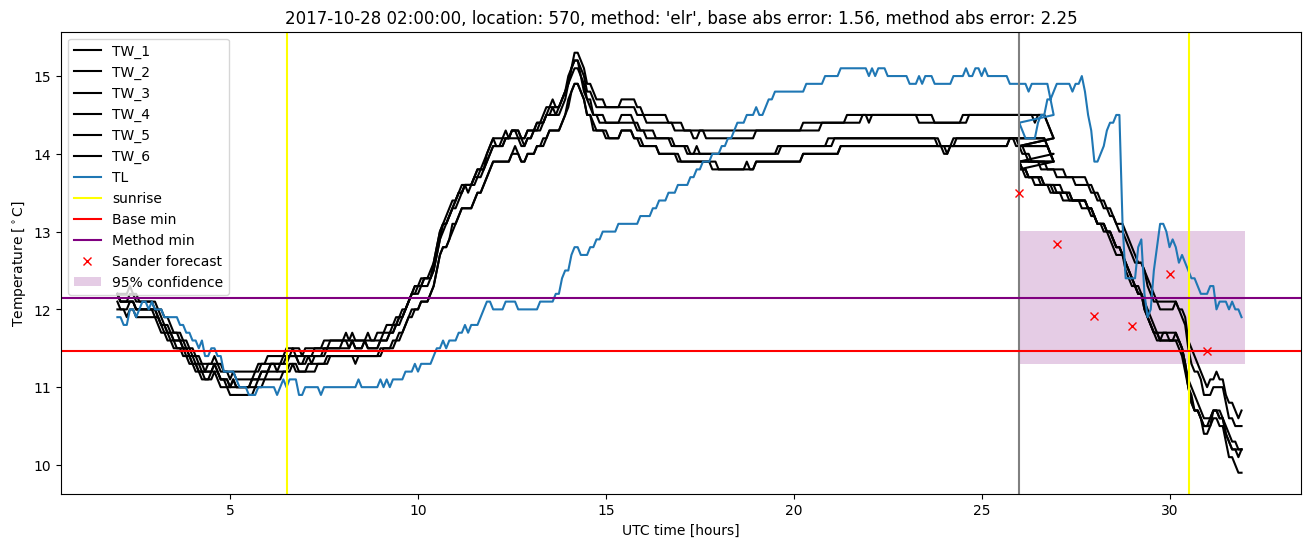
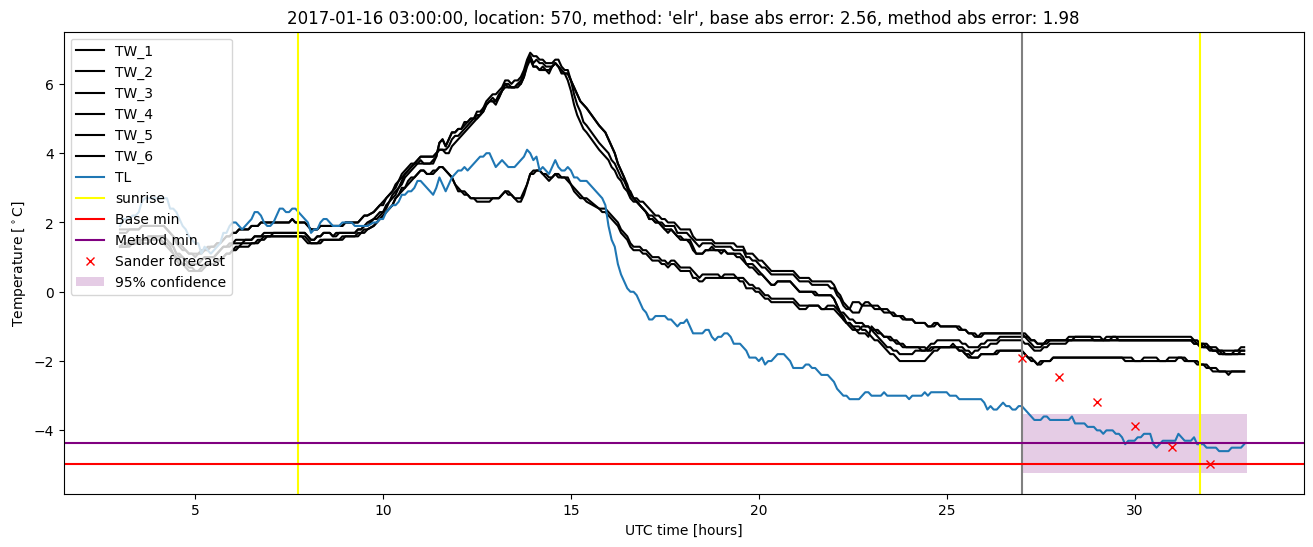
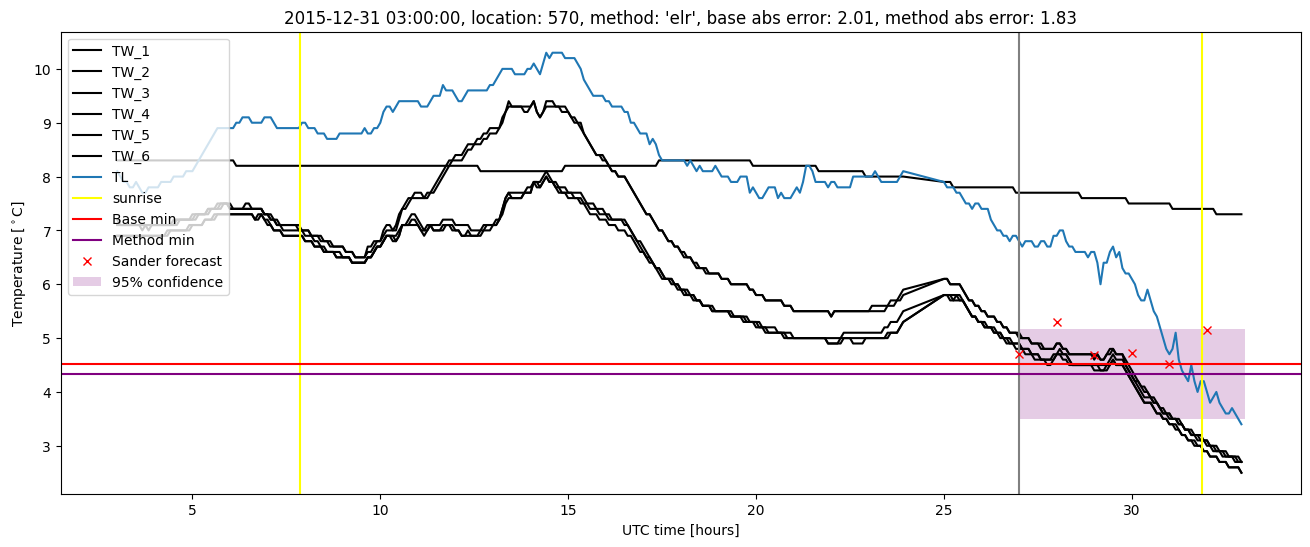
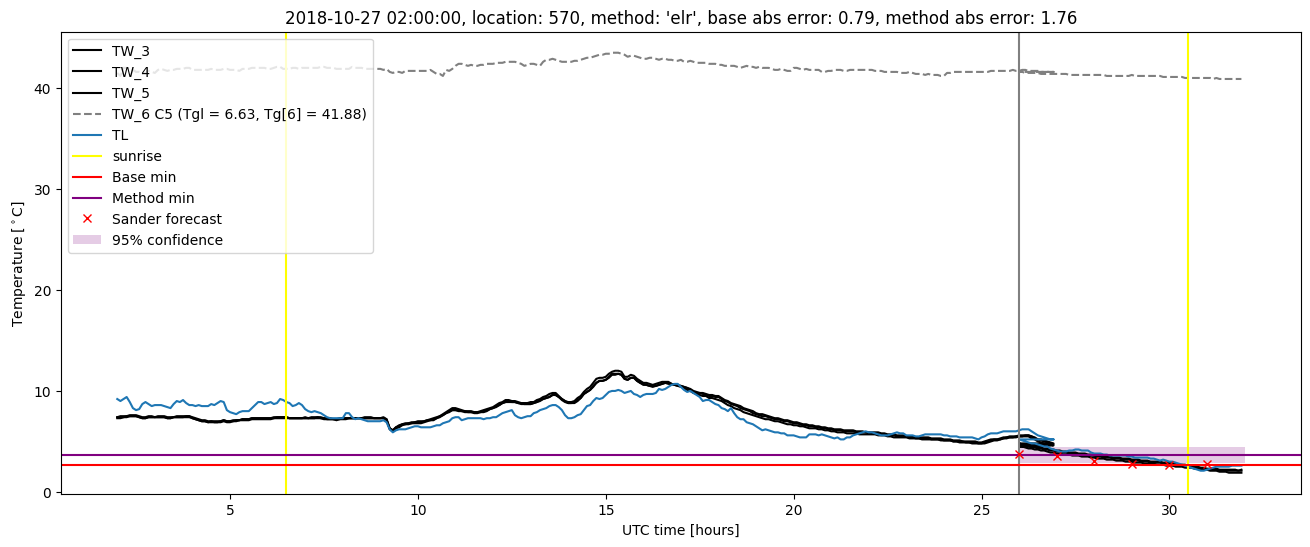
Extended logistic regression plots