GMS location: 569
Random forest results
| names |
period |
power |
significance |
meanSquareError |
absError |
maxError |
CRPS |
IGN |
| baseline |
winter 2016 |
0.995 |
0.000e+00 |
0.323 |
0.454 |
1.601 |
NaN |
NaN |
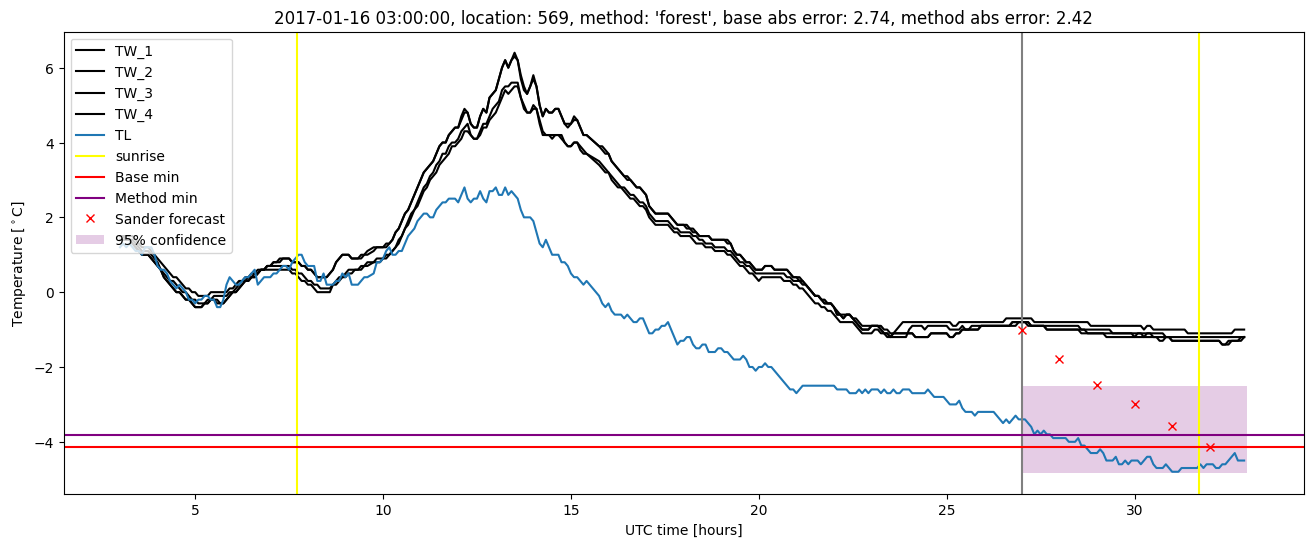
| forest |
winter 2016 |
0.995 |
0.000e+00 |
0.310 |
0.444 |
1.888 |
0.551 |
4.226 |
| baseline |
winter 2017 |
0.960 |
0.071 |
0.367 |
0.437 |
2.742 |
NaN |
NaN |
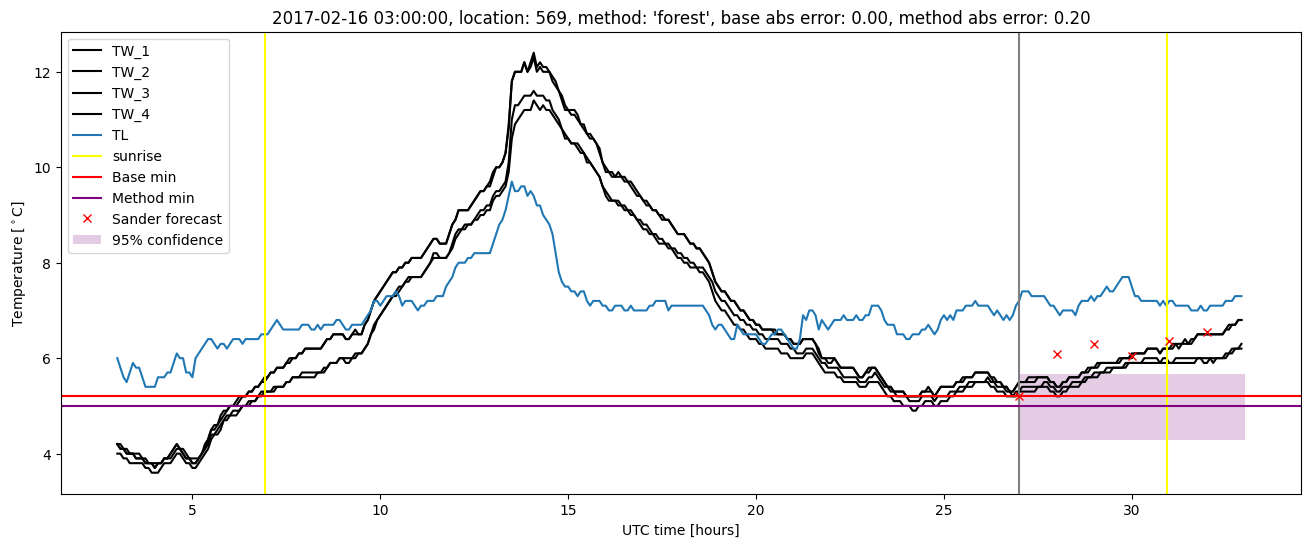
| forest |
winter 2017 |
0.944 |
0.071 |
0.331 |
0.430 |
2.417 |
0.550 |
4.493 |
| baseline |
winter 2018 |
1.000 |
0.167 |
0.354 |
0.449 |
1.968 |
NaN |
NaN |
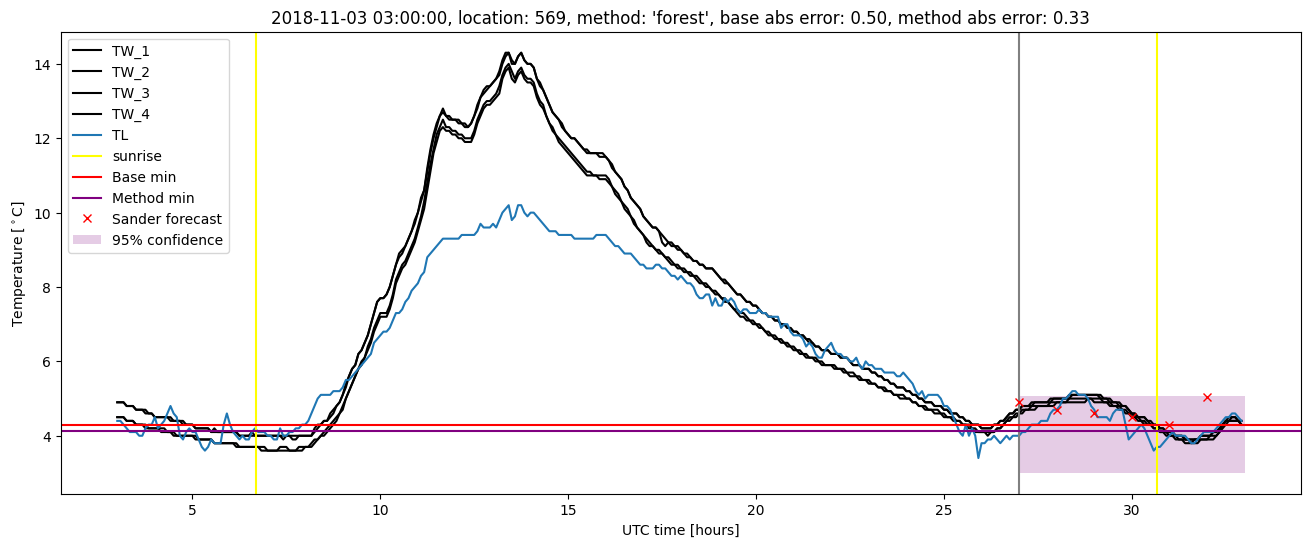
| forest |
winter 2018 |
1.000 |
0.167 |
0.276 |
0.396 |
1.855 |
0.557 |
3.444 |
| baseline |
winter 2019 |
0.983 |
0.111 |
0.321 |
0.401 |
2.503 |
NaN |
NaN |
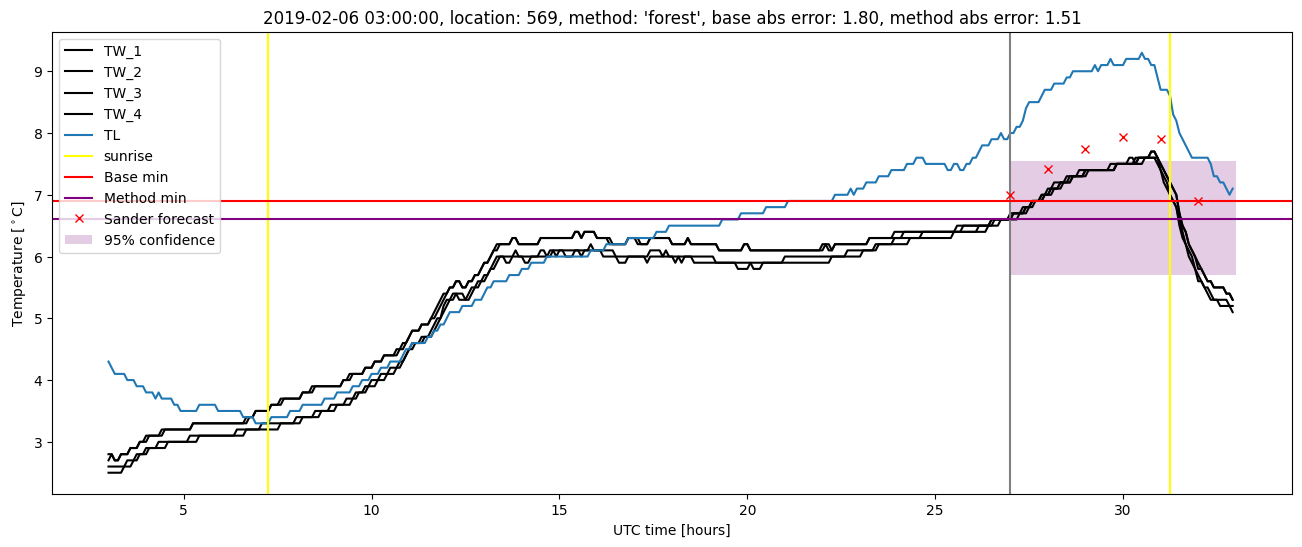
| forest |
winter 2019 |
0.983 |
0.111 |
0.265 |
0.362 |
1.952 |
0.548 |
4.241 |
| baseline |
all |
0.986 |
0.093 |
0.341 |
0.439 |
2.742 |
NaN |
NaN |
| forest |
all |
0.983 |
0.093 |
0.297 |
0.412 |
2.417 |
0.552 |
4.086 |
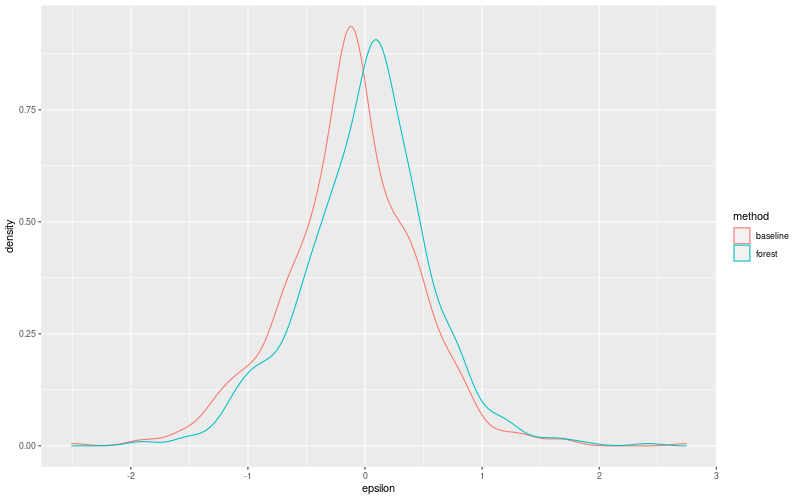
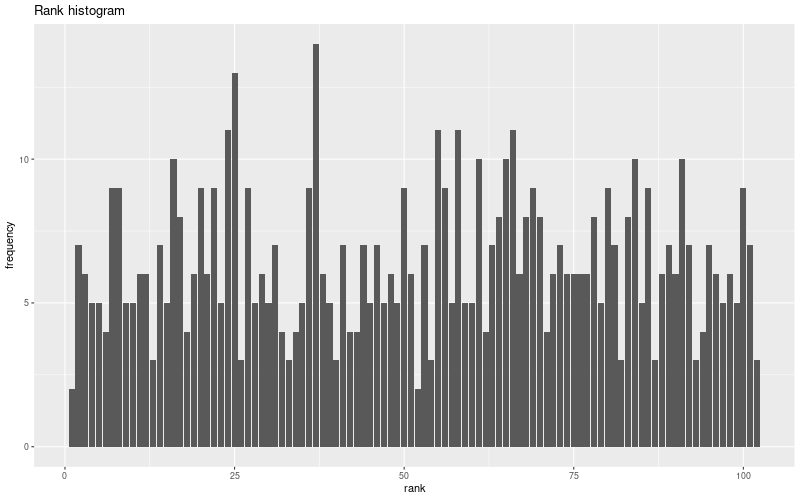
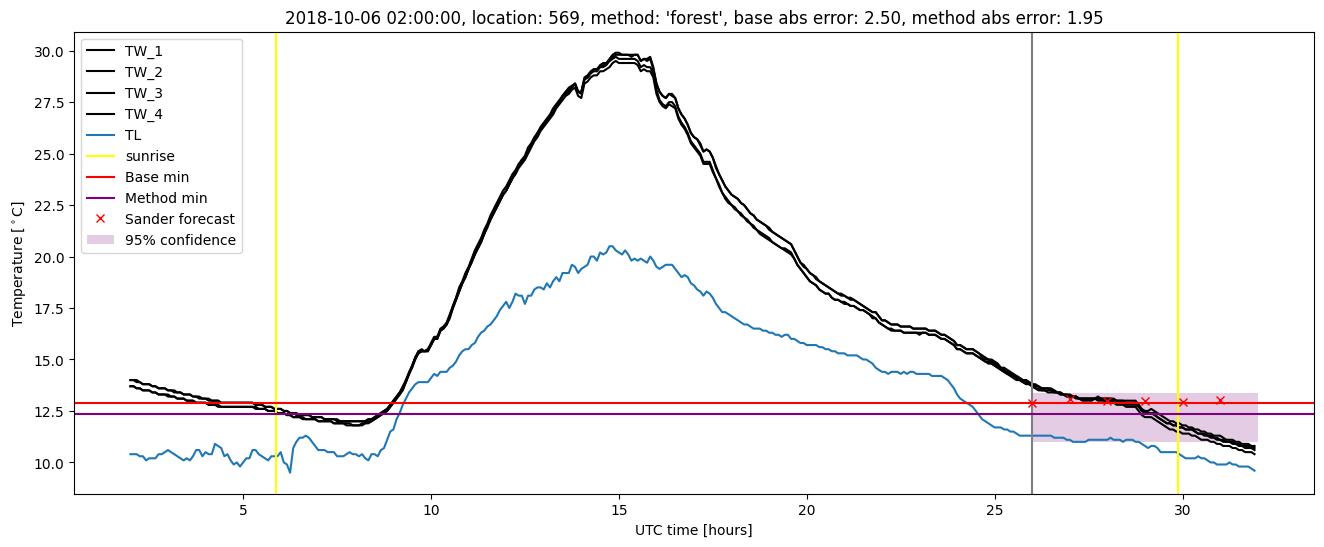
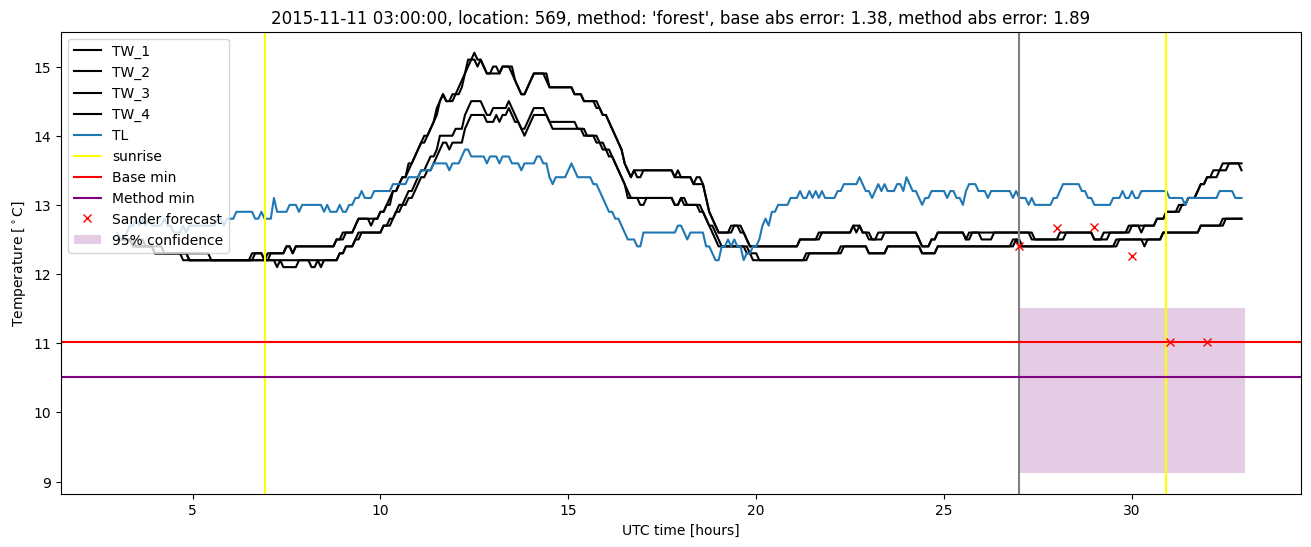
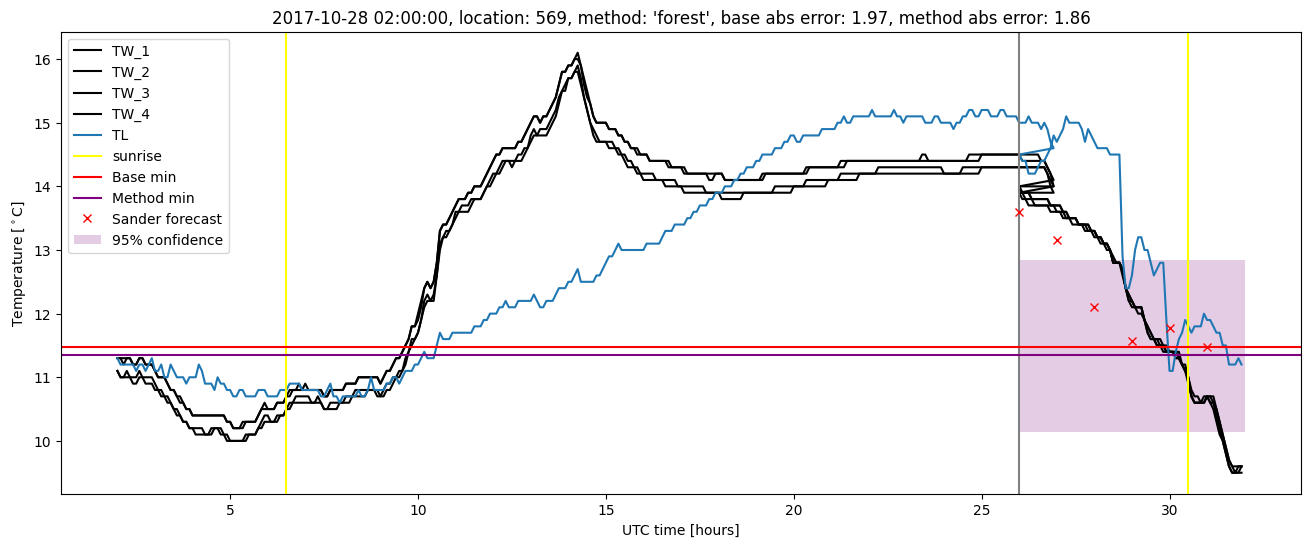
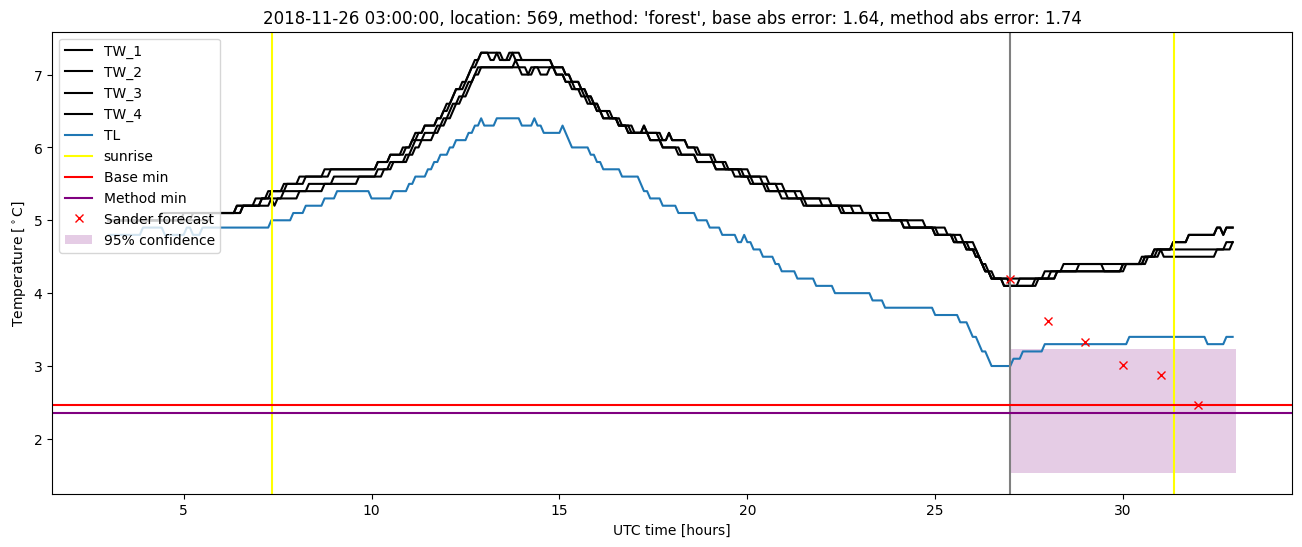
Random forest plots
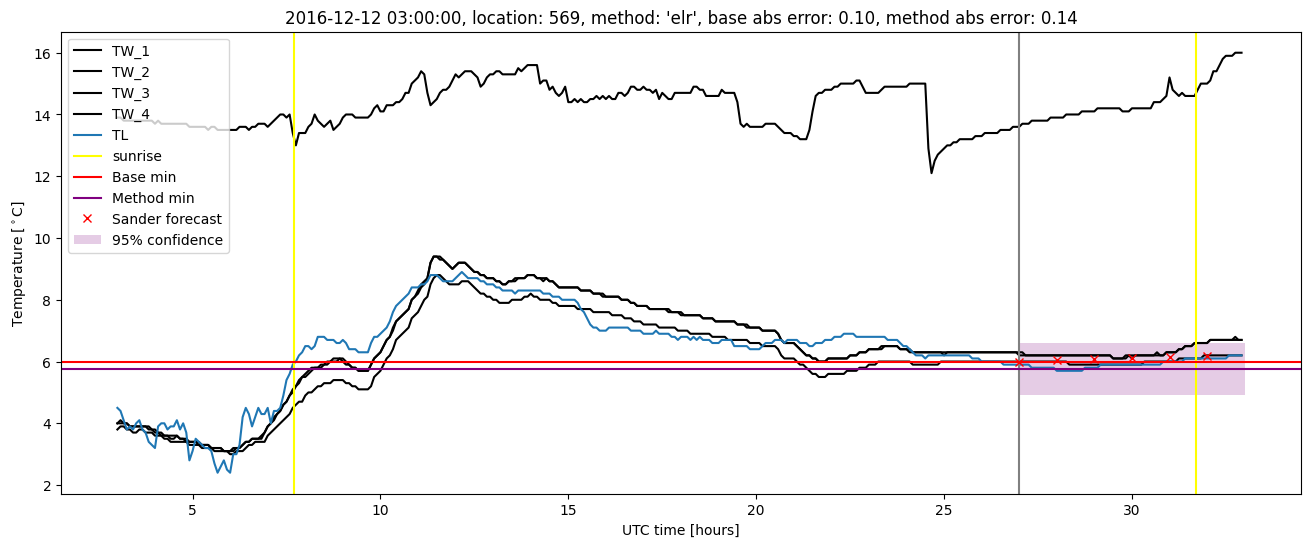
Extended logistic regression results
| names |
period |
power |
significance |
meanSquareError |
absError |
maxError |
CRPS |
IGN |
| baseline |
winter 2016 |
0.995 |
0.000e+00 |
0.323 |
0.454 |
1.601 |
NaN |
NaN |
| elr |
winter 2016 |
0.995 |
0.000e+00 |
0.342 |
0.478 |
1.746 |
0.635 |
5.826 |
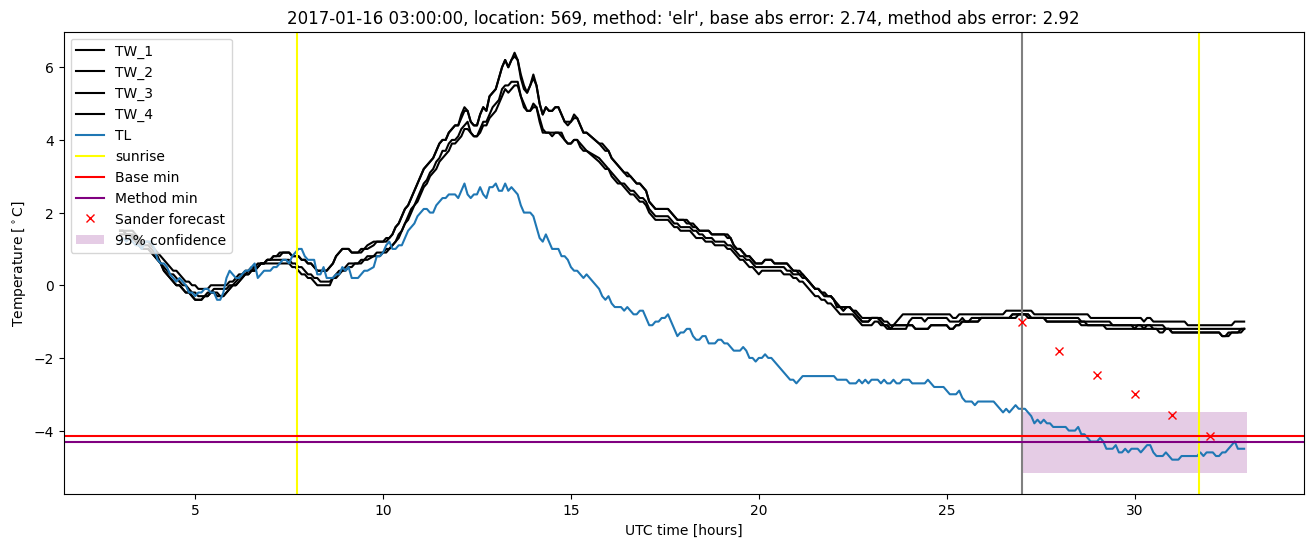
| baseline |
winter 2017 |
0.960 |
0.071 |
0.367 |
0.437 |
2.742 |
NaN |
NaN |
| elr |
winter 2017 |
0.944 |
0.071 |
0.403 |
0.480 |
2.923 |
0.623 |
6.646 |
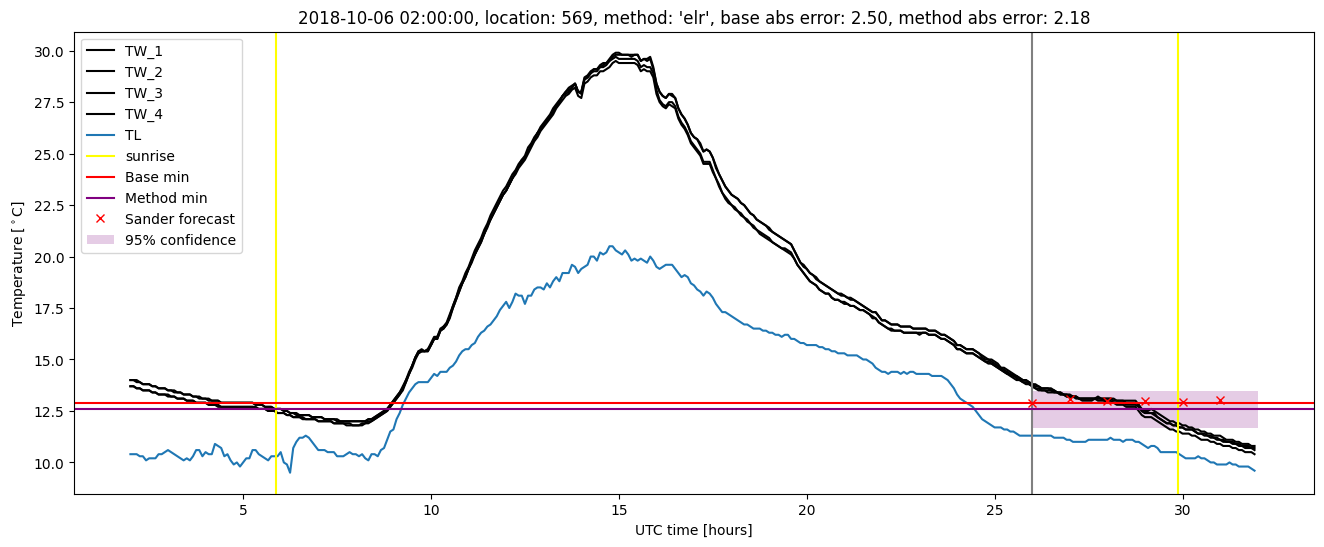
| baseline |
winter 2018 |
1.000 |
0.167 |
0.354 |
0.449 |
1.968 |
NaN |
NaN |
| elr |
winter 2018 |
1.000 |
0.208 |
0.296 |
0.414 |
1.641 |
0.629 |
5.750 |
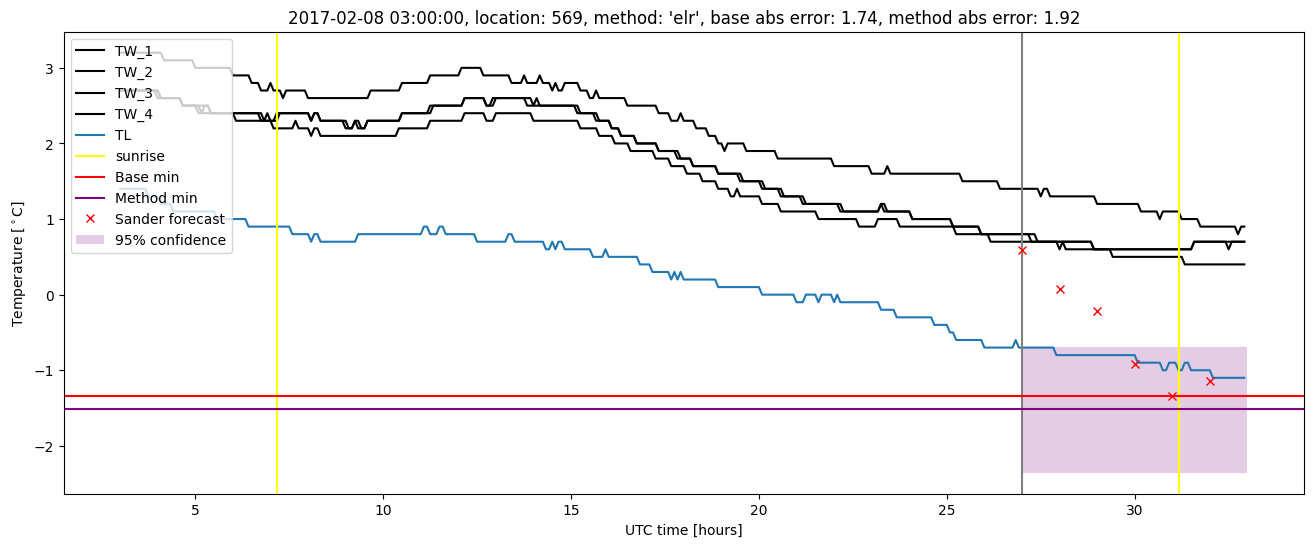
| baseline |
winter 2019 |
0.983 |
0.111 |
0.321 |
0.401 |
2.503 |
NaN |
NaN |
| elr |
winter 2019 |
0.983 |
0.111 |
0.300 |
0.395 |
2.179 |
0.591 |
4.882 |
| baseline |
all |
0.986 |
0.093 |
0.341 |
0.439 |
2.742 |
NaN |
NaN |
| elr |
all |
0.983 |
0.107 |
0.336 |
0.446 |
2.923 |
0.622 |
5.815 |
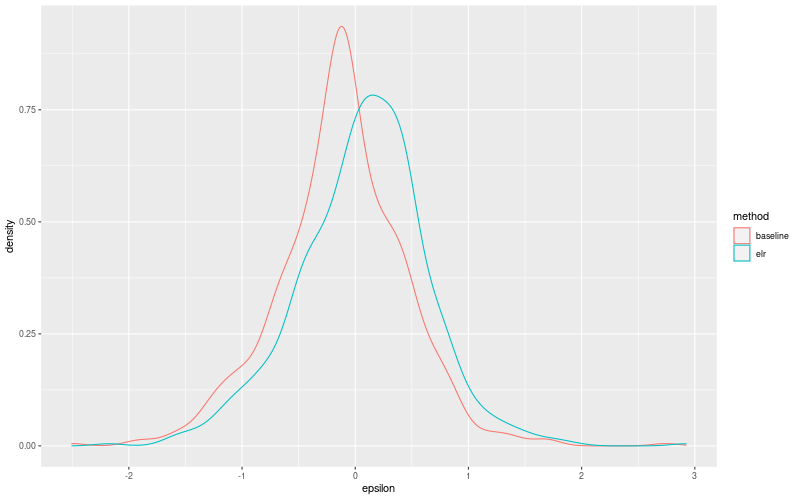
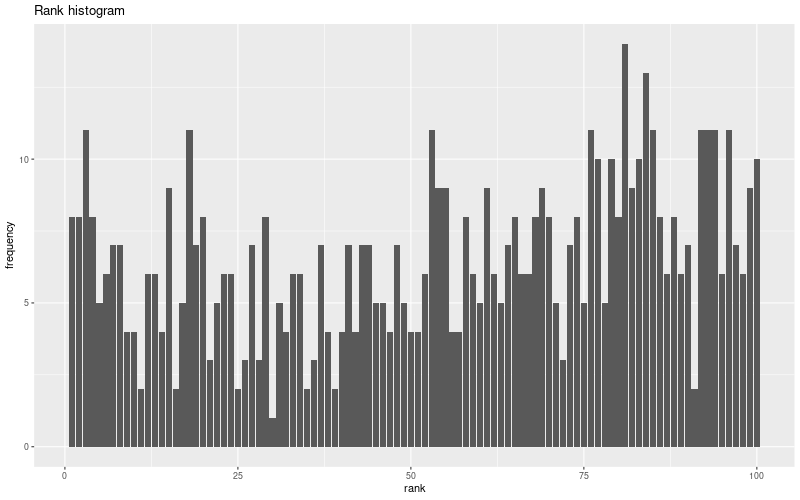
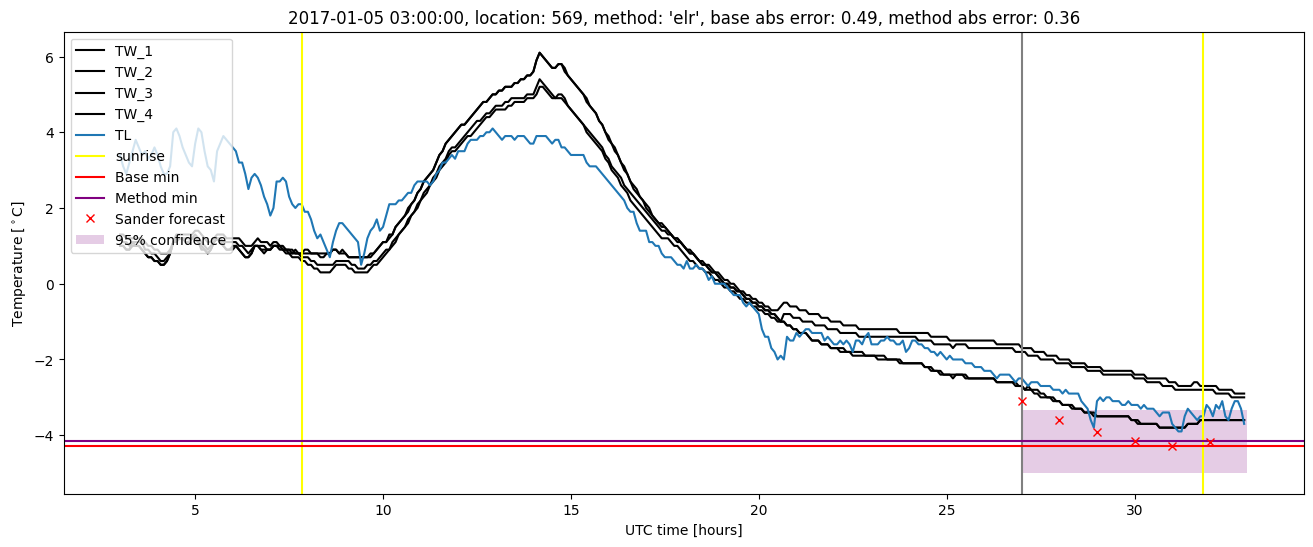
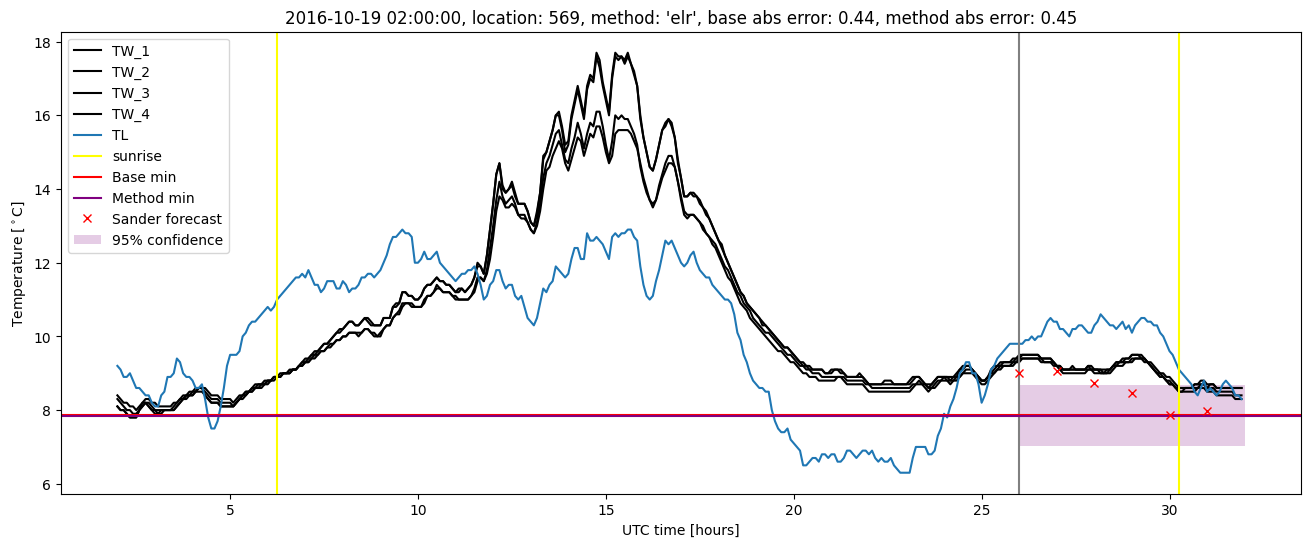
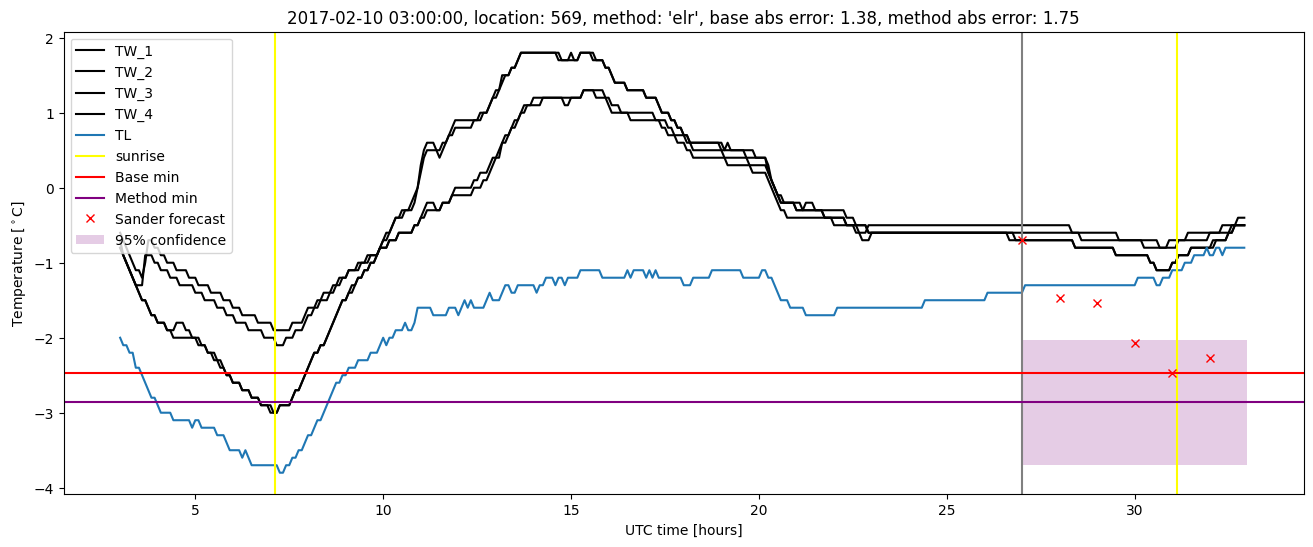
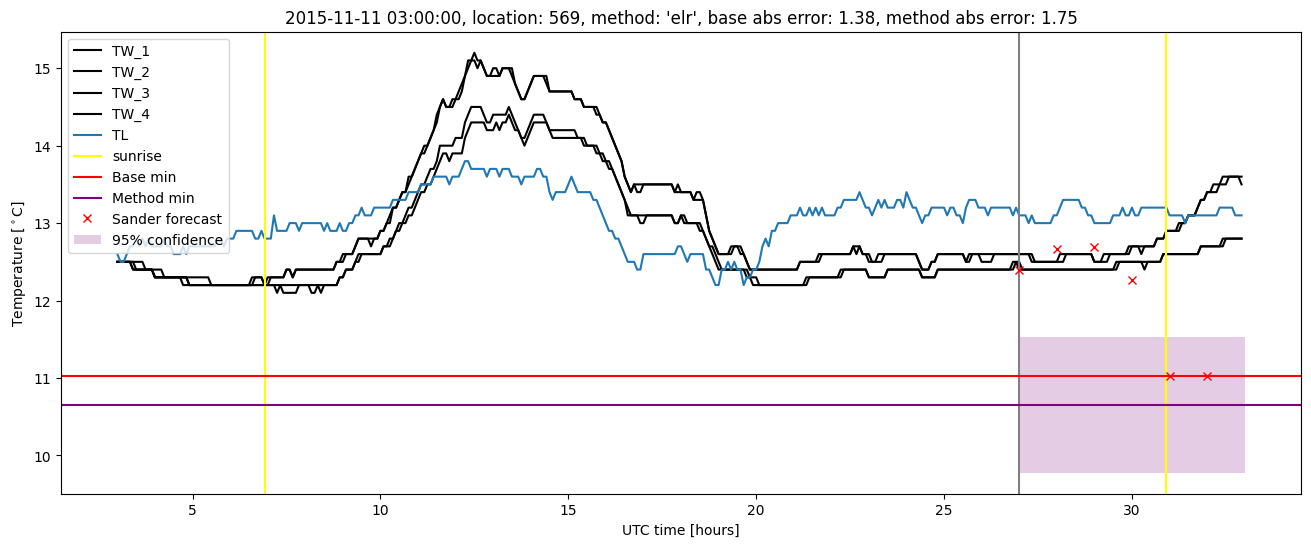
Extended logistic regression plots