GMS location: 566
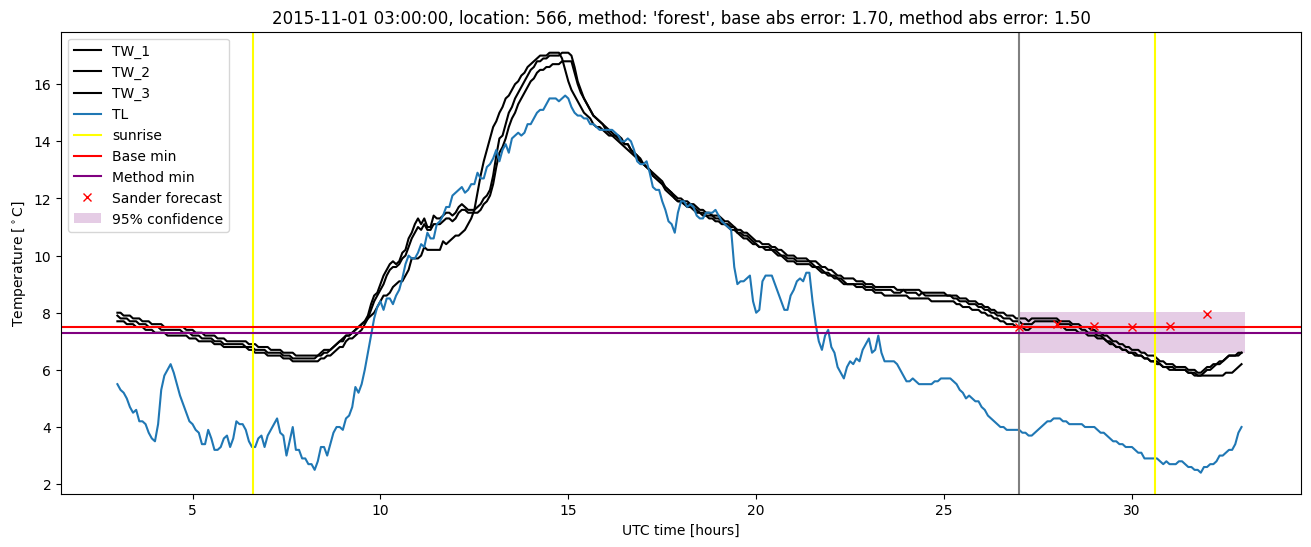
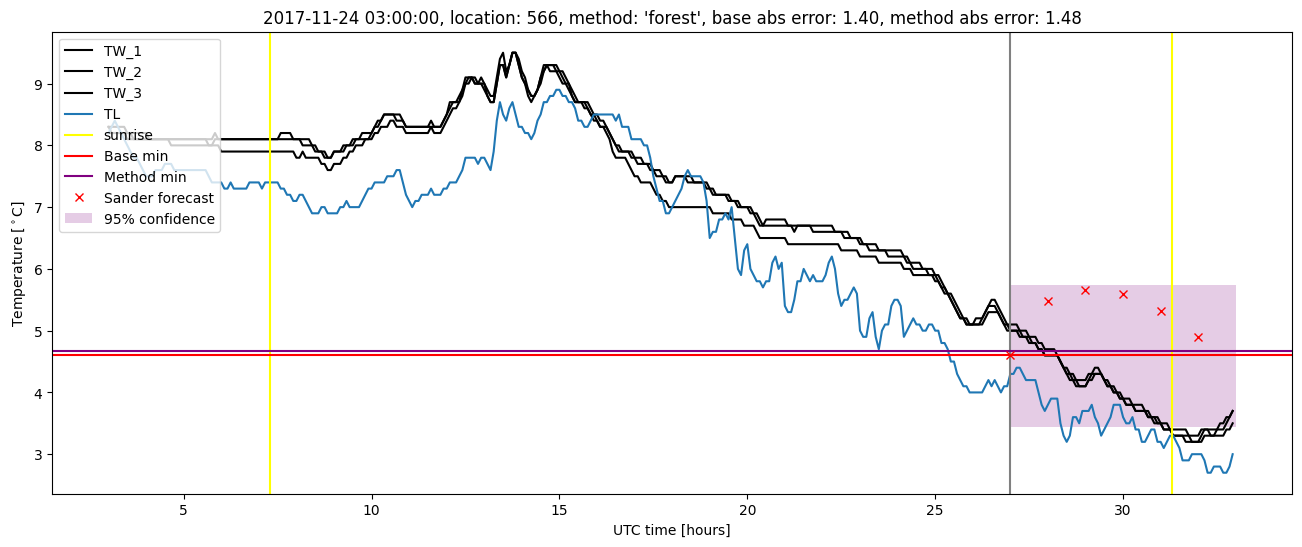
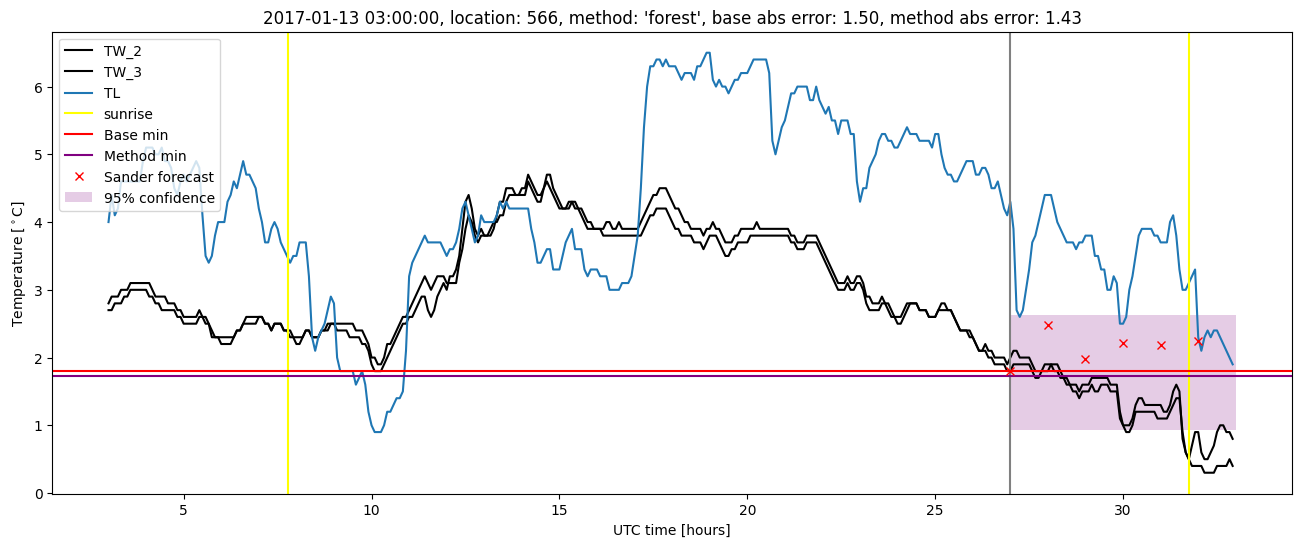
Random forest results
| names |
period |
power |
significance |
meanSquareError |
absError |
maxError |
CRPS |
IGN |
| baseline |
winter 2016 |
0.995 |
0.000e+00 |
0.348 |
0.448 |
1.701 |
NaN |
NaN |
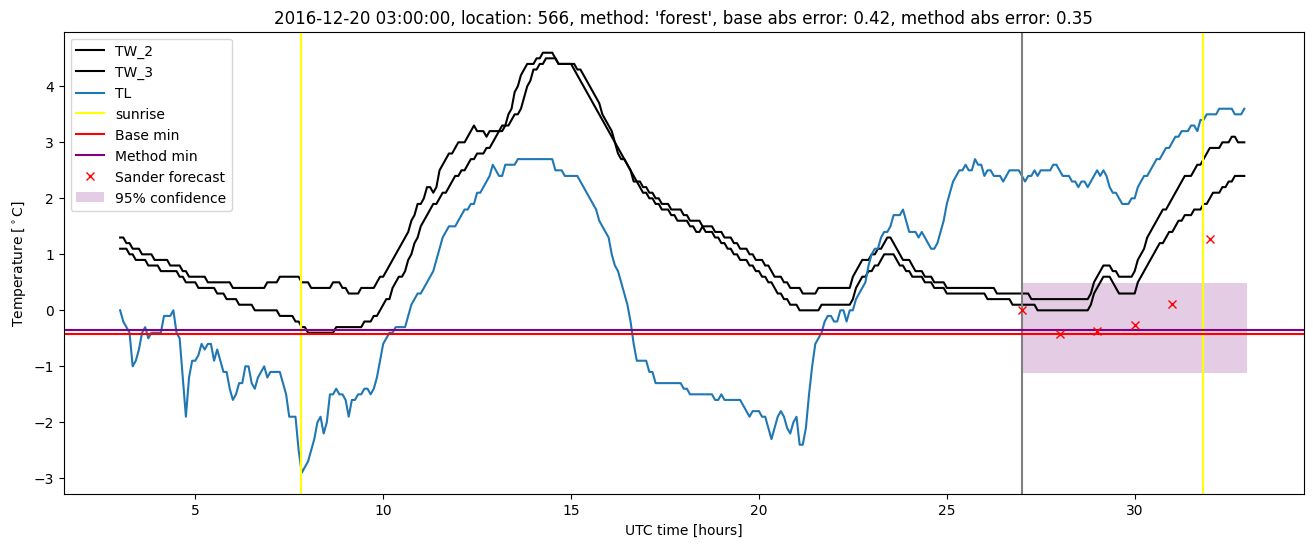
| forest |
winter 2016 |
0.995 |
0.000e+00 |
0.259 |
0.383 |
1.687 |
0.441 |
5.125 |
| baseline |
winter 2017 |
0.957 |
0.000e+00 |
0.383 |
0.447 |
2.441 |
NaN |
NaN |
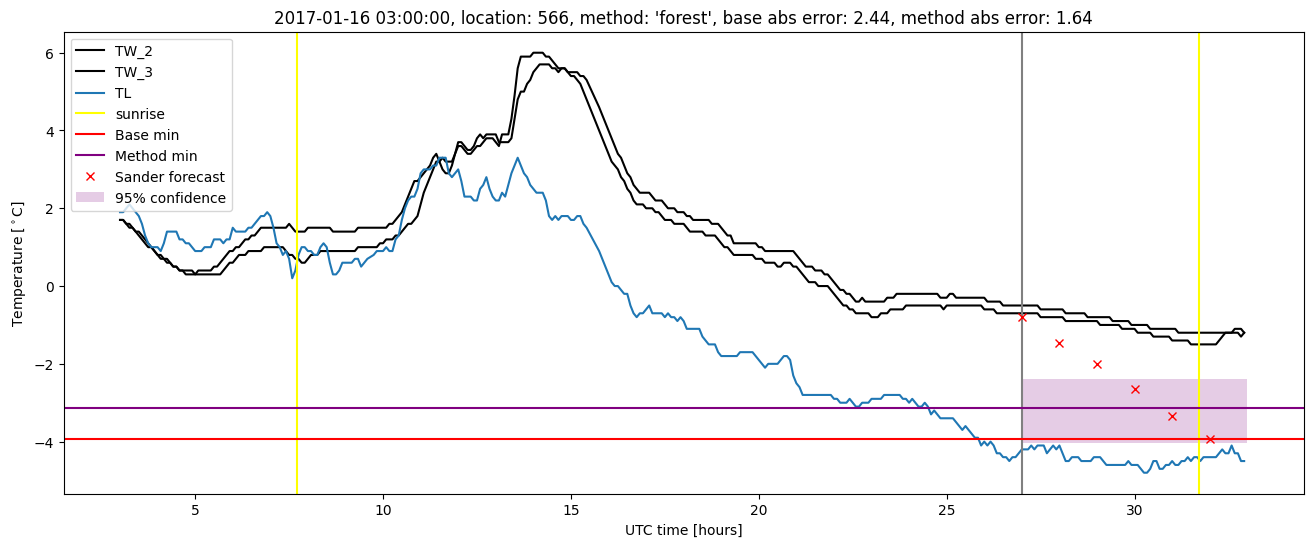
| forest |
winter 2017 |
0.966 |
0.000e+00 |
0.246 |
0.365 |
1.640 |
0.456 |
4.669 |
| baseline |
winter 2018 |
0.987 |
0.042 |
0.268 |
0.405 |
1.433 |
NaN |
NaN |
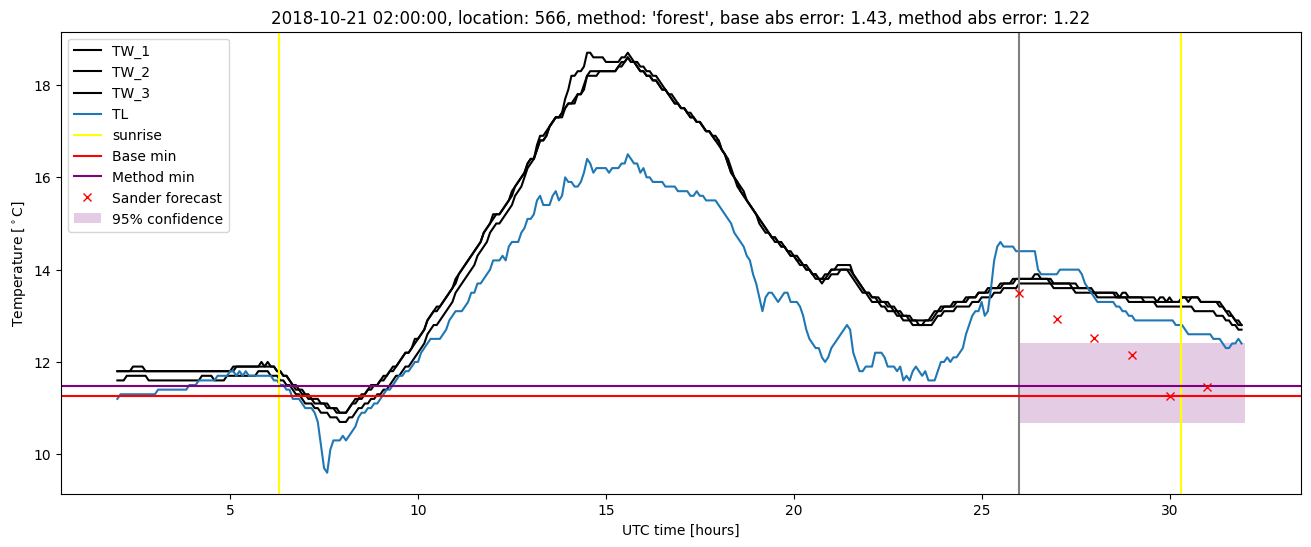
| forest |
winter 2018 |
0.994 |
0.042 |
0.203 |
0.345 |
1.477 |
0.440 |
3.239 |
| baseline |
winter 2019 |
0.993 |
0.000e+00 |
0.274 |
0.392 |
1.486 |
NaN |
NaN |
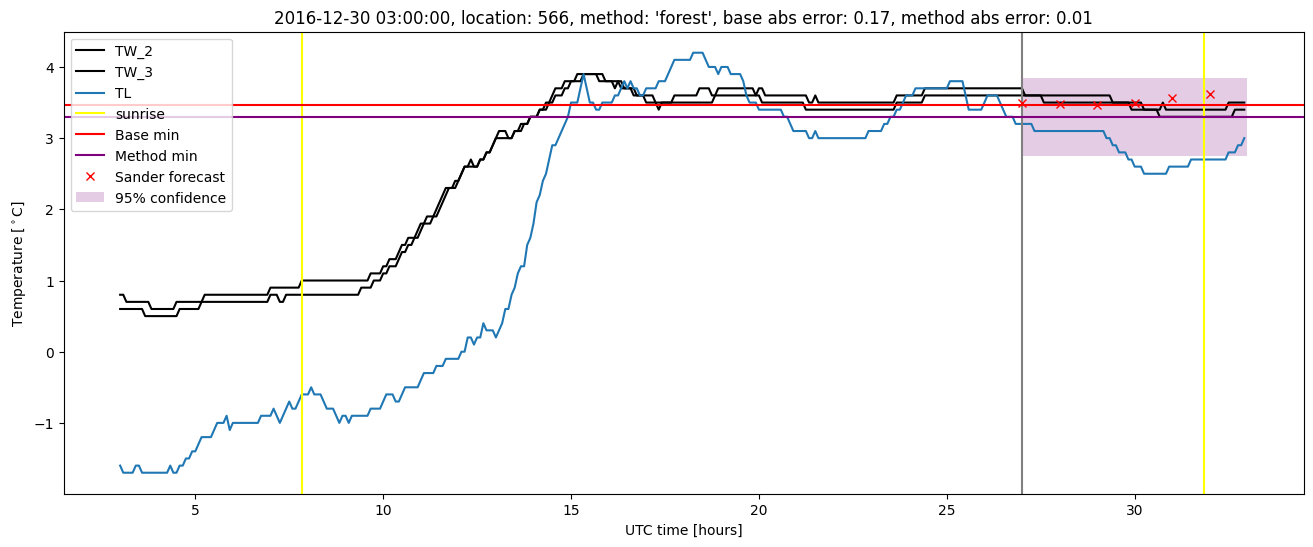
| forest |
winter 2019 |
1.000 |
0.000e+00 |
0.232 |
0.366 |
1.221 |
0.440 |
3.731 |
| baseline |
all |
0.985 |
0.016 |
0.316 |
0.423 |
2.441 |
NaN |
NaN |
| forest |
all |
0.990 |
0.016 |
0.235 |
0.365 |
1.687 |
0.444 |
4.202 |
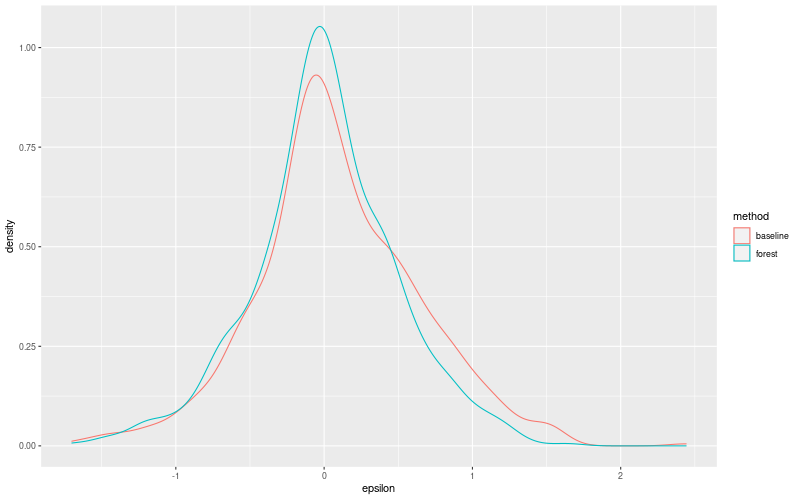
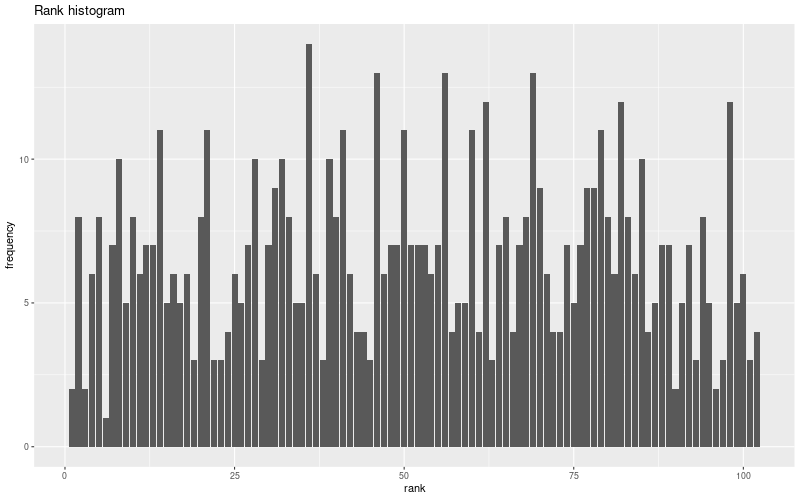
Random forest plots

Extended logistic regression results
| names |
period |
power |
significance |
meanSquareError |
absError |
maxError |
CRPS |
IGN |
| baseline |
winter 2016 |
0.995 |
0.000e+00 |
0.348 |
0.448 |
1.701 |
NaN |
NaN |
| elr |
winter 2016 |
0.995 |
0.000e+00 |
0.276 |
0.411 |
1.645 |
0.490 |
5.185 |
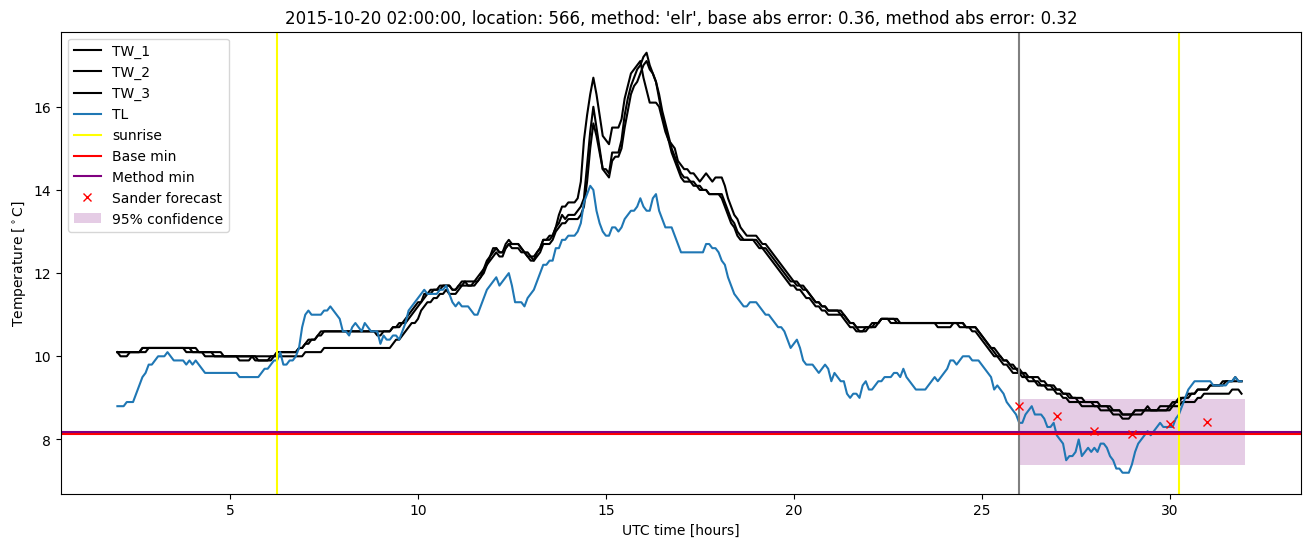
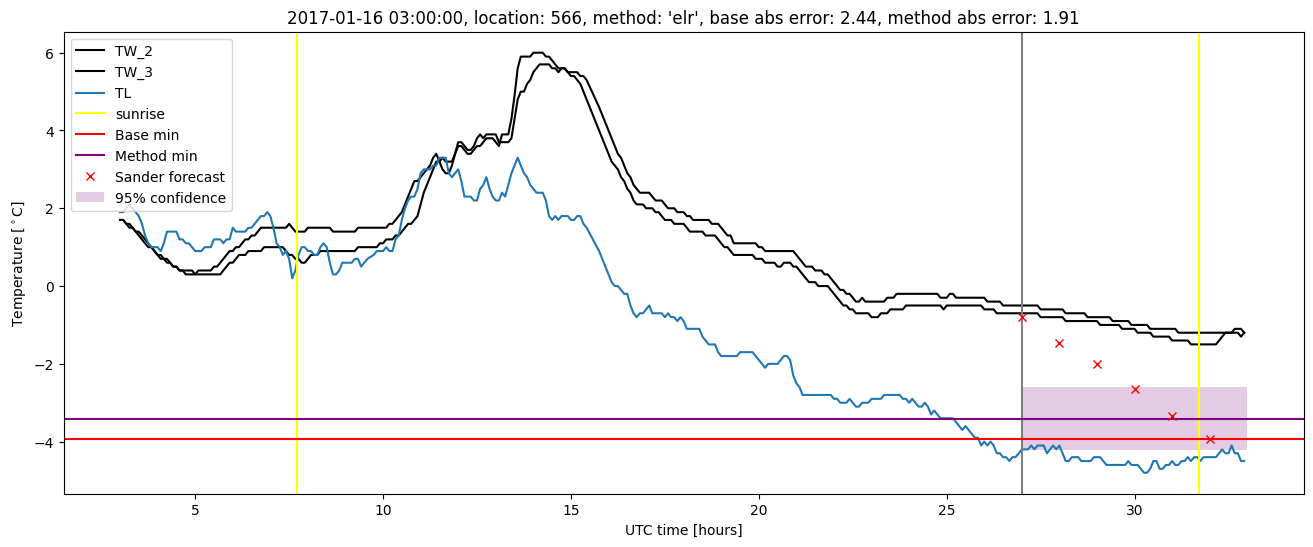
| baseline |
winter 2017 |
0.957 |
0.000e+00 |
0.383 |
0.447 |
2.441 |
NaN |
NaN |
| elr |
winter 2017 |
0.957 |
0.000e+00 |
0.301 |
0.411 |
1.908 |
0.527 |
5.457 |
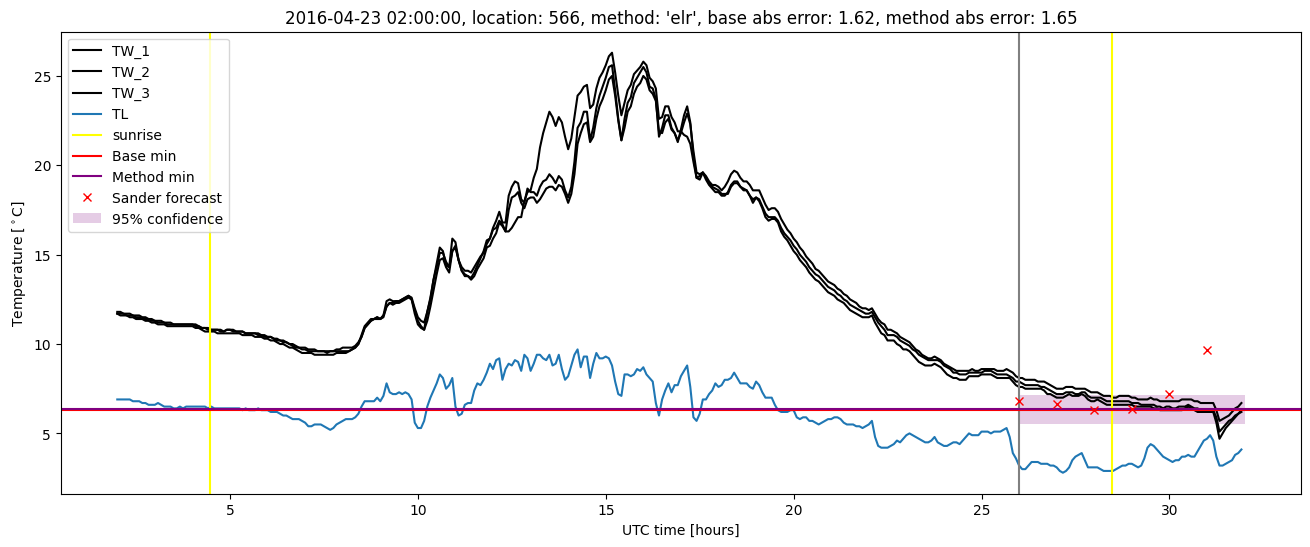
| baseline |
winter 2018 |
0.987 |
0.042 |
0.268 |
0.405 |
1.433 |
NaN |
NaN |
| elr |
winter 2018 |
0.994 |
0.042 |
0.230 |
0.381 |
1.458 |
0.496 |
4.152 |
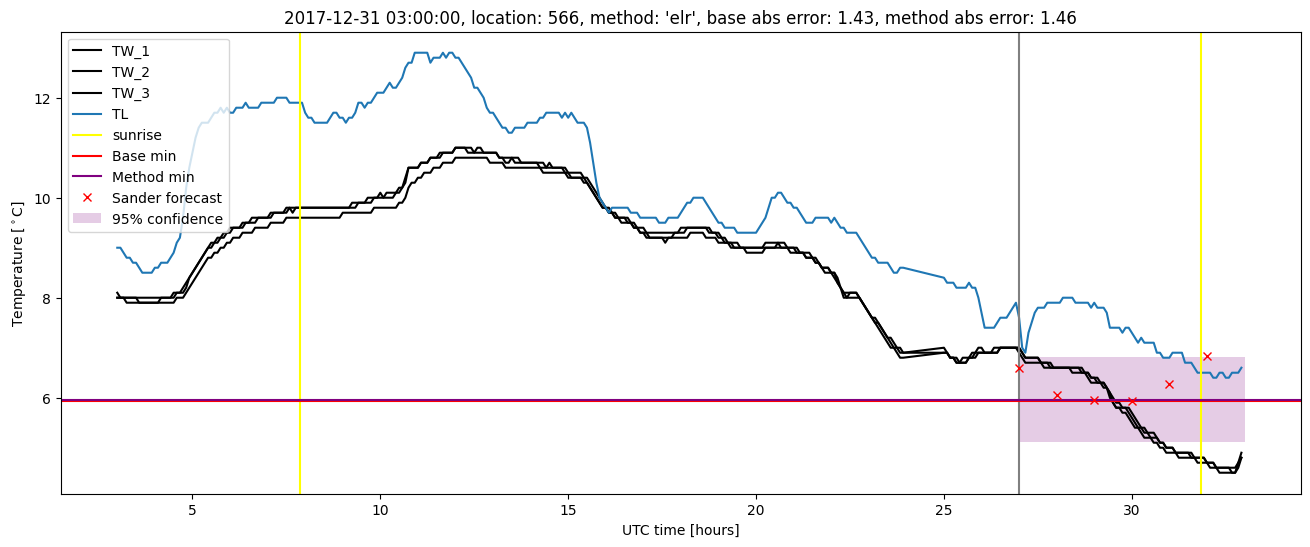
| baseline |
winter 2019 |
0.993 |
0.000e+00 |
0.274 |
0.392 |
1.486 |
NaN |
NaN |
| elr |
winter 2019 |
1.000 |
0.000e+00 |
0.286 |
0.418 |
1.297 |
0.500 |
4.877 |
| baseline |
all |
0.985 |
0.016 |
0.316 |
0.423 |
2.441 |
NaN |
NaN |
| elr |
all |
0.989 |
0.016 |
0.271 |
0.405 |
1.908 |
0.501 |
4.891 |
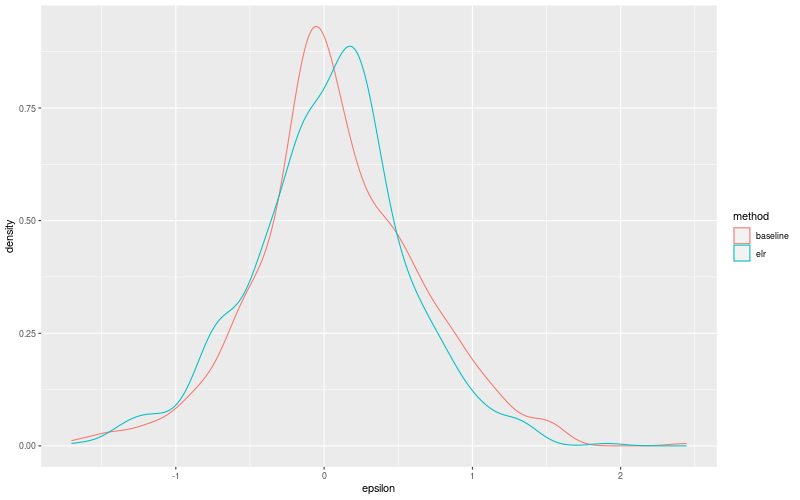
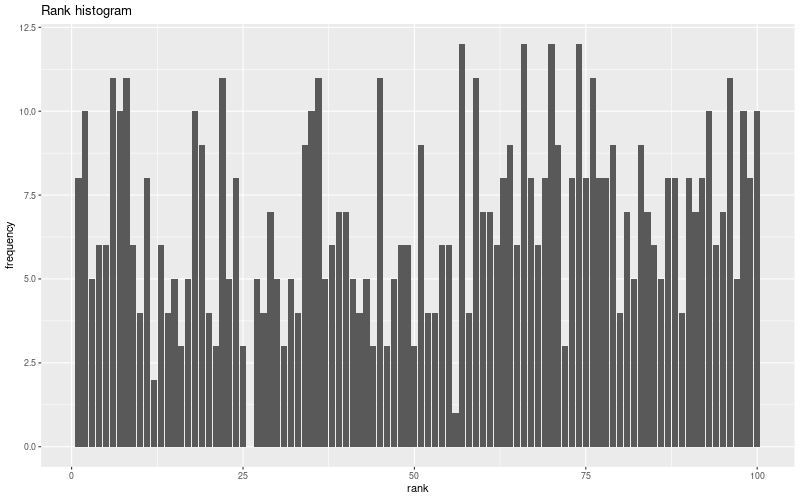
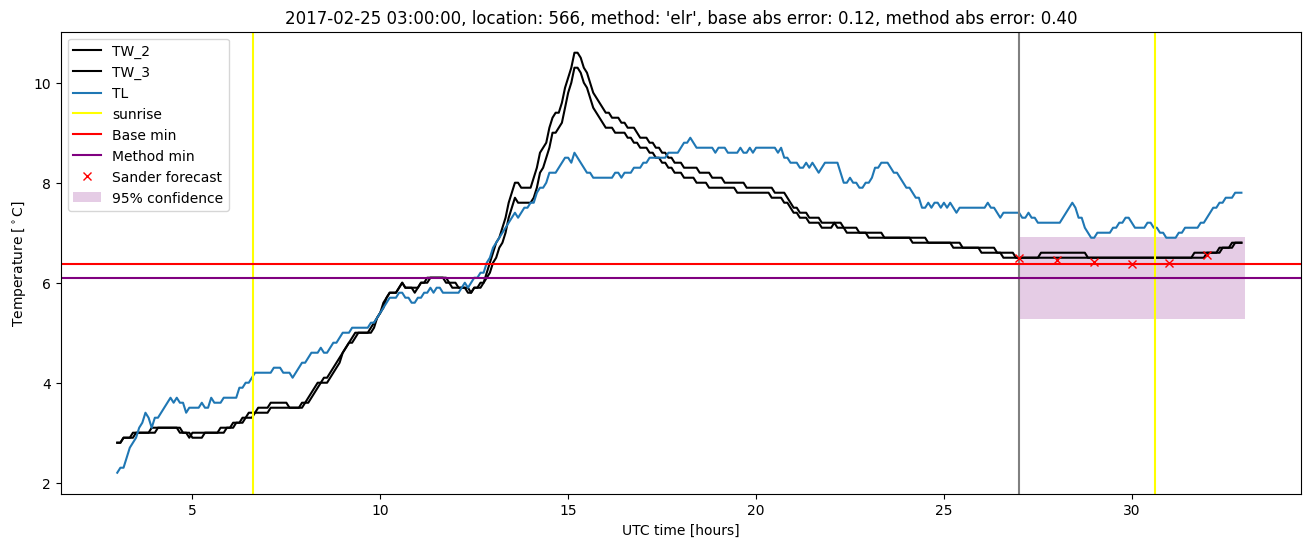
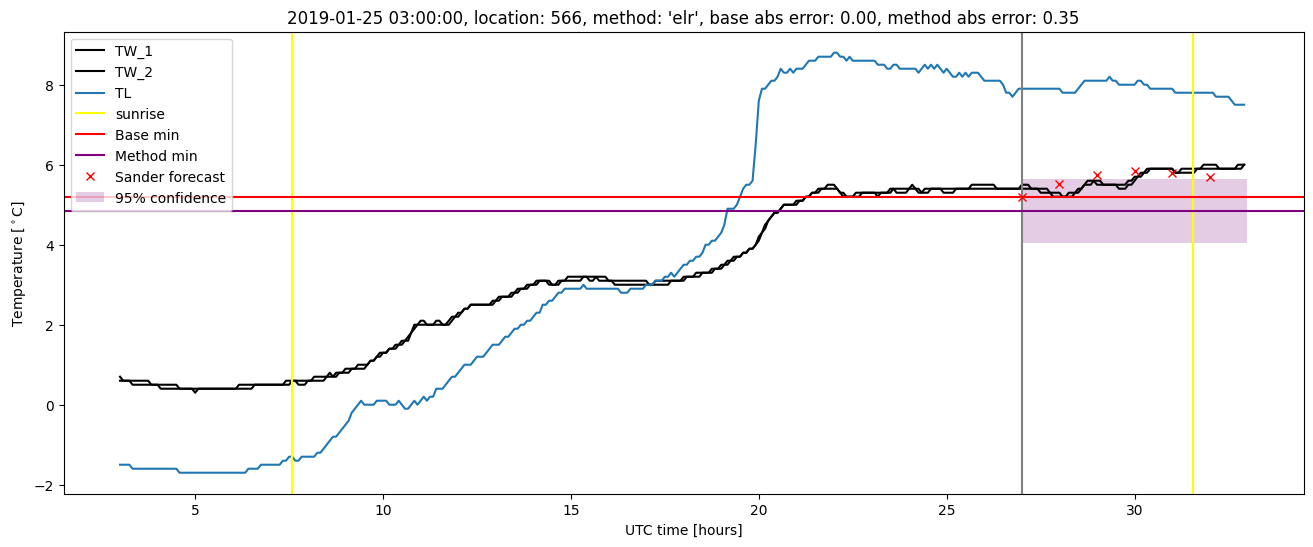
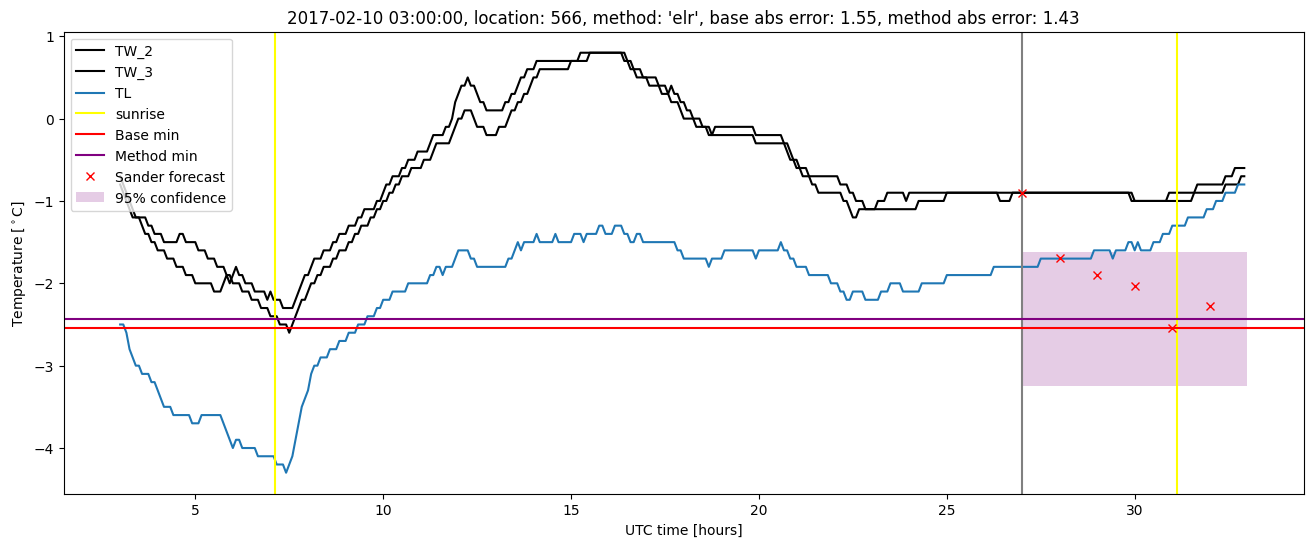
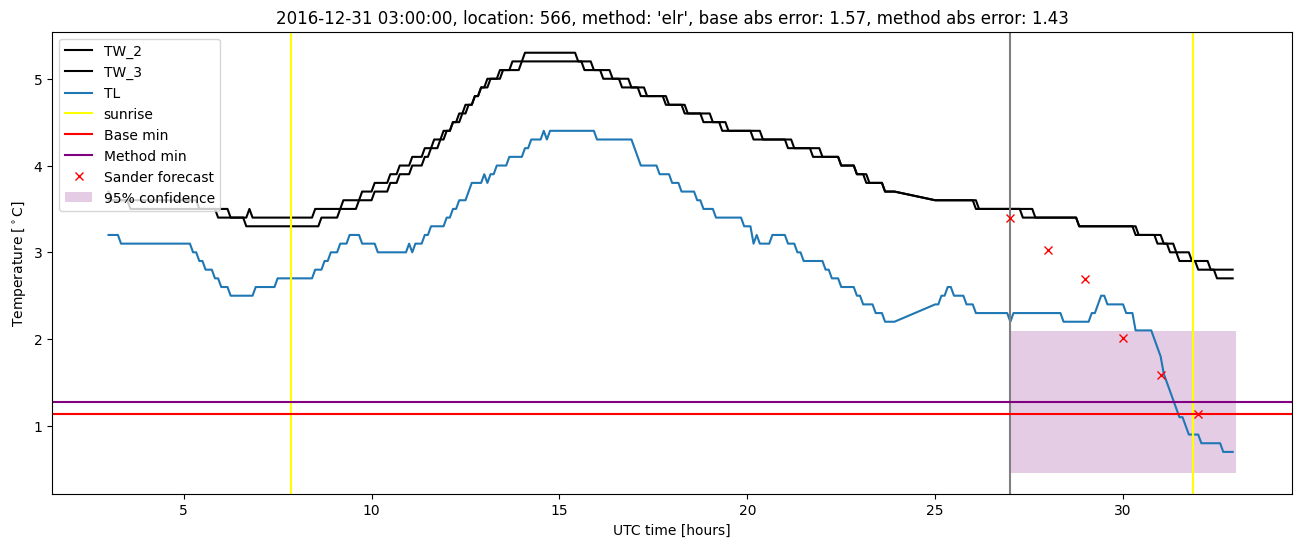
Extended logistic regression plots