GMS location: 565
Random forest results
| names |
period |
power |
significance |
meanSquareError |
absError |
maxError |
CRPS |
IGN |
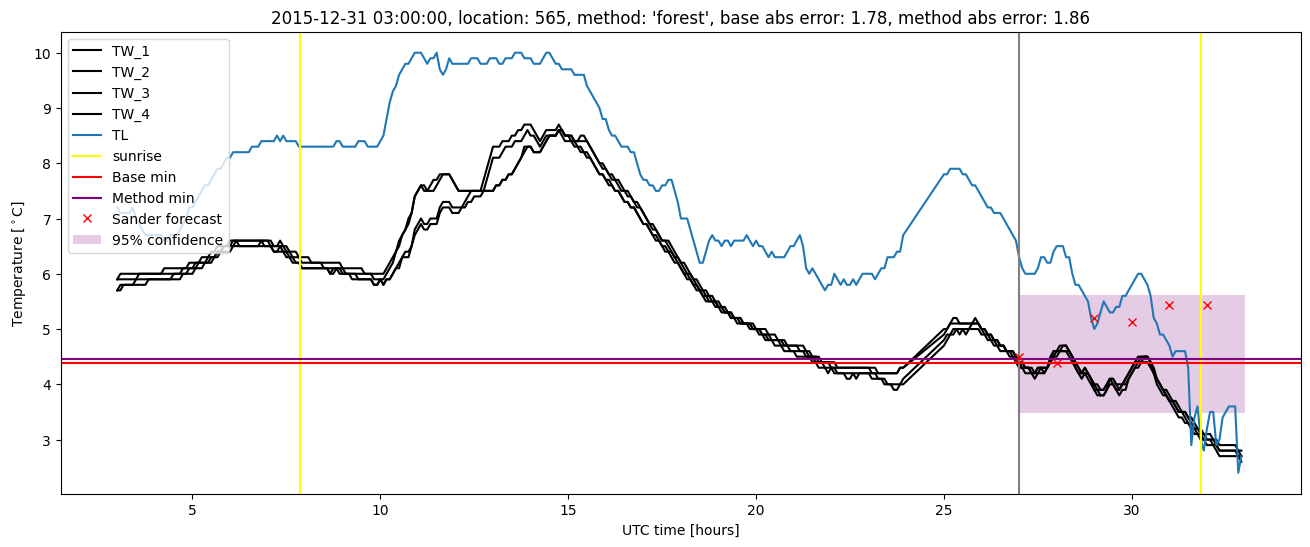
| baseline |
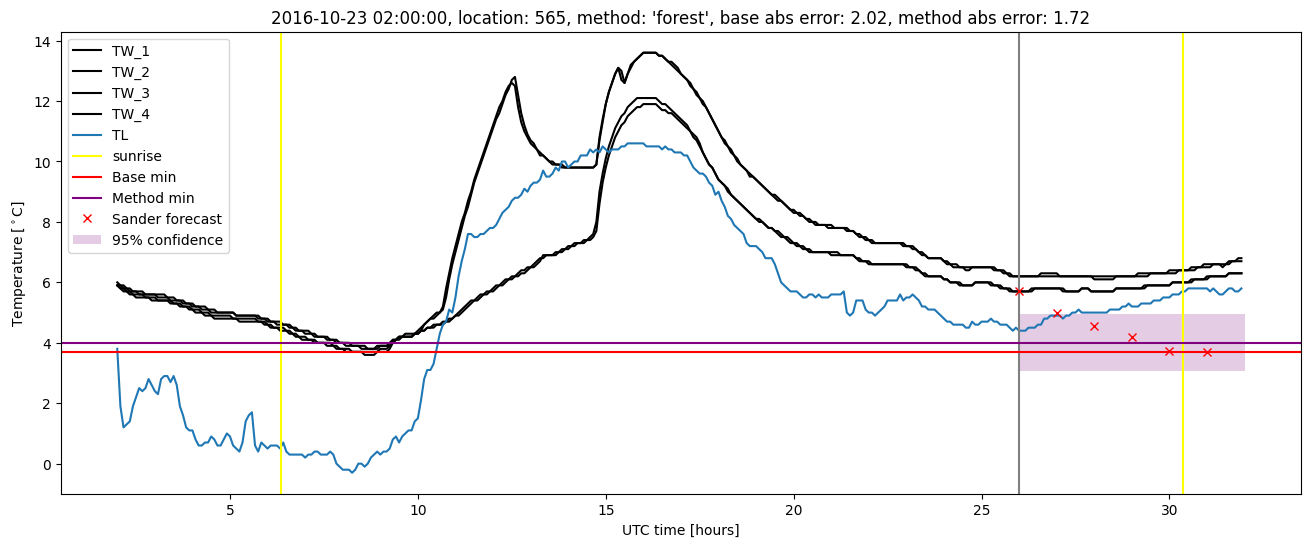
winter 2016 |
0.990 |
0.000e+00 |
0.346 |
0.445 |
1.781 |
NaN |
NaN |
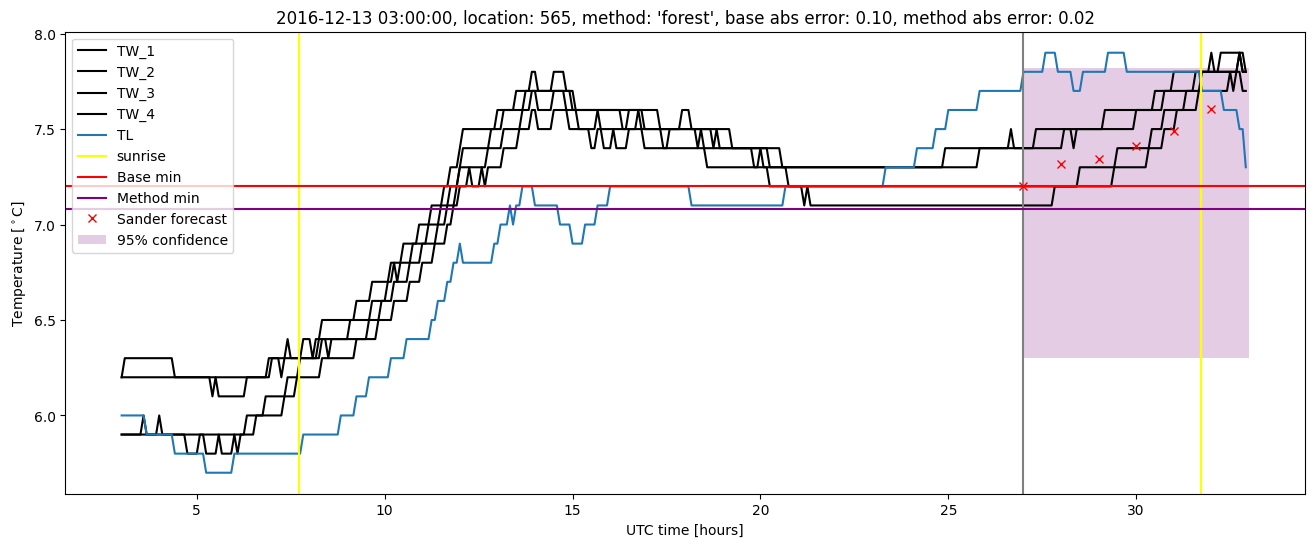
| forest |
winter 2016 |
0.995 |
0.000e+00 |
0.272 |
0.397 |
1.858 |
0.446 |
4.258 |
| baseline |
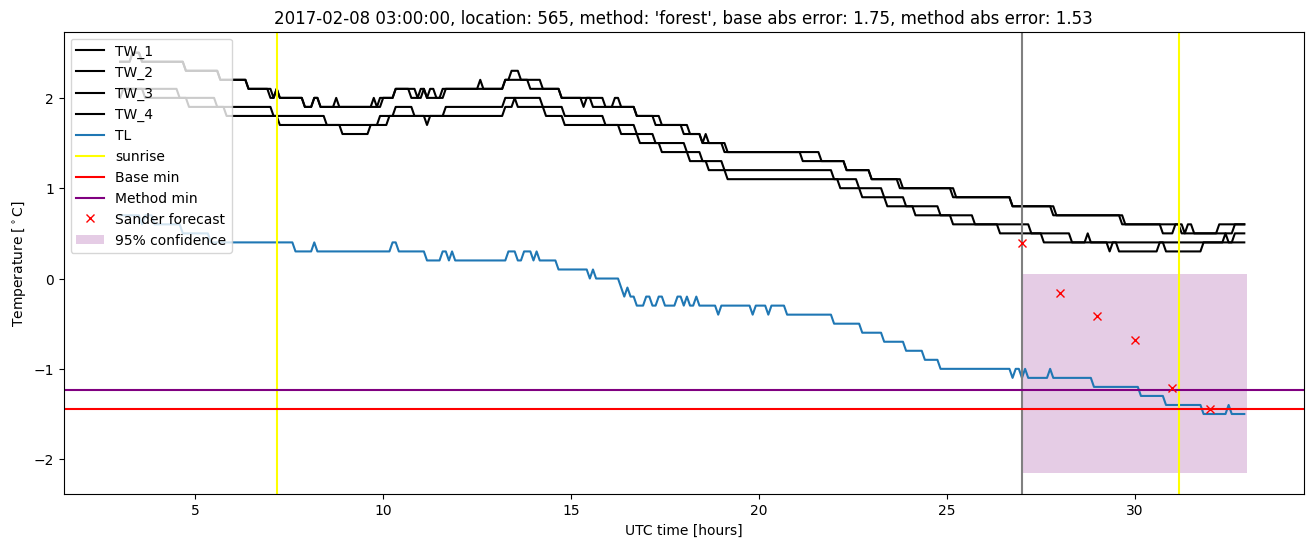
winter 2017 |
0.949 |
0.061 |
0.429 |
0.506 |
2.016 |
NaN |
NaN |
| forest |
winter 2017 |
0.958 |
0.061 |
0.269 |
0.395 |
1.716 |
0.454 |
4.023 |
| baseline |
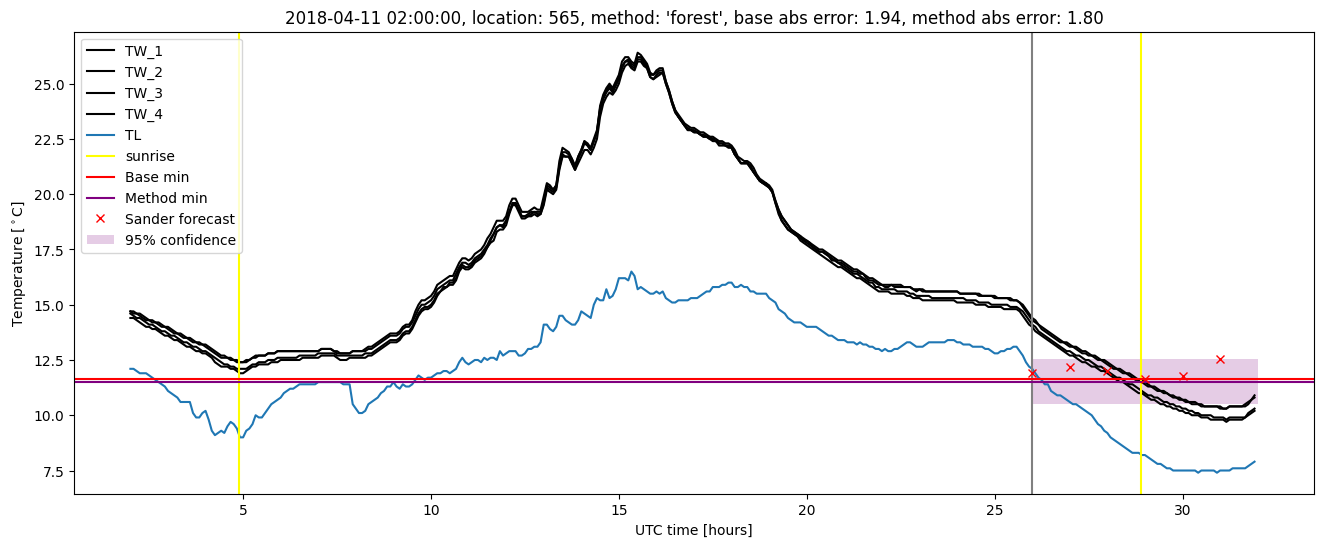
winter 2018 |
1.000 |
0.074 |
0.281 |
0.406 |
1.939 |
NaN |
NaN |
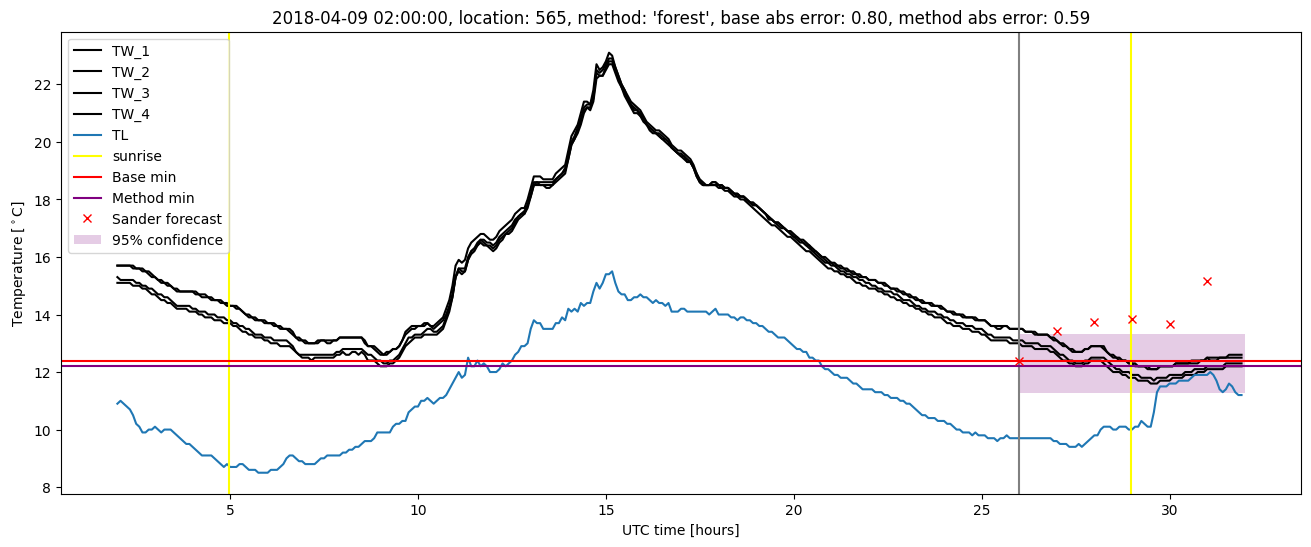
| forest |
winter 2018 |
1.000 |
0.074 |
0.218 |
0.349 |
1.796 |
0.447 |
3.061 |
| baseline |
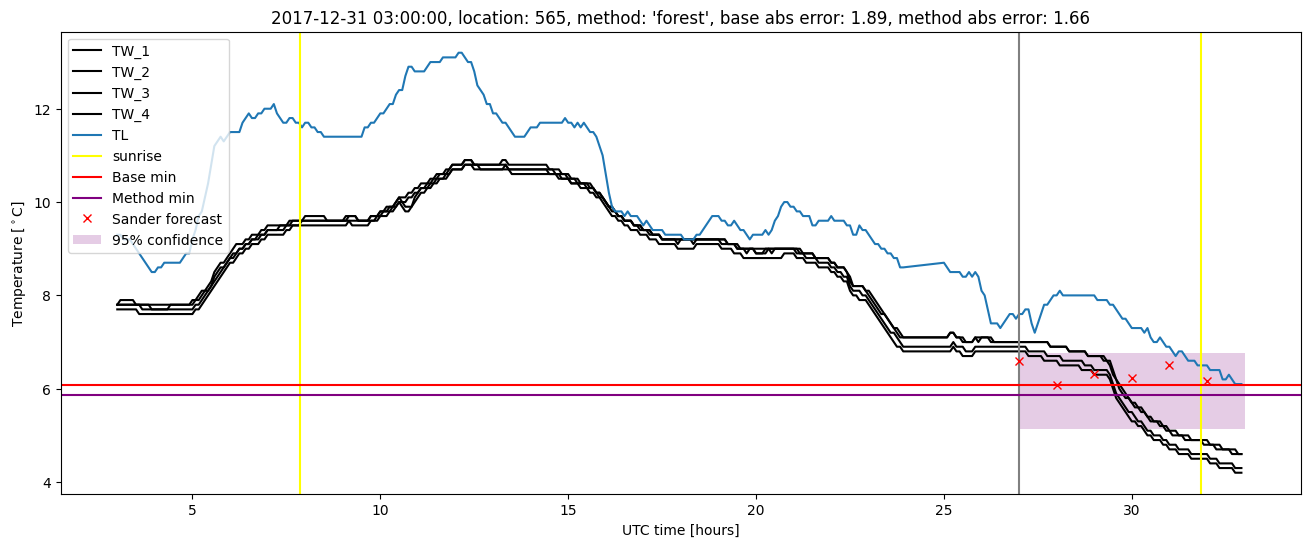
winter 2019 |
0.993 |
0.000e+00 |
0.290 |
0.397 |
1.681 |
NaN |
NaN |
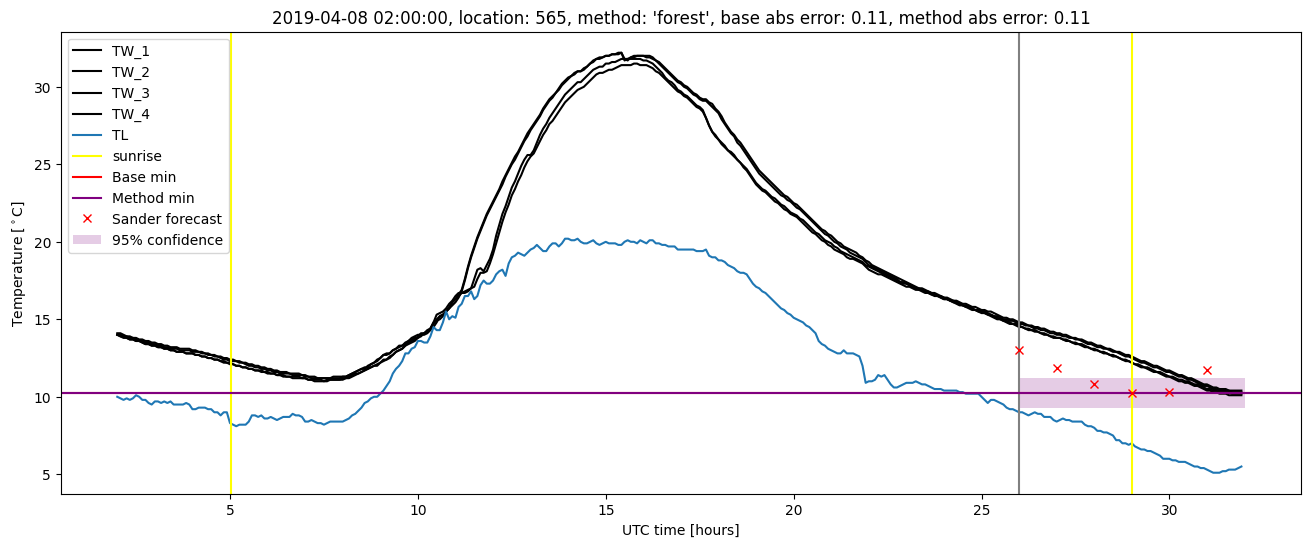
| forest |
winter 2019 |
0.993 |
0.000e+00 |
0.225 |
0.375 |
1.488 |
0.440 |
3.078 |
| baseline |
all |
0.985 |
0.046 |
0.335 |
0.438 |
2.016 |
NaN |
NaN |
| forest |
all |
0.988 |
0.046 |
0.247 |
0.379 |
1.858 |
0.447 |
3.637 |
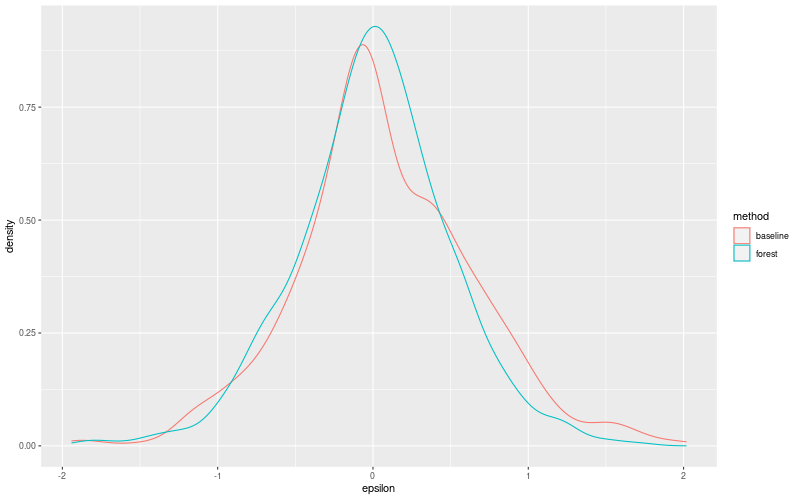
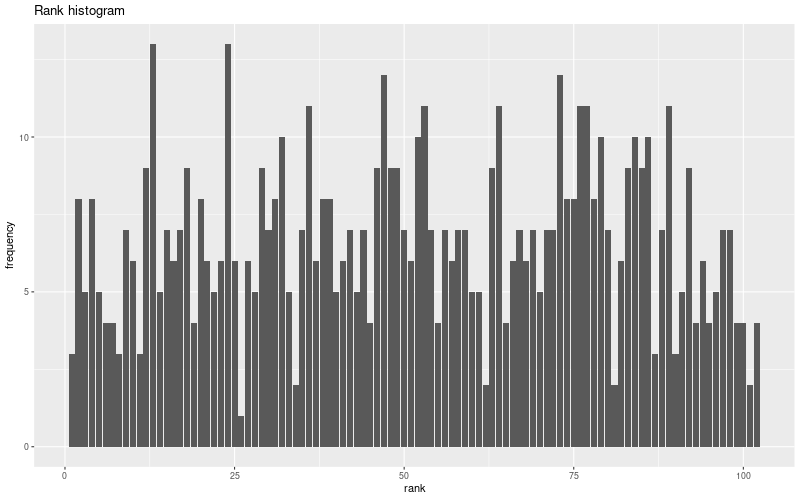
Random forest plots
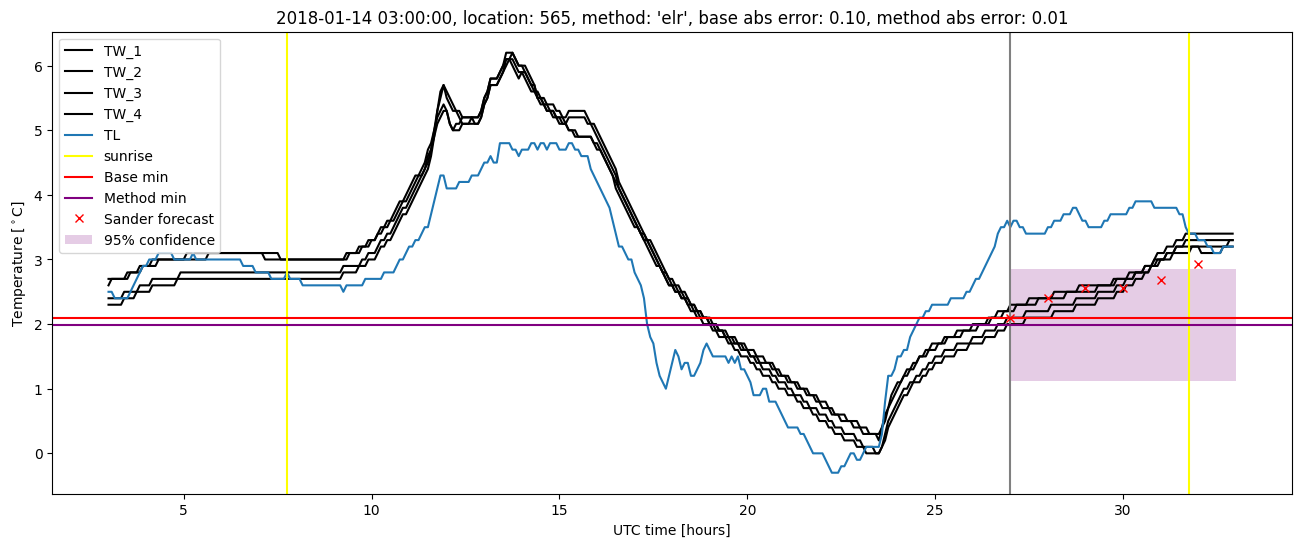
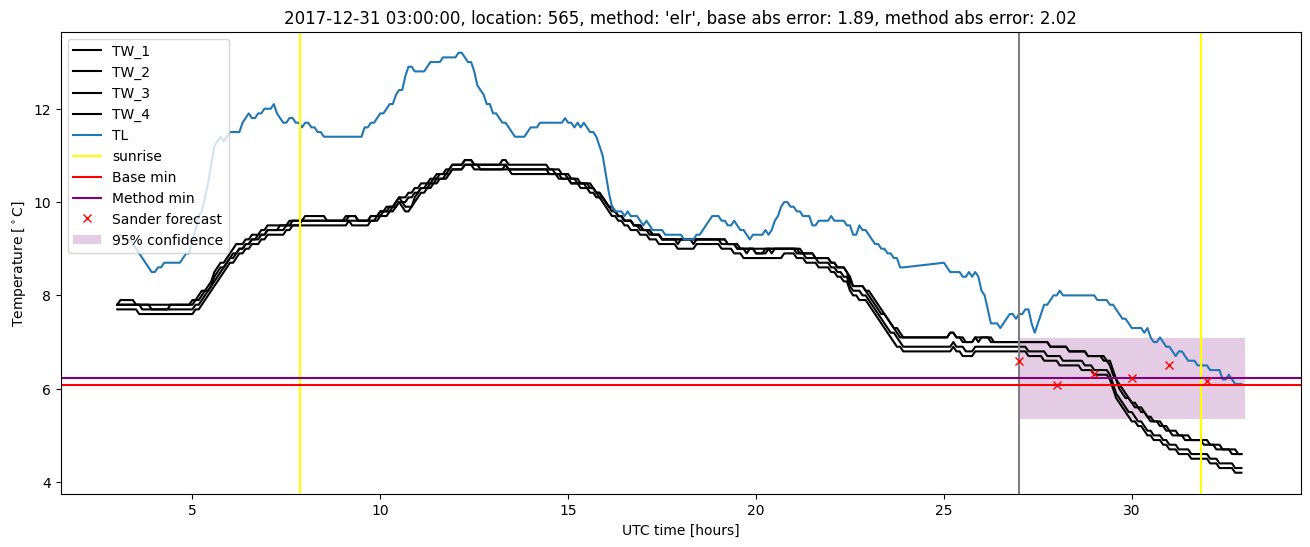
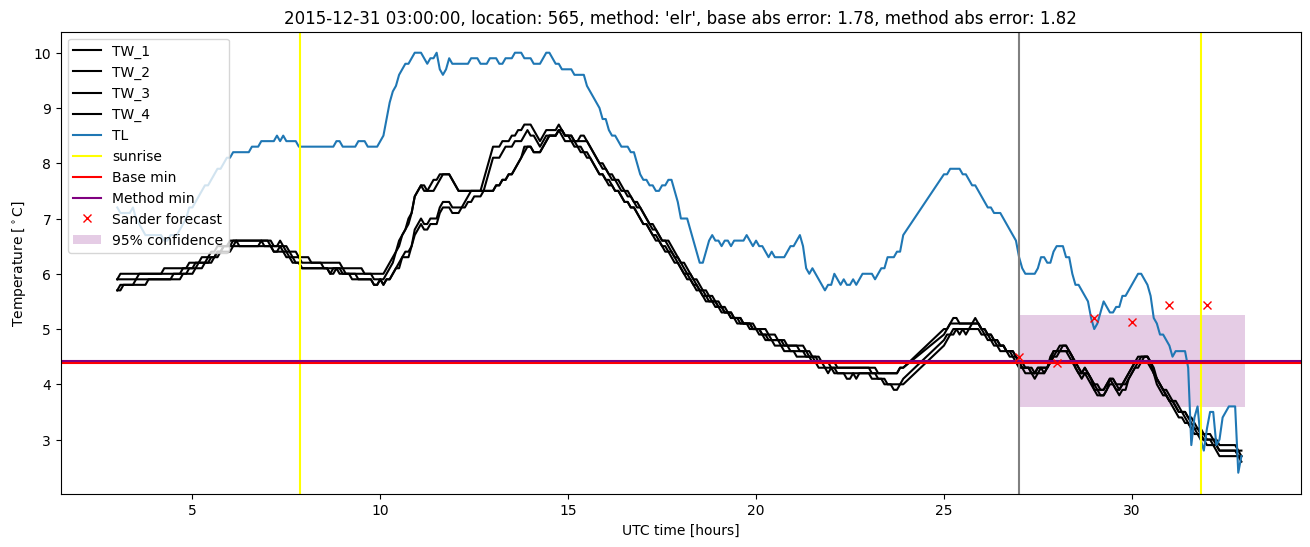
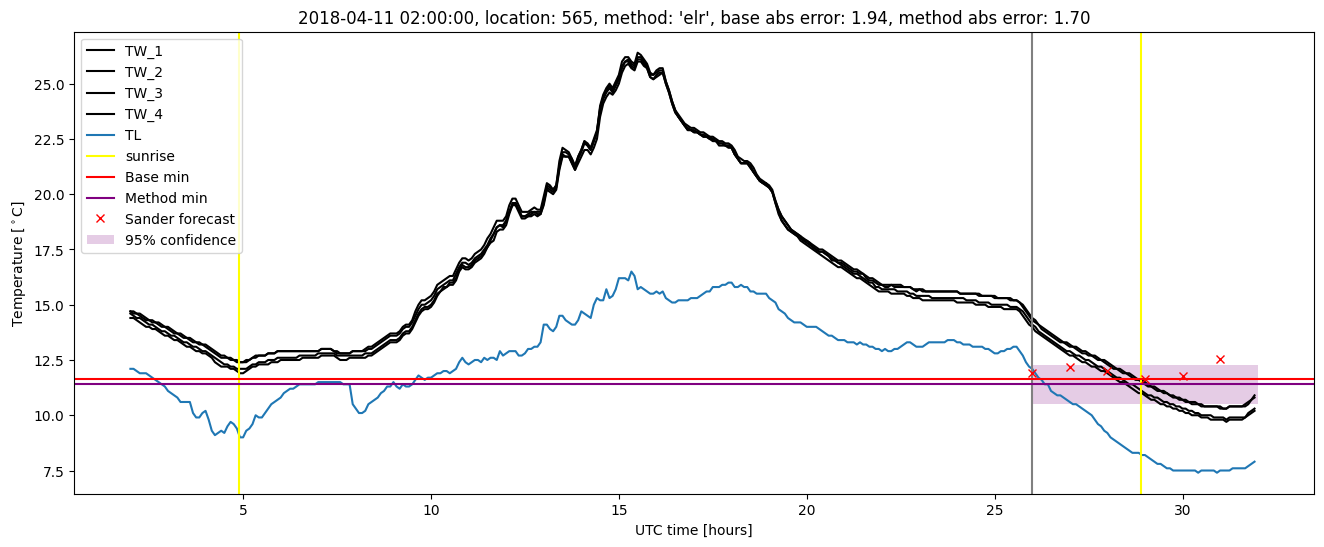
Extended logistic regression results
| names |
period |
power |
significance |
meanSquareError |
absError |
maxError |
CRPS |
IGN |
| baseline |
winter 2016 |
0.990 |
0.000e+00 |
0.346 |
0.445 |
1.781 |
NaN |
NaN |
| elr |
winter 2016 |
0.995 |
0.000e+00 |
0.320 |
0.440 |
1.822 |
0.506 |
4.646 |
| baseline |
winter 2017 |
0.949 |
0.061 |
0.429 |
0.506 |
2.016 |
NaN |
NaN |
| elr |
winter 2017 |
0.958 |
0.030 |
0.338 |
0.451 |
1.690 |
0.494 |
4.911 |
| baseline |
winter 2018 |
1.000 |
0.074 |
0.281 |
0.406 |
1.939 |
NaN |
NaN |
| elr |
winter 2018 |
1.000 |
0.037 |
0.237 |
0.371 |
2.020 |
0.504 |
3.950 |
| baseline |
winter 2019 |
0.993 |
0.000e+00 |
0.290 |
0.397 |
1.681 |
NaN |
NaN |
| elr |
winter 2019 |
0.993 |
0.000e+00 |
0.244 |
0.390 |
1.577 |
0.502 |
4.478 |
| baseline |
all |
0.985 |
0.046 |
0.335 |
0.438 |
2.016 |
NaN |
NaN |
| elr |
all |
0.988 |
0.023 |
0.286 |
0.413 |
2.020 |
0.502 |
4.493 |
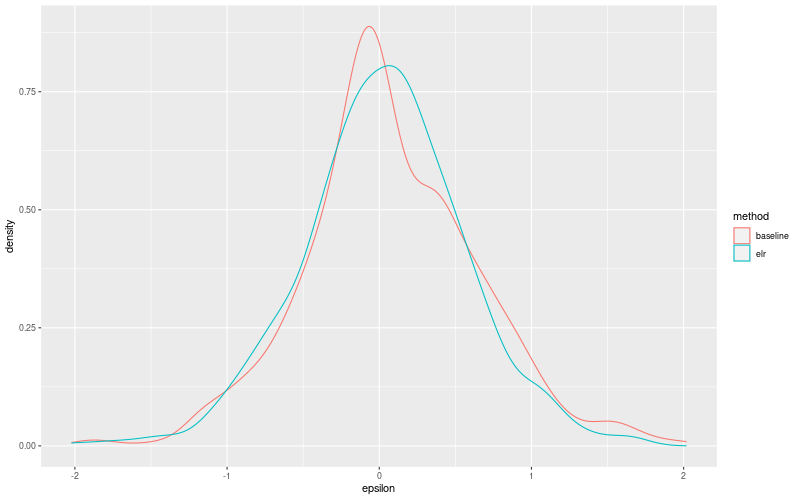
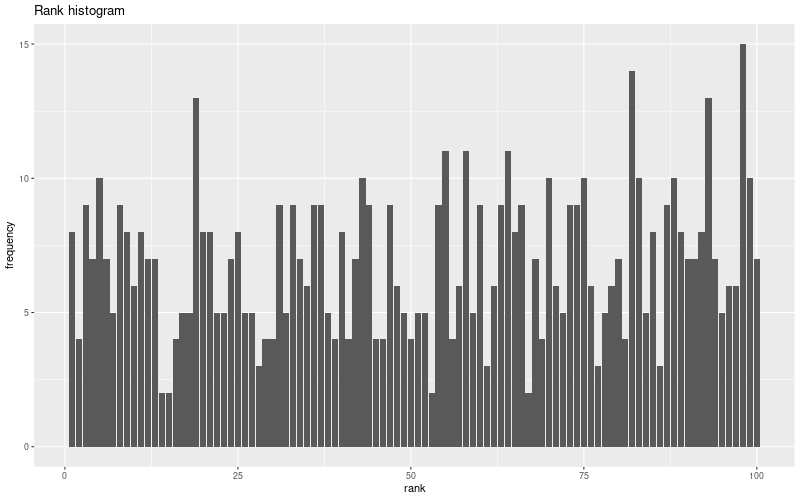
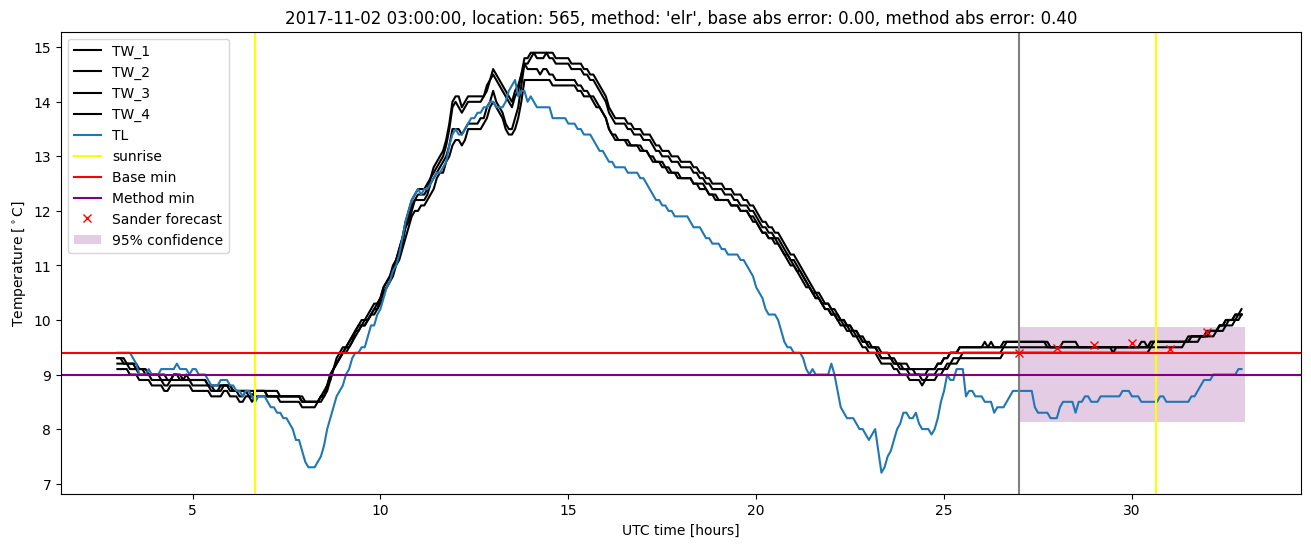
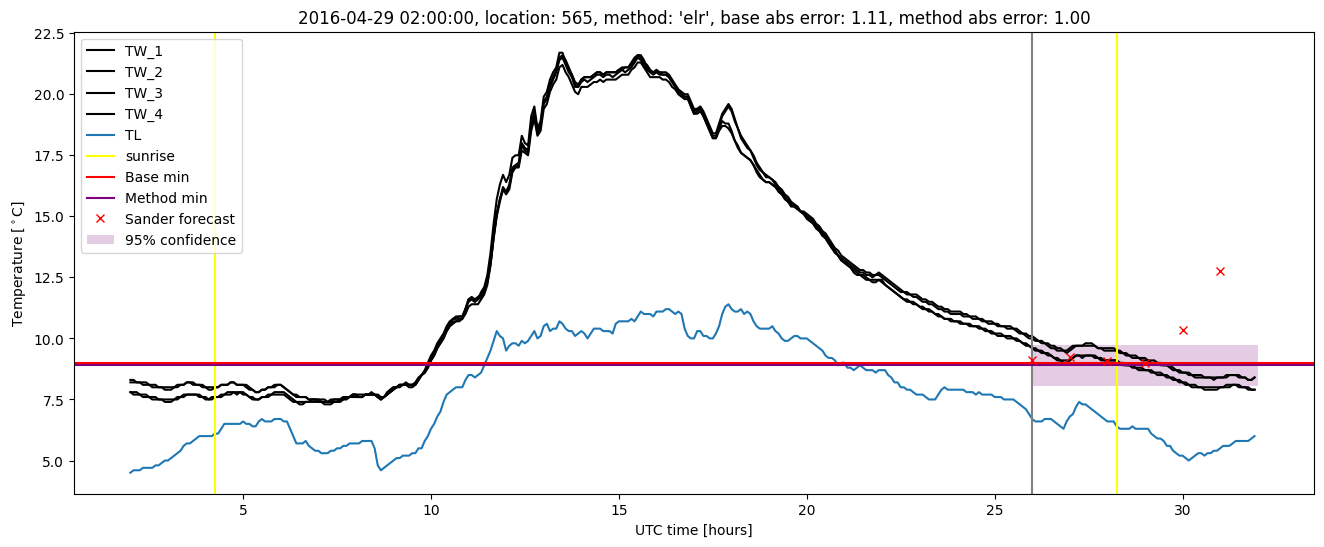
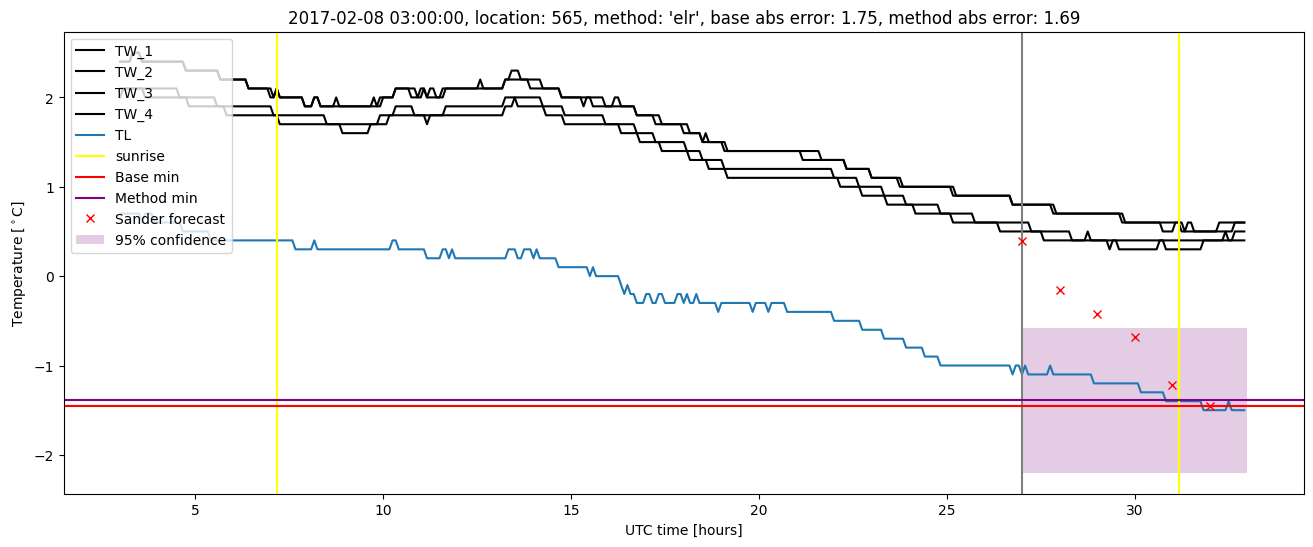
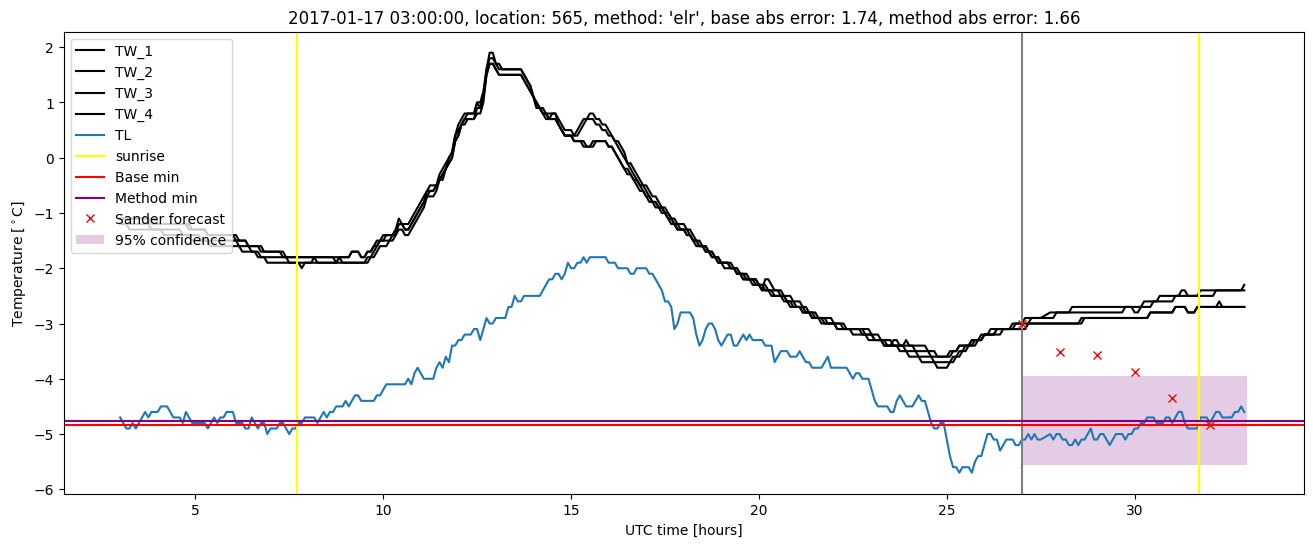
Extended logistic regression plots