GMS location: 564
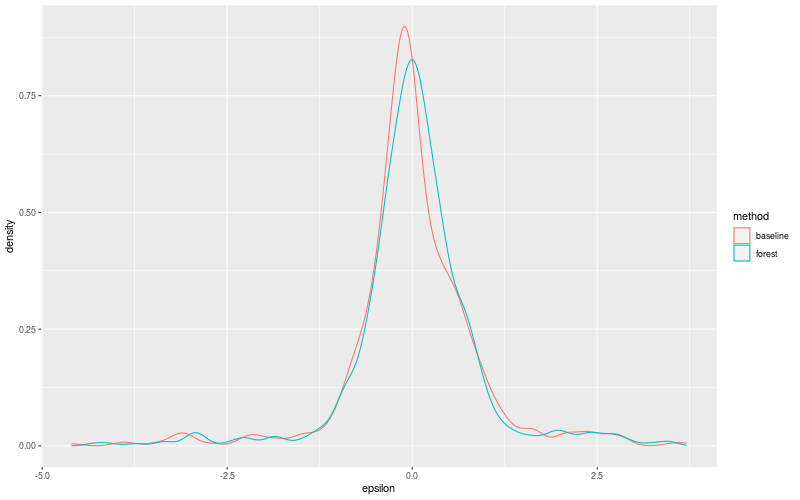
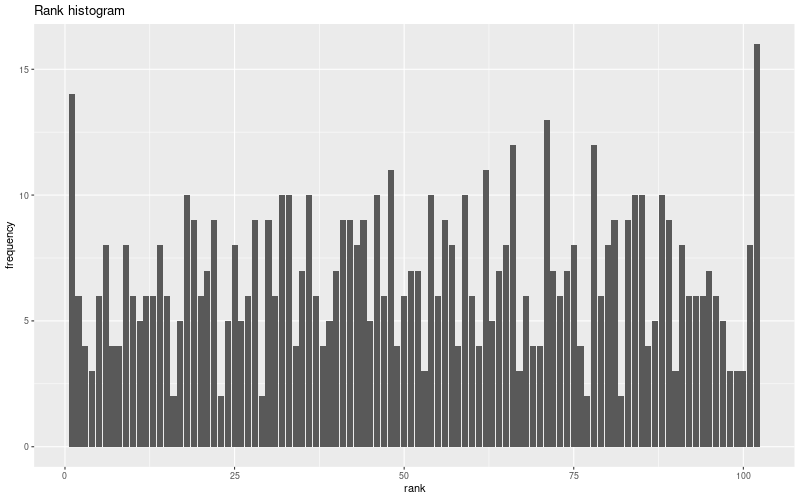
Random forest results
| names |
period |
power |
significance |
meanSquareError |
absError |
maxError |
CRPS |
IGN |
| baseline |
winter 2016 |
0.977 |
0.103 |
1.715 |
0.858 |
4.598 |
NaN |
NaN |
| forest |
winter 2016 |
0.983 |
0.138 |
1.669 |
0.848 |
4.296 |
0.479 |
2.914 |
| baseline |
winter 2017 |
0.954 |
0.000e+00 |
0.378 |
0.446 |
2.142 |
NaN |
NaN |
| forest |
winter 2017 |
0.962 |
0.000e+00 |
0.353 |
0.429 |
1.968 |
0.477 |
1.343 |
| baseline |
winter 2018 |
0.981 |
0.045 |
0.418 |
0.467 |
3.069 |
NaN |
NaN |
| forest |
winter 2018 |
0.987 |
0.091 |
0.362 |
0.424 |
3.041 |
0.472 |
1.366 |
| baseline |
winter 2019 |
0.993 |
0.100 |
0.259 |
0.367 |
2.099 |
NaN |
NaN |
| forest |
winter 2019 |
1.000 |
0.000e+00 |
0.260 |
0.377 |
1.995 |
0.489 |
1.390 |
| baseline |
all |
0.977 |
0.059 |
0.762 |
0.557 |
4.598 |
NaN |
NaN |
| forest |
all |
0.984 |
0.071 |
0.728 |
0.542 |
4.296 |
0.479 |
1.829 |
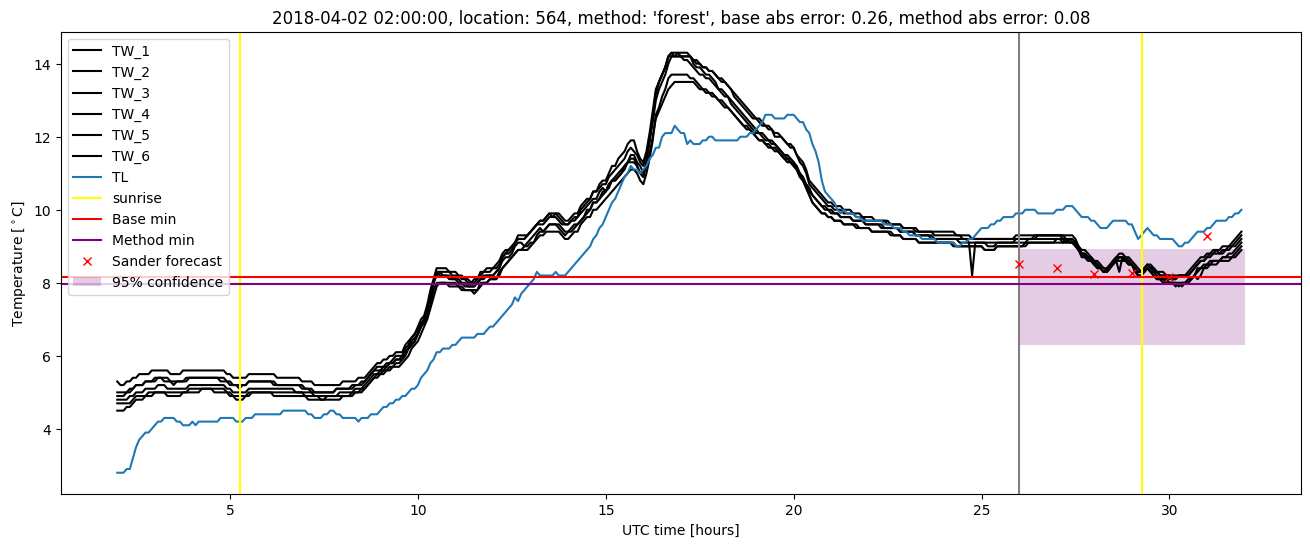
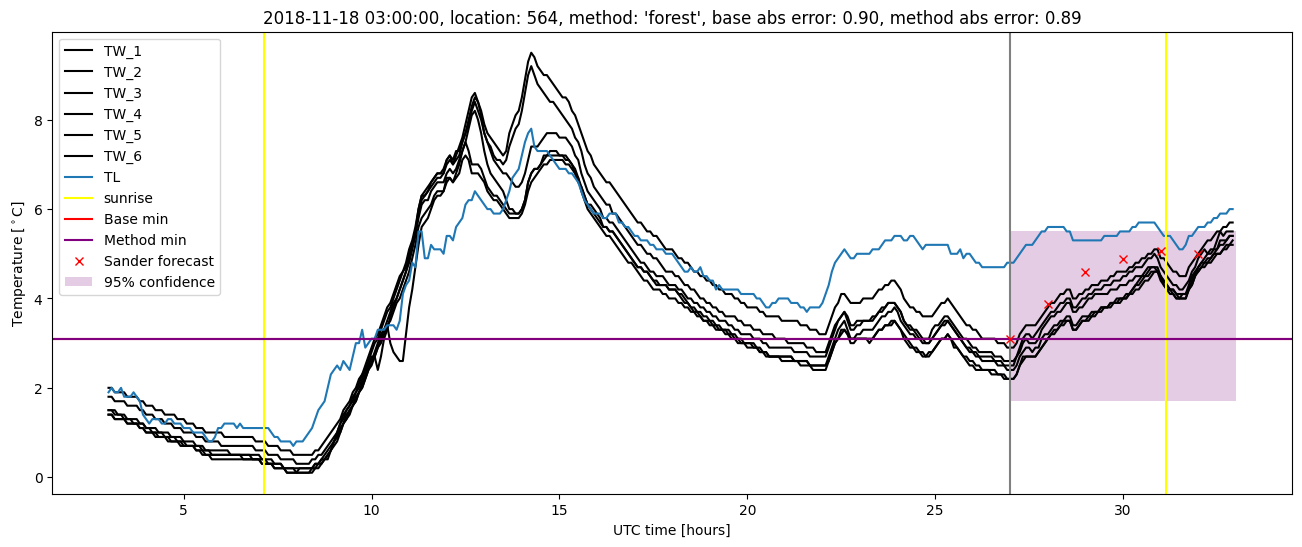
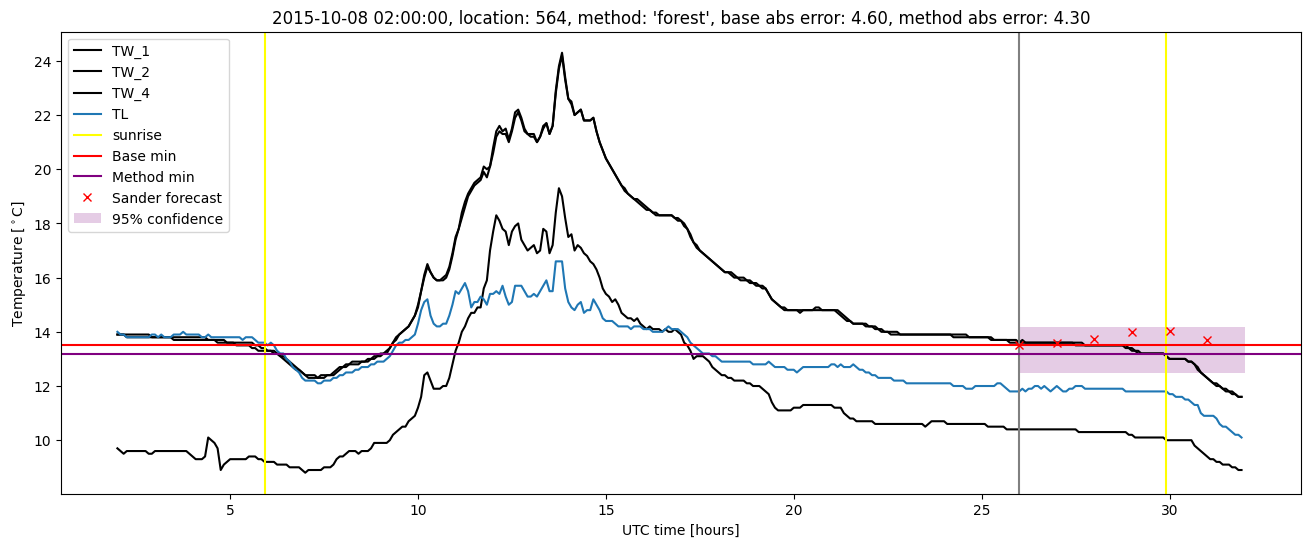
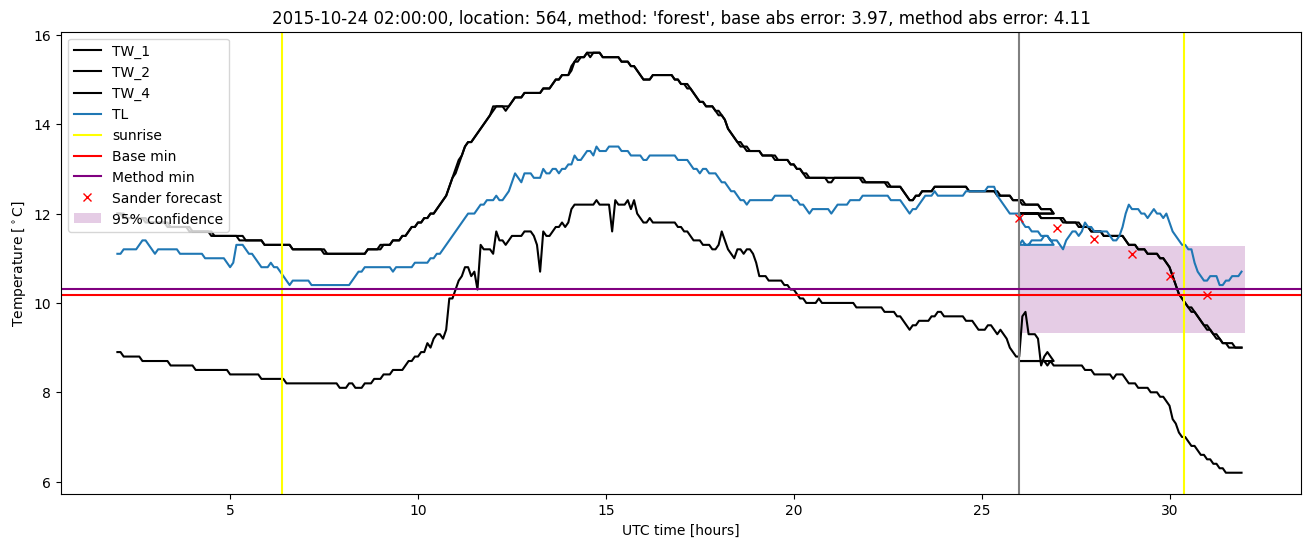
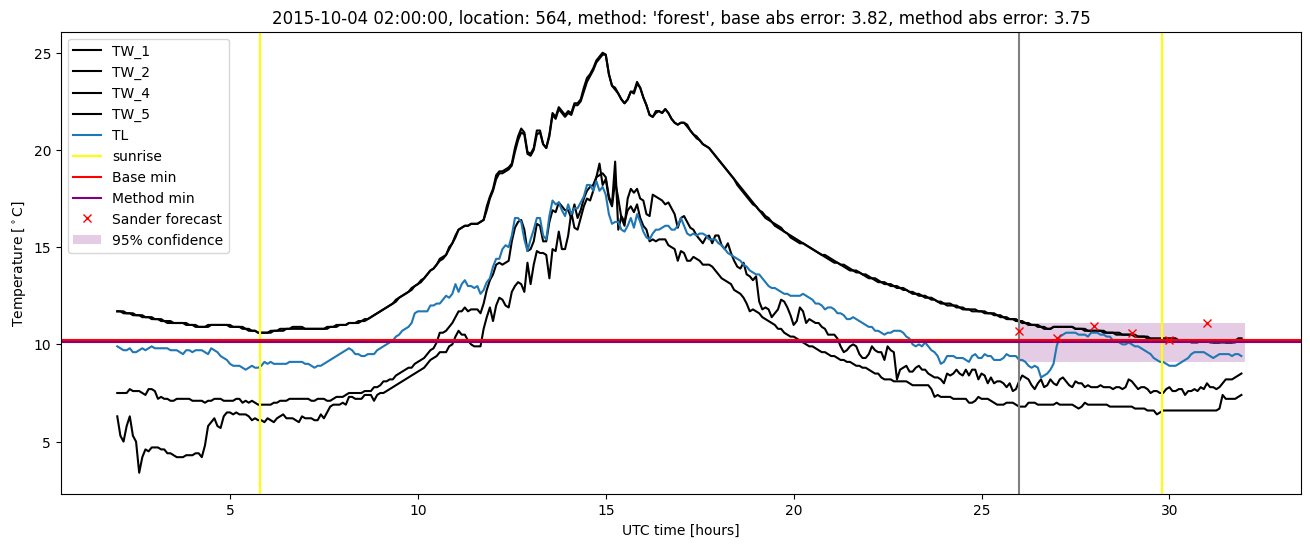
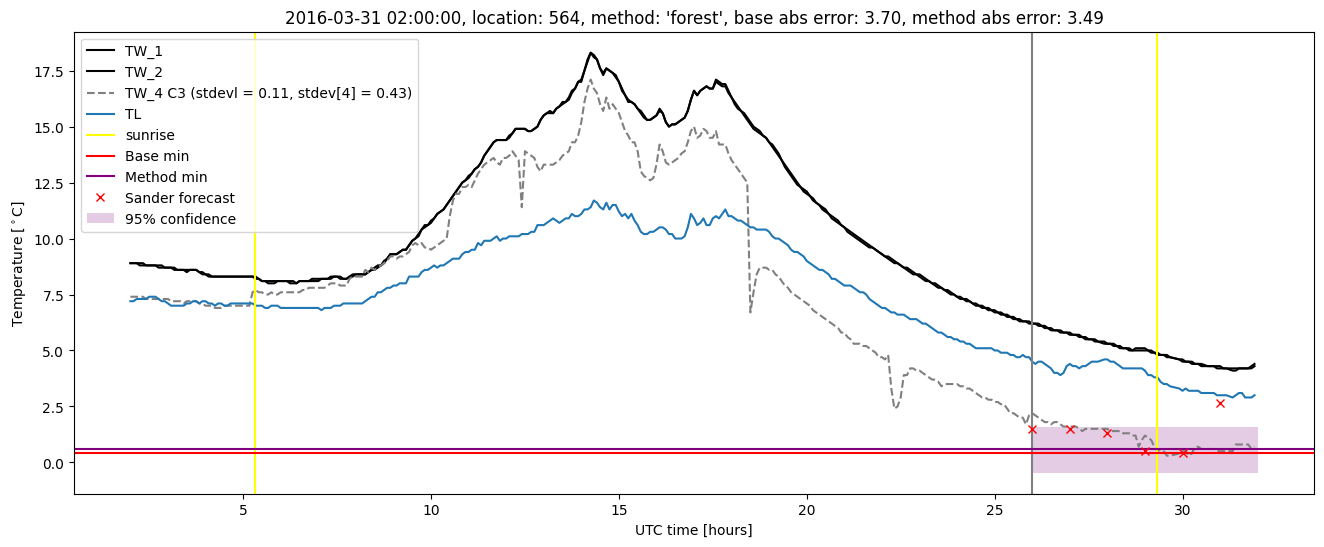
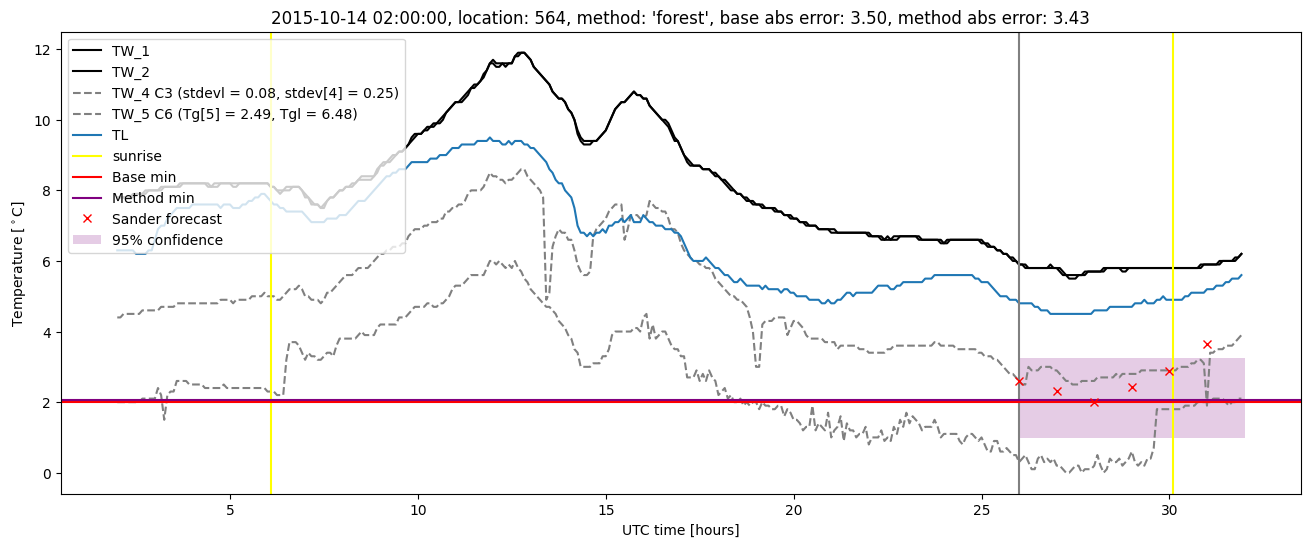
Random forest plots

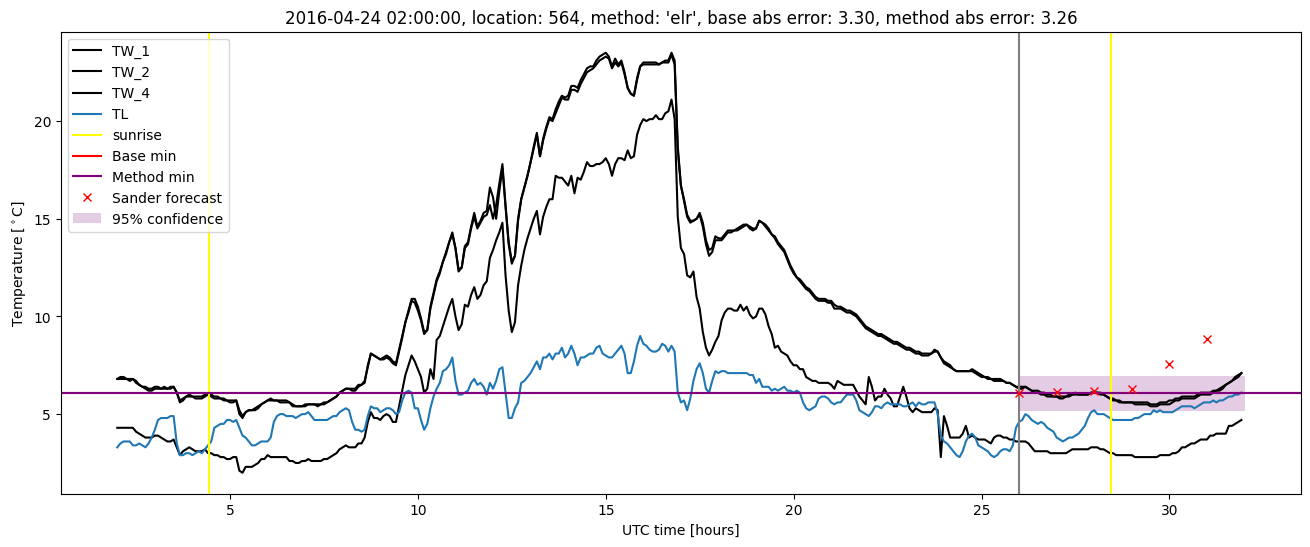
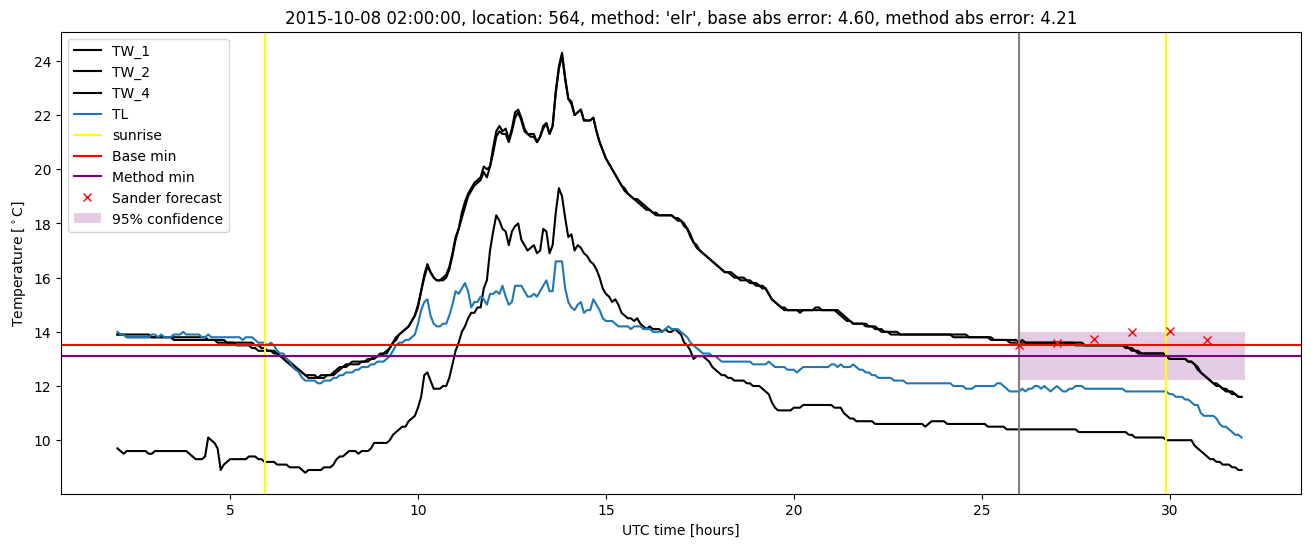
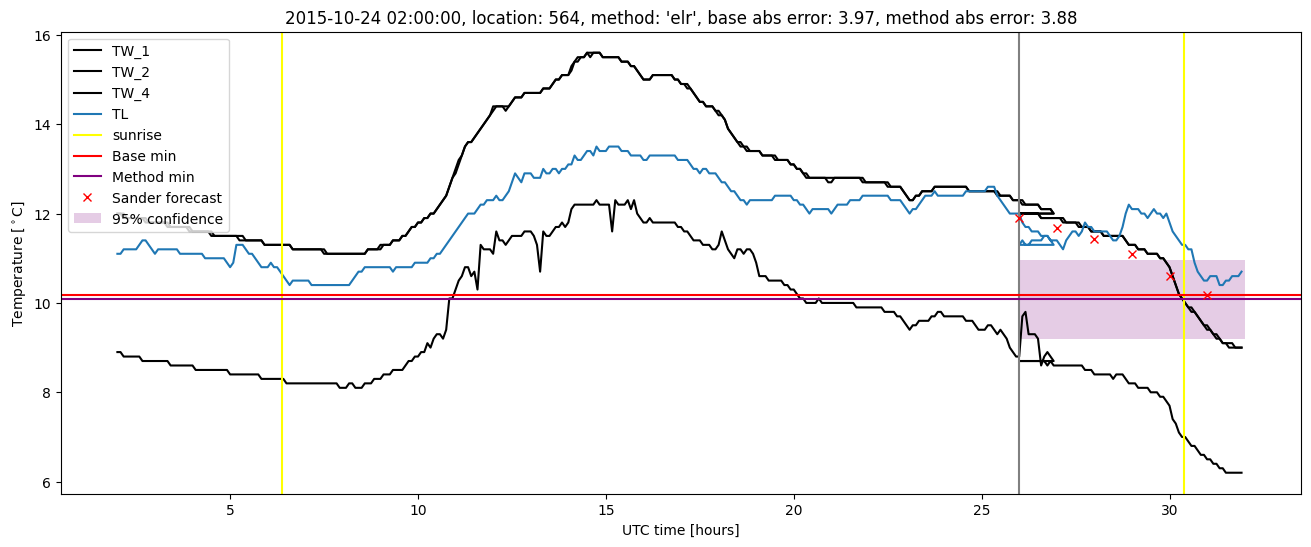
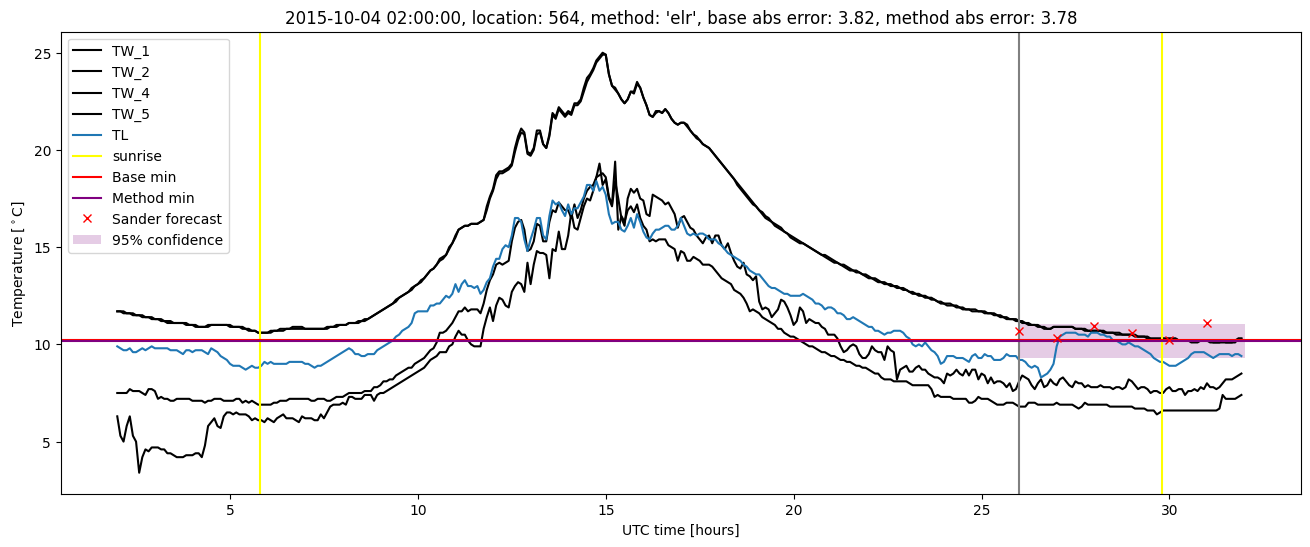
Extended logistic regression results
| names |
period |
power |
significance |
meanSquareError |
absError |
maxError |
CRPS |
IGN |
| baseline |
winter 2016 |
0.977 |
0.103 |
1.715 |
0.858 |
4.598 |
NaN |
NaN |
| elr |
winter 2016 |
0.983 |
0.103 |
1.753 |
0.863 |
4.206 |
0.554 |
4.291 |
| baseline |
winter 2017 |
0.954 |
0.000e+00 |
0.378 |
0.446 |
2.142 |
NaN |
NaN |
| elr |
winter 2017 |
0.969 |
0.000e+00 |
0.354 |
0.470 |
1.970 |
0.508 |
1.441 |
| baseline |
winter 2018 |
0.981 |
0.045 |
0.418 |
0.467 |
3.069 |
NaN |
NaN |
| elr |
winter 2018 |
0.987 |
0.045 |
0.485 |
0.521 |
3.146 |
0.541 |
1.638 |
| baseline |
winter 2019 |
0.993 |
0.100 |
0.259 |
0.367 |
2.099 |
NaN |
NaN |
| elr |
winter 2019 |
0.993 |
0.100 |
0.311 |
0.427 |
2.188 |
0.504 |
1.425 |
| baseline |
all |
0.977 |
0.059 |
0.762 |
0.557 |
4.598 |
NaN |
NaN |
| elr |
all |
0.984 |
0.059 |
0.797 |
0.591 |
4.206 |
0.529 |
2.341 |
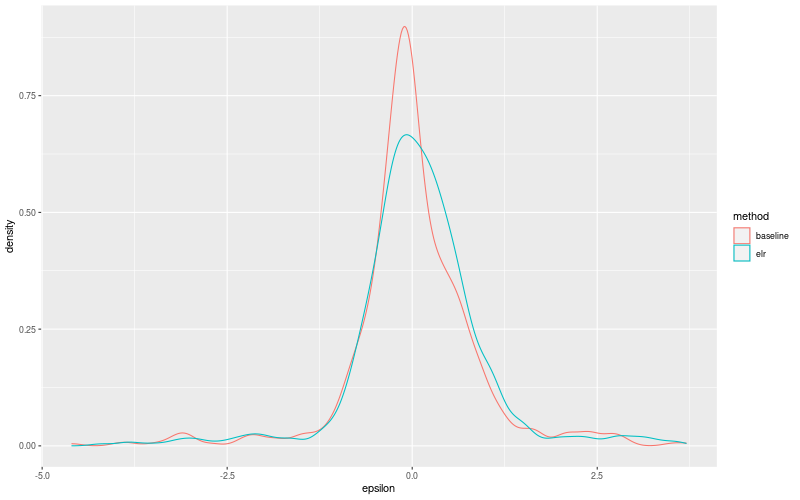
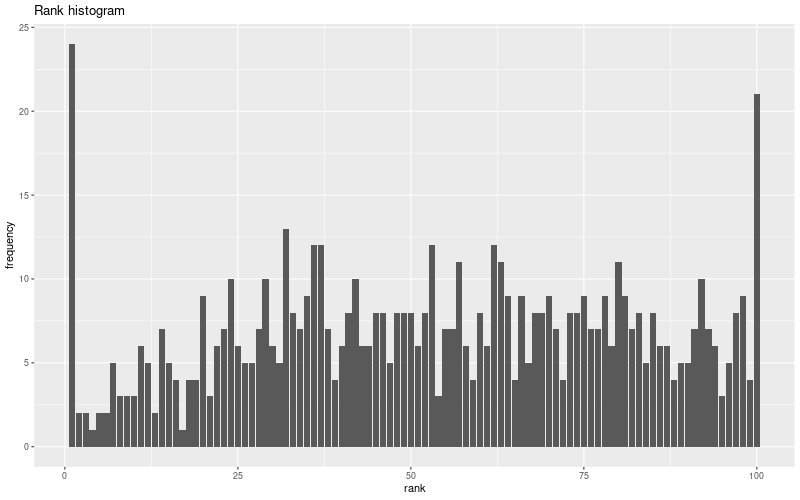
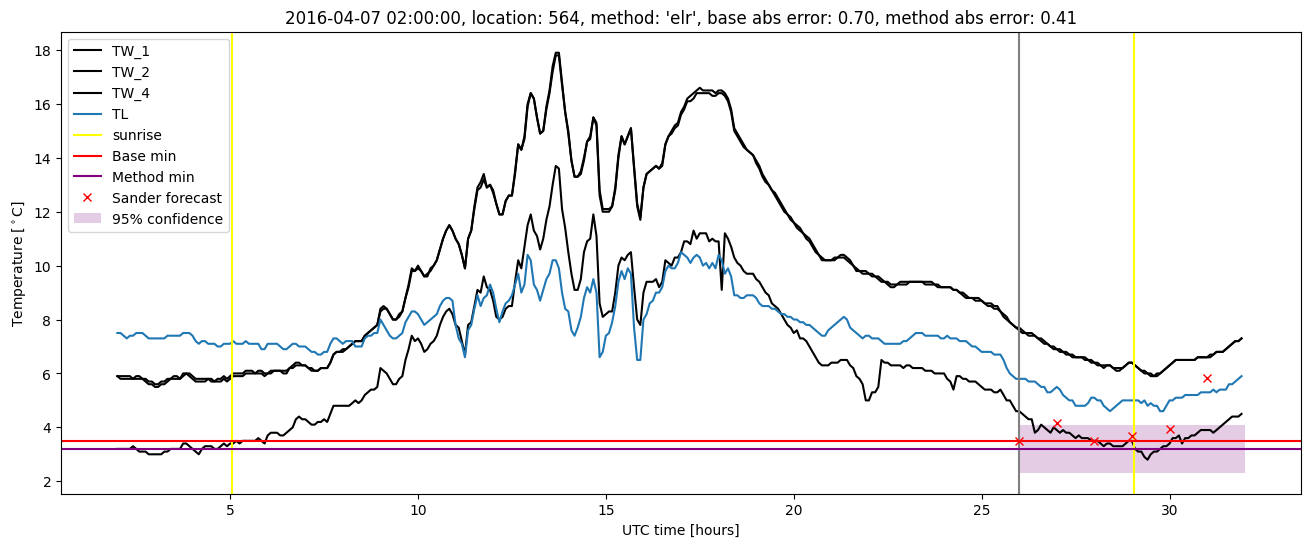
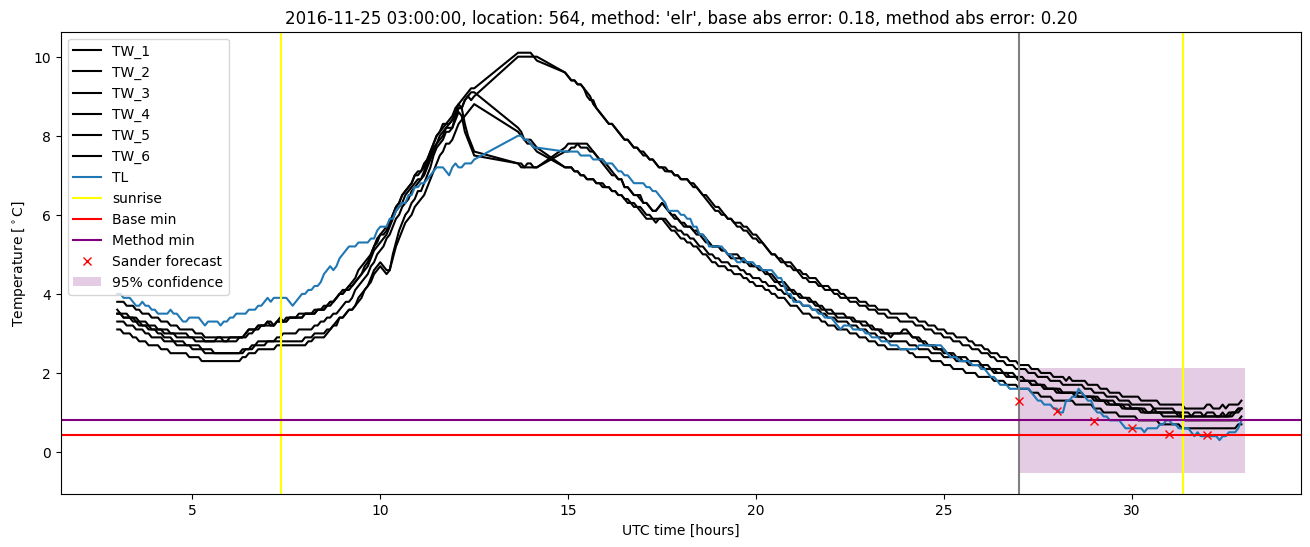
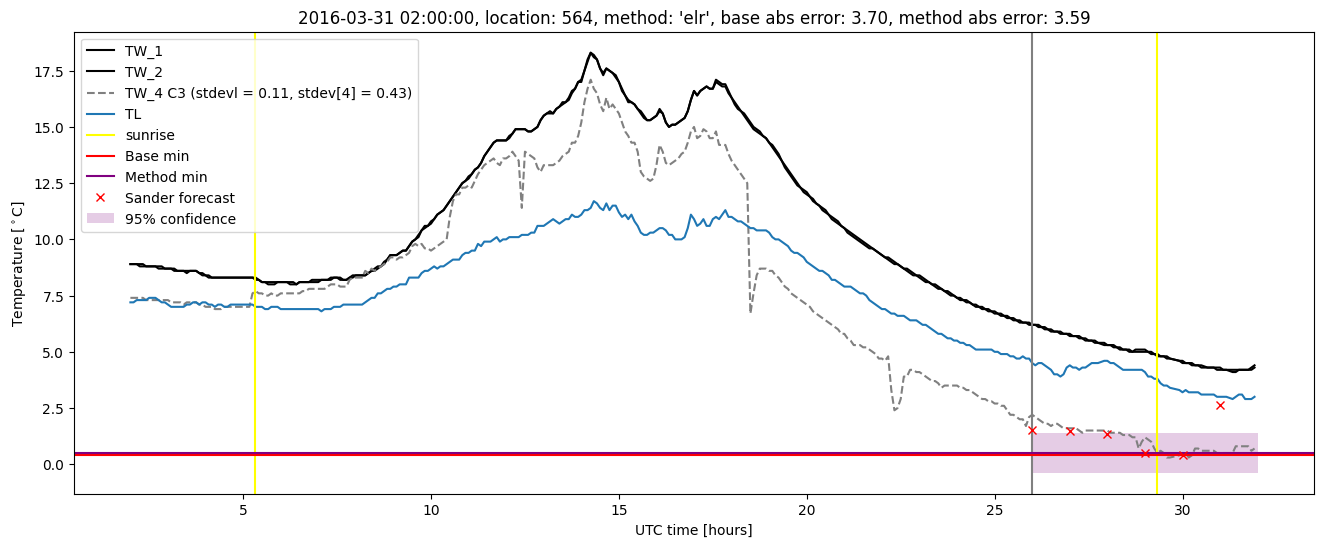
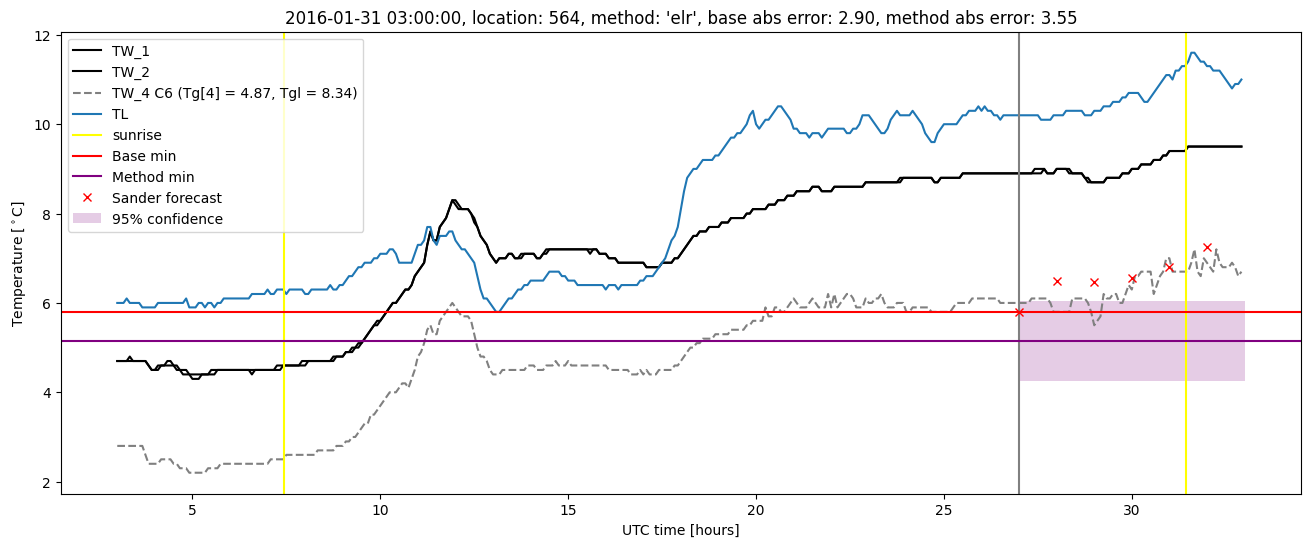
Extended logistic regression plots