GMS location: 563
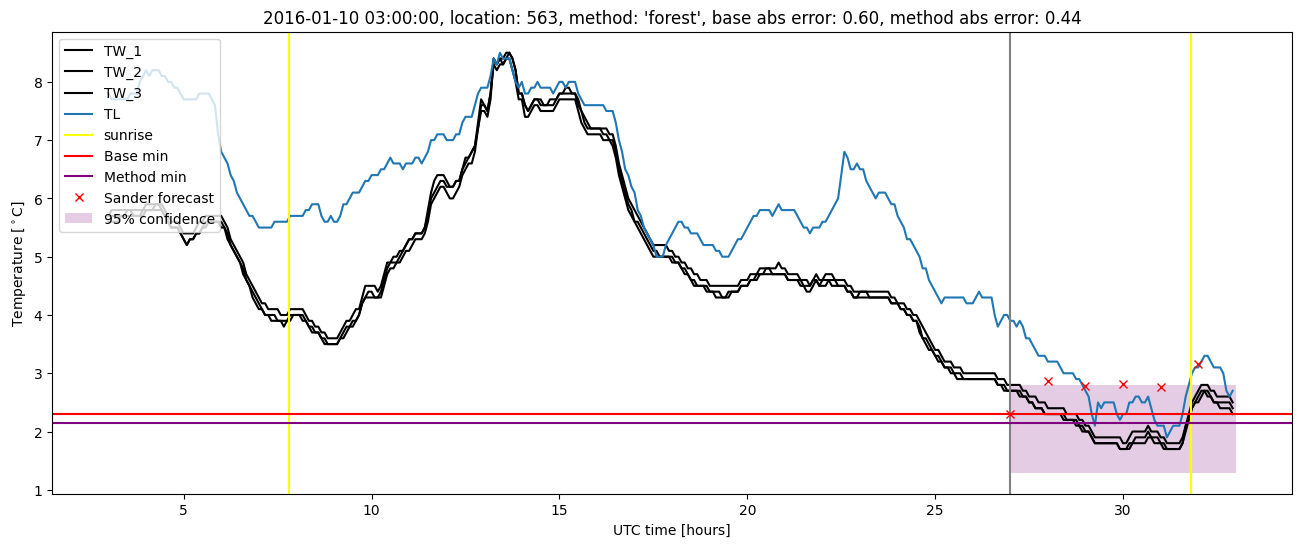
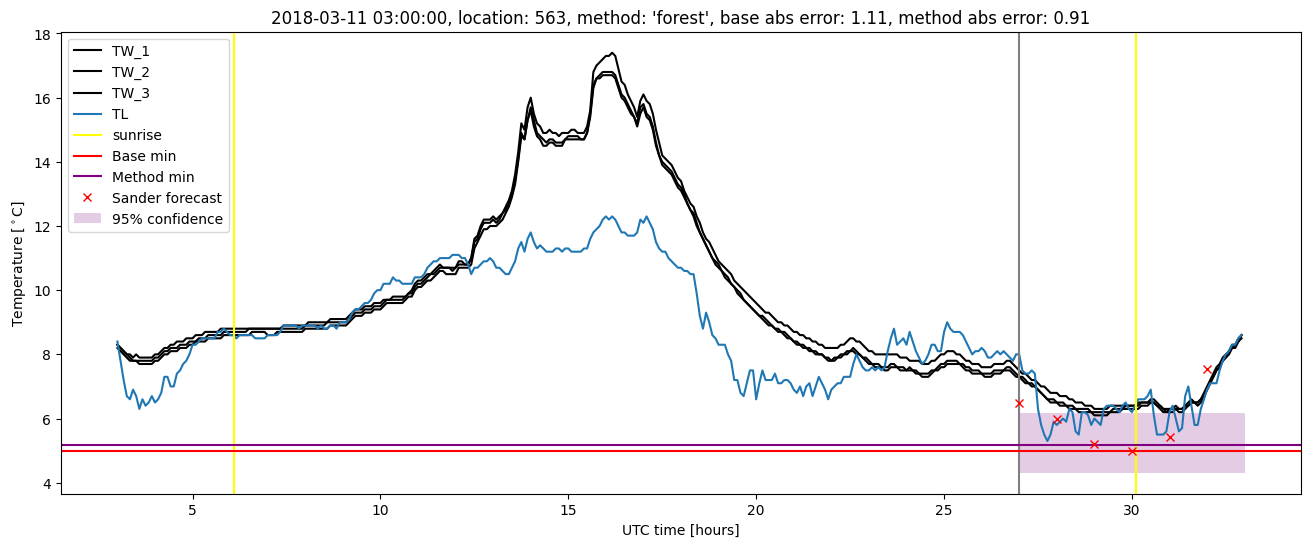
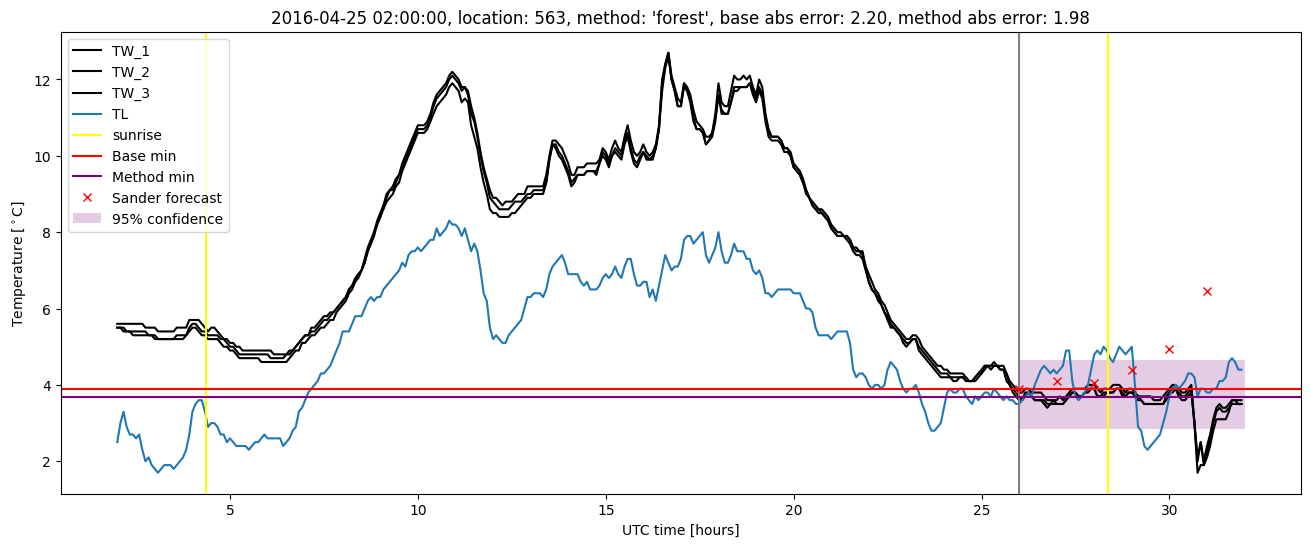
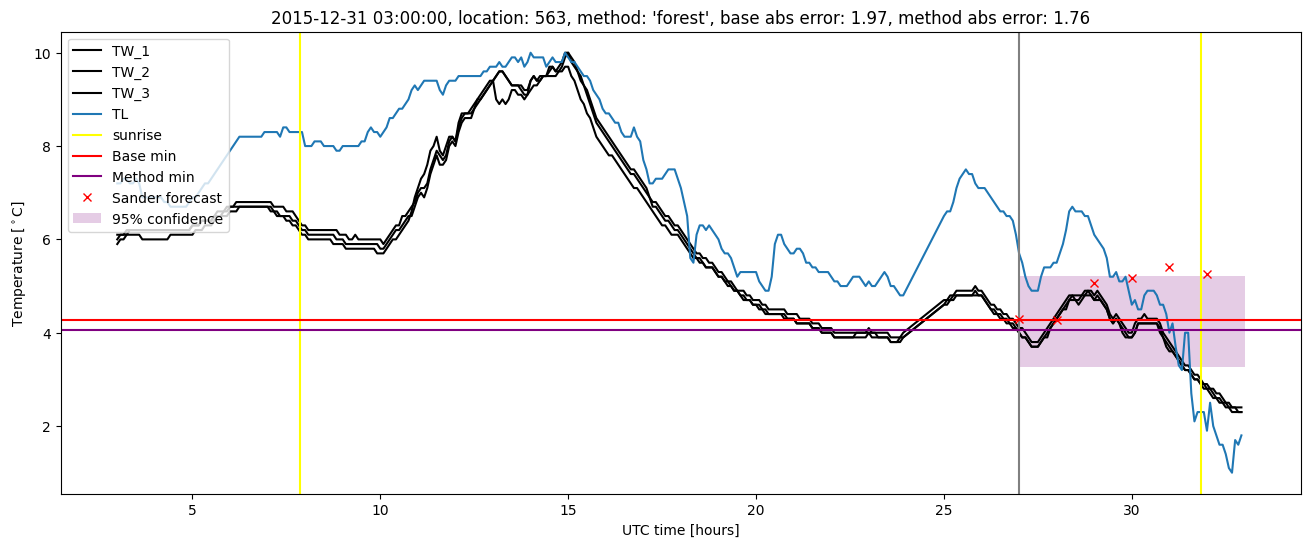
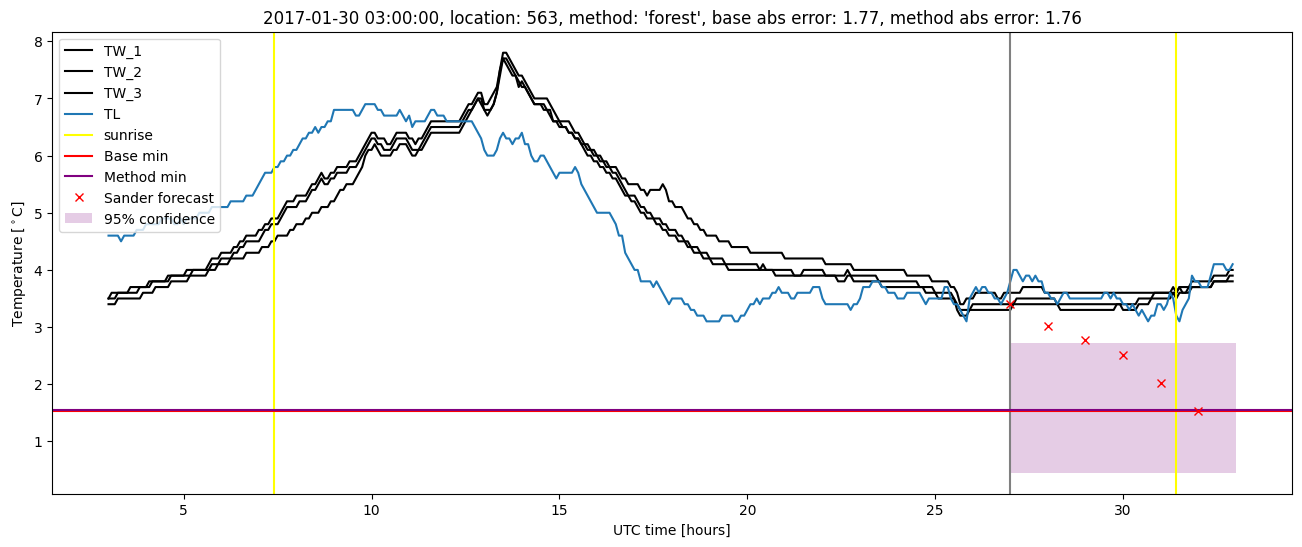
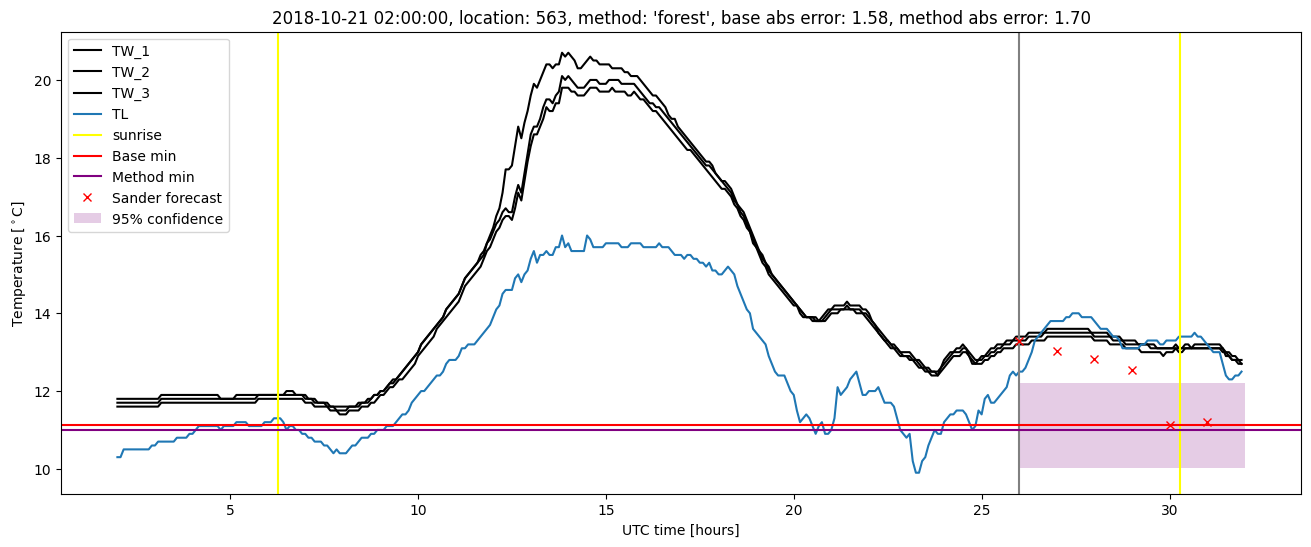
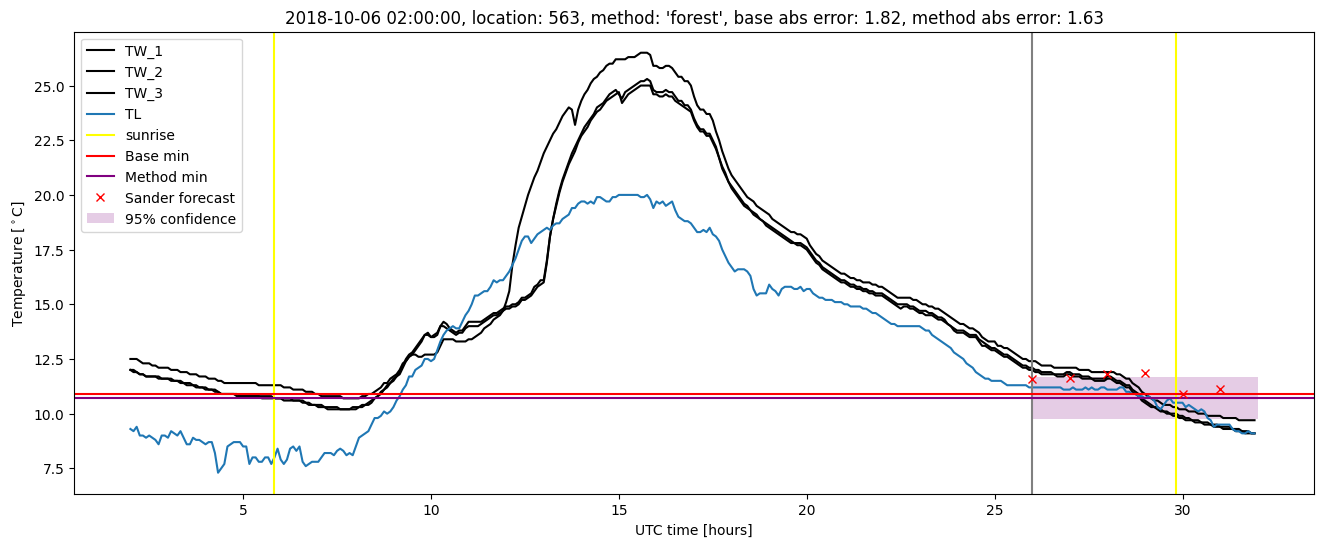
Random forest results
| names |
period |
power |
significance |
meanSquareError |
absError |
maxError |
CRPS |
IGN |
| baseline |
winter 2016 |
0.989 |
0.000e+00 |
0.356 |
0.450 |
2.199 |
NaN |
NaN |
| forest |
winter 2016 |
0.989 |
0.053 |
0.311 |
0.421 |
1.979 |
0.507 |
5.047 |
| baseline |
winter 2017 |
0.977 |
0.051 |
0.338 |
0.424 |
2.071 |
NaN |
NaN |
| forest |
winter 2017 |
0.989 |
0.077 |
0.277 |
0.394 |
1.755 |
0.506 |
4.239 |
| baseline |
winter 2018 |
1.000 |
0.094 |
0.272 |
0.407 |
1.626 |
NaN |
NaN |
| forest |
winter 2018 |
0.993 |
0.031 |
0.216 |
0.364 |
1.398 |
0.508 |
2.881 |
| baseline |
winter 2019 |
0.992 |
0.000e+00 |
0.312 |
0.410 |
2.004 |
NaN |
NaN |
| forest |
winter 2019 |
0.992 |
0.000e+00 |
0.256 |
0.364 |
1.702 |
0.492 |
3.737 |
| baseline |
all |
0.991 |
0.051 |
0.320 |
0.424 |
2.199 |
NaN |
NaN |
| forest |
all |
0.991 |
0.051 |
0.266 |
0.388 |
1.979 |
0.504 |
4.013 |
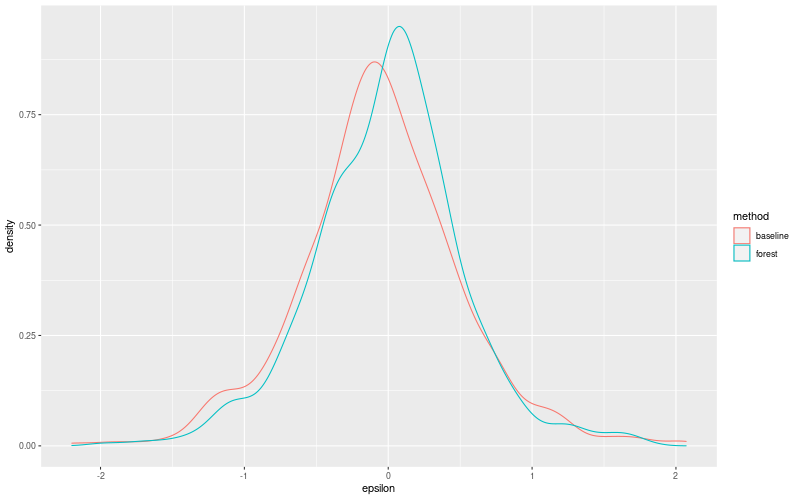
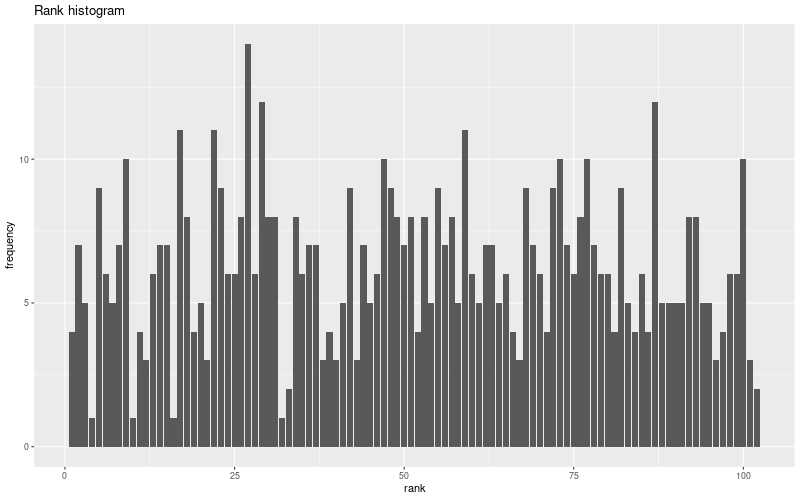
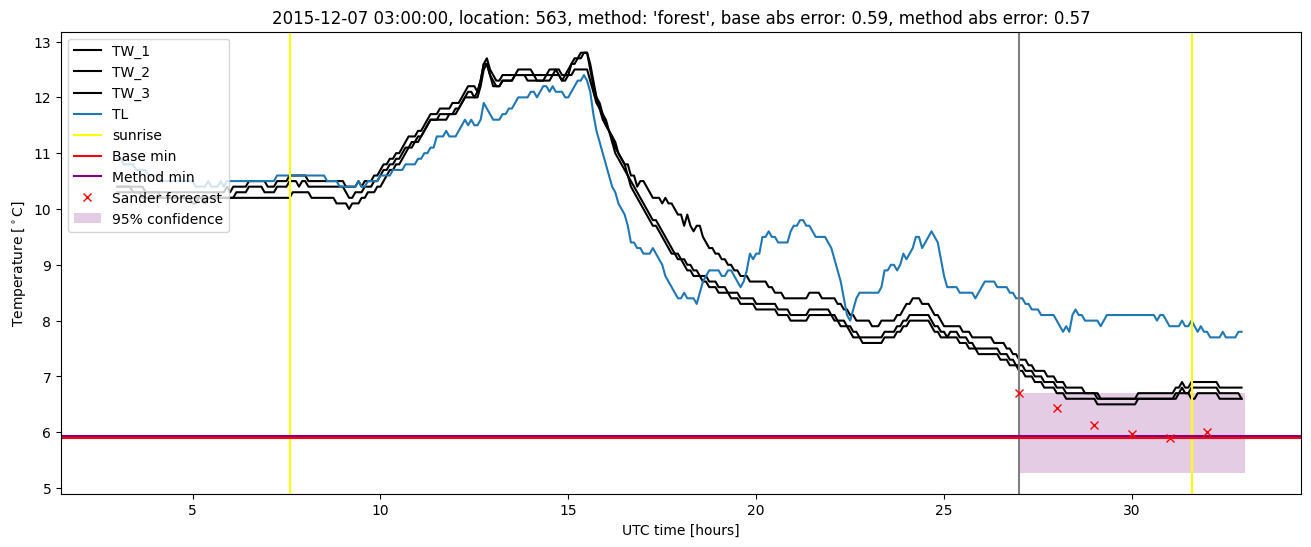
Random forest plots
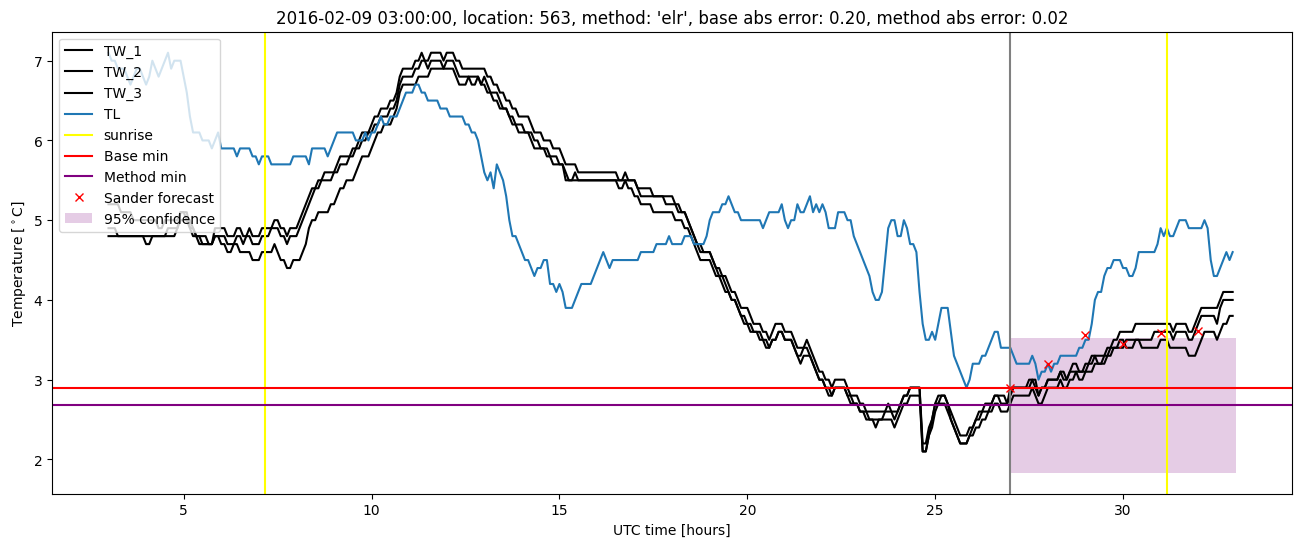
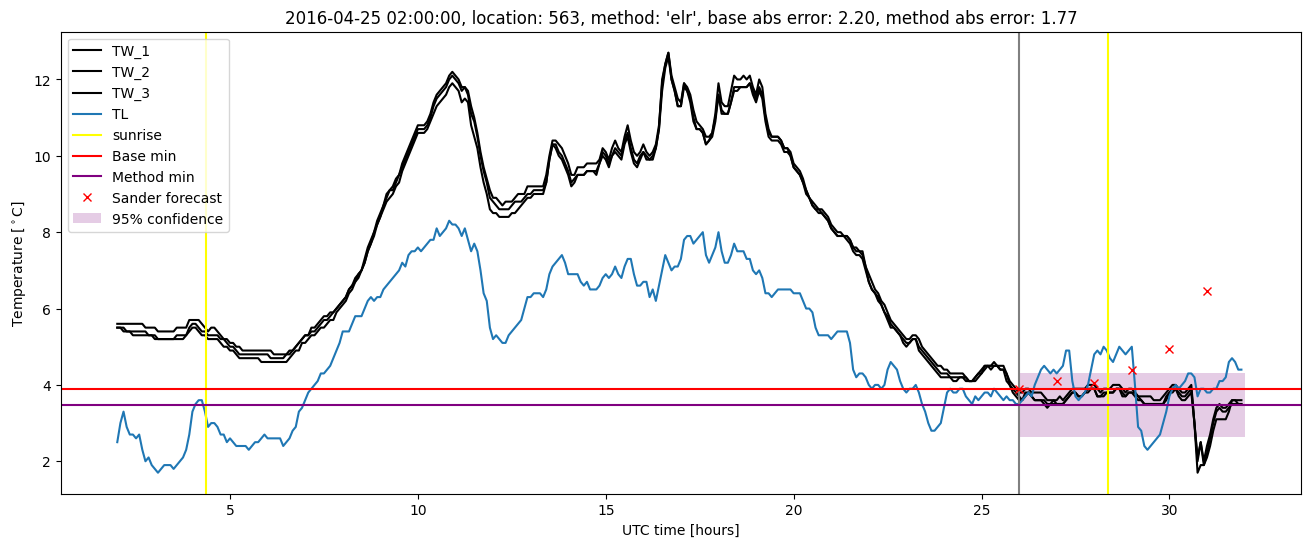
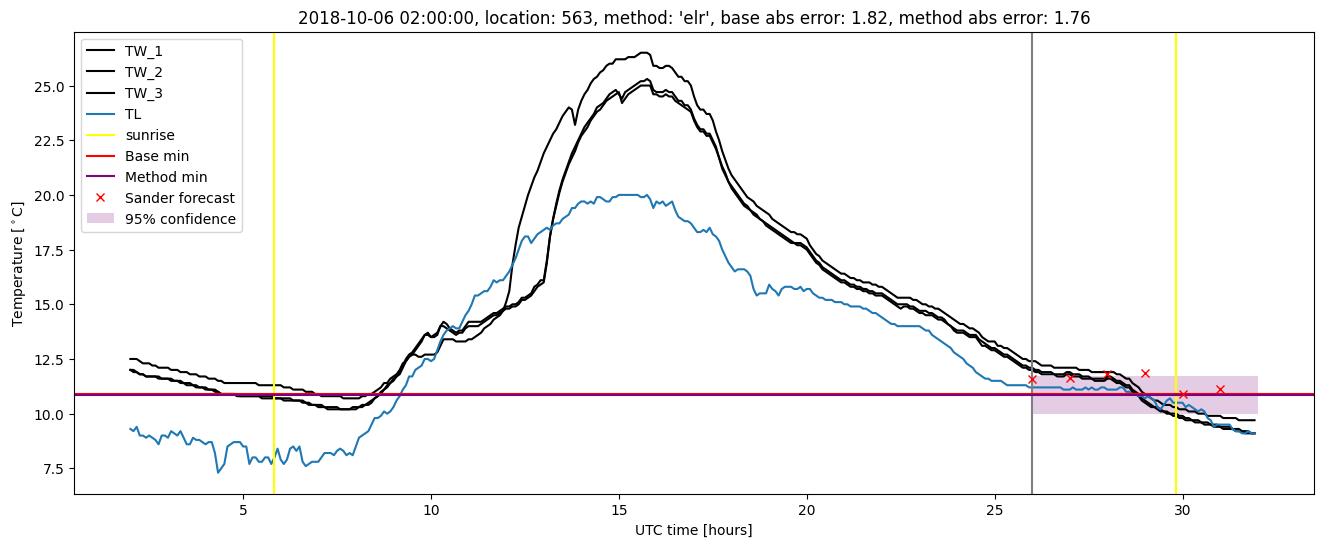
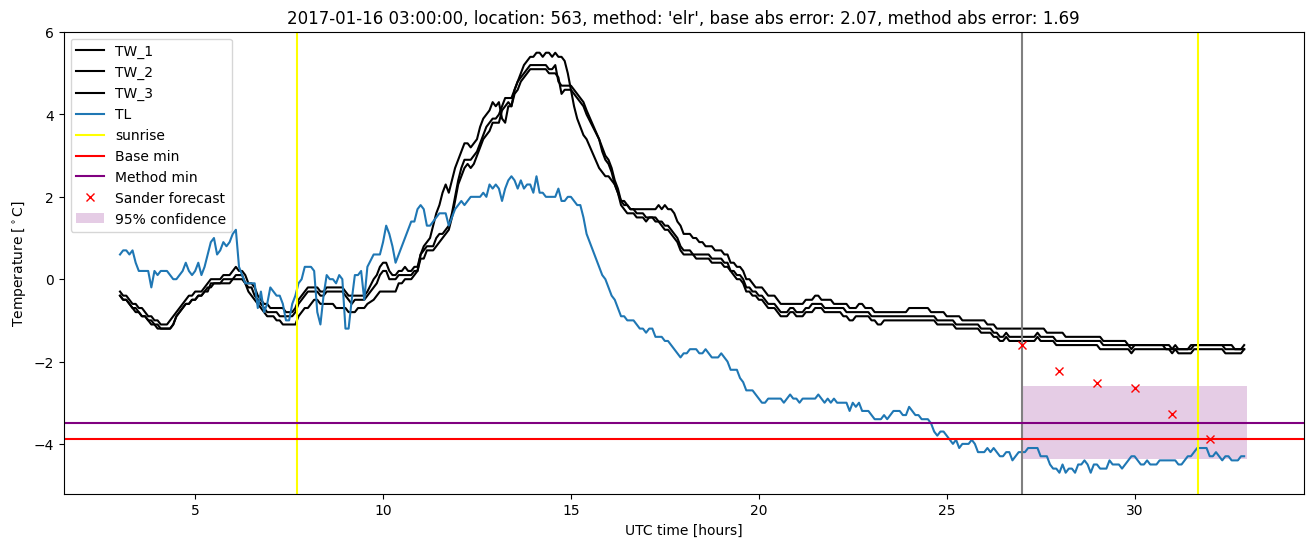
Extended logistic regression results
| names |
period |
power |
significance |
meanSquareError |
absError |
maxError |
CRPS |
IGN |
| baseline |
winter 2016 |
0.989 |
0.000e+00 |
0.356 |
0.450 |
2.199 |
NaN |
NaN |
| elr |
winter 2016 |
0.989 |
0.053 |
0.334 |
0.457 |
1.943 |
0.553 |
5.195 |
| baseline |
winter 2017 |
0.977 |
0.051 |
0.338 |
0.424 |
2.071 |
NaN |
NaN |
| elr |
winter 2017 |
0.989 |
0.051 |
0.297 |
0.415 |
1.691 |
0.570 |
4.670 |
| baseline |
winter 2018 |
1.000 |
0.094 |
0.272 |
0.407 |
1.626 |
NaN |
NaN |
| elr |
winter 2018 |
0.993 |
0.062 |
0.250 |
0.396 |
1.398 |
0.564 |
4.028 |
| baseline |
winter 2019 |
0.992 |
0.000e+00 |
0.312 |
0.410 |
2.004 |
NaN |
NaN |
| elr |
winter 2019 |
0.992 |
0.000e+00 |
0.276 |
0.390 |
1.755 |
0.535 |
4.036 |
| baseline |
all |
0.991 |
0.051 |
0.320 |
0.424 |
2.199 |
NaN |
NaN |
| elr |
all |
0.991 |
0.051 |
0.291 |
0.418 |
1.943 |
0.555 |
4.521 |
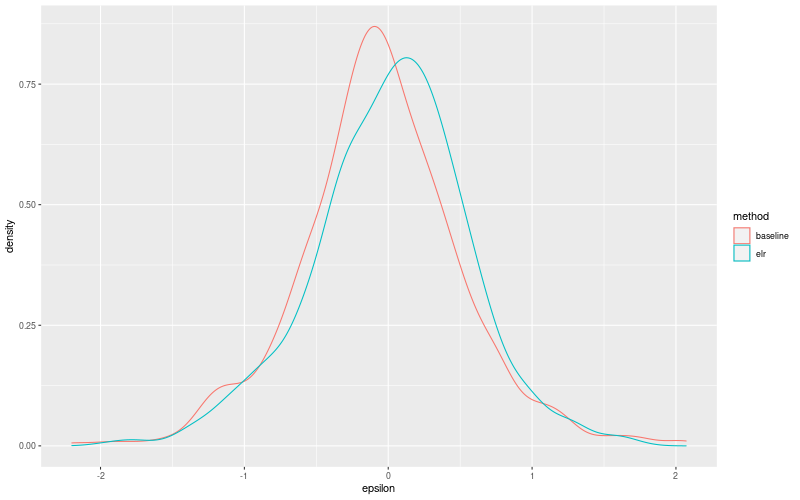
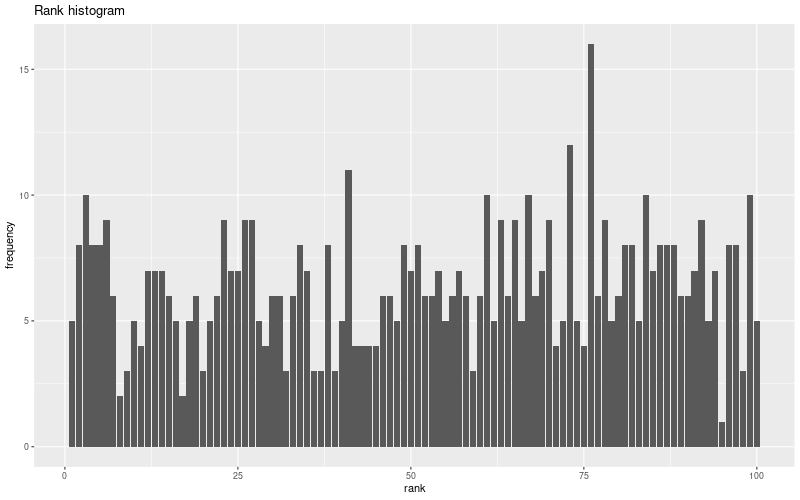
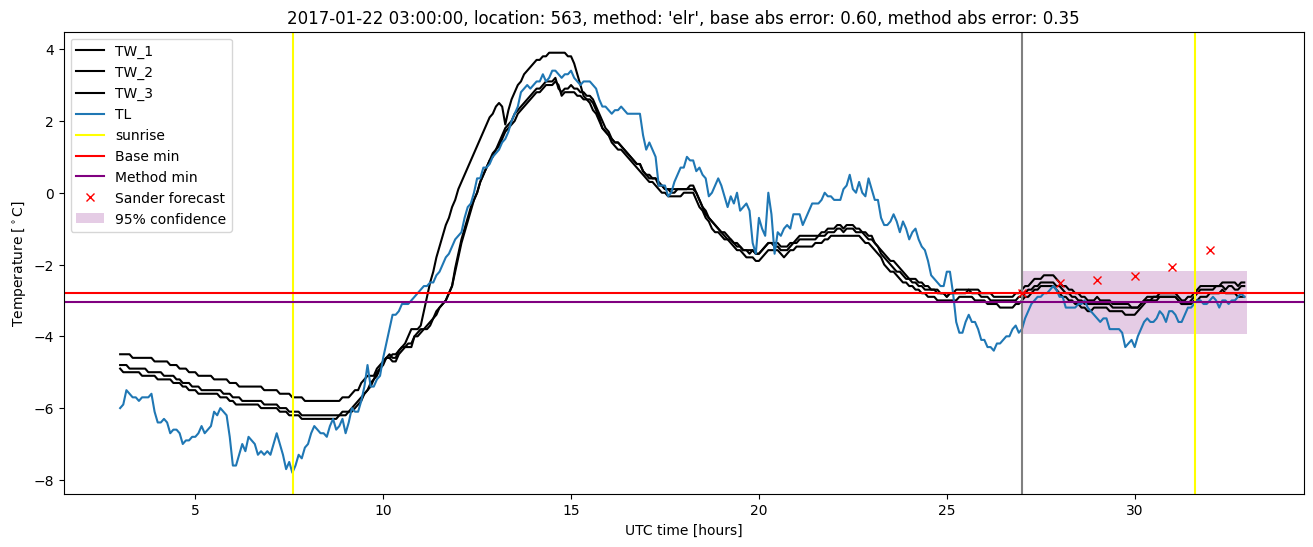
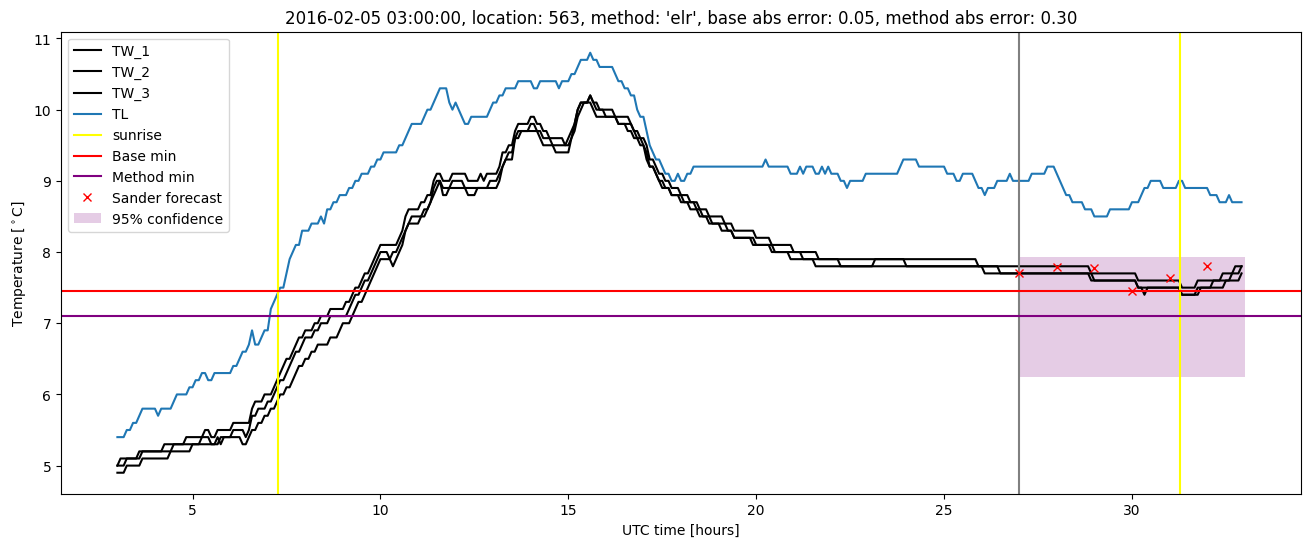
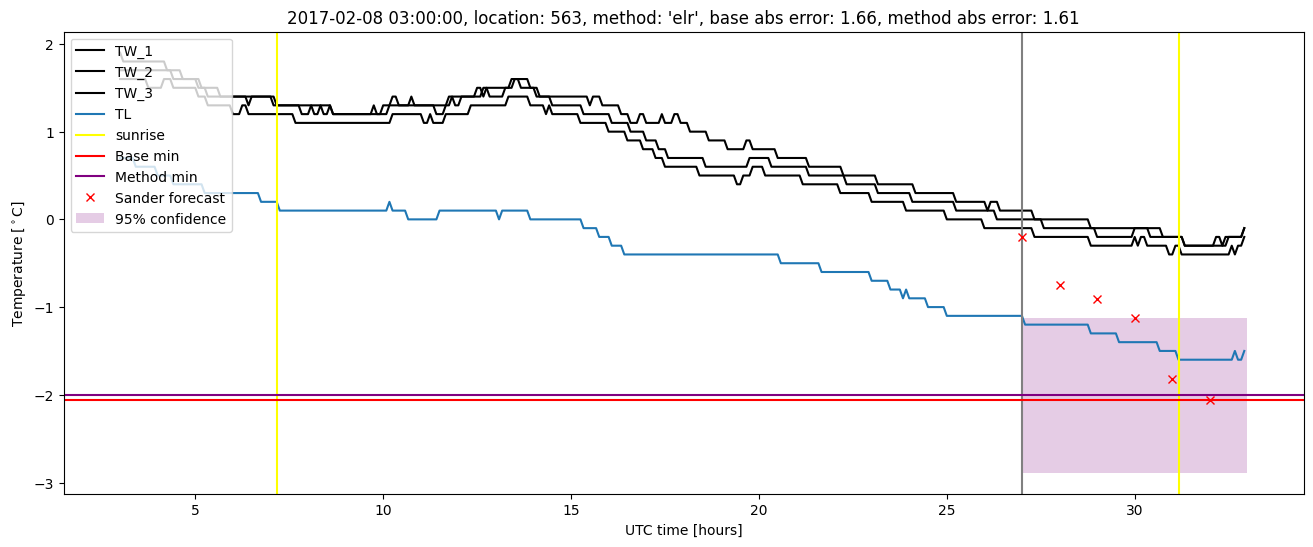
Extended logistic regression plots