GMS location: 561
Random forest results
| names |
period |
power |
significance |
meanSquareError |
absError |
maxError |
CRPS |
IGN |
| baseline |
winter 2016 |
1.000 |
0.222 |
0.416 |
0.495 |
2.137 |
NaN |
NaN |
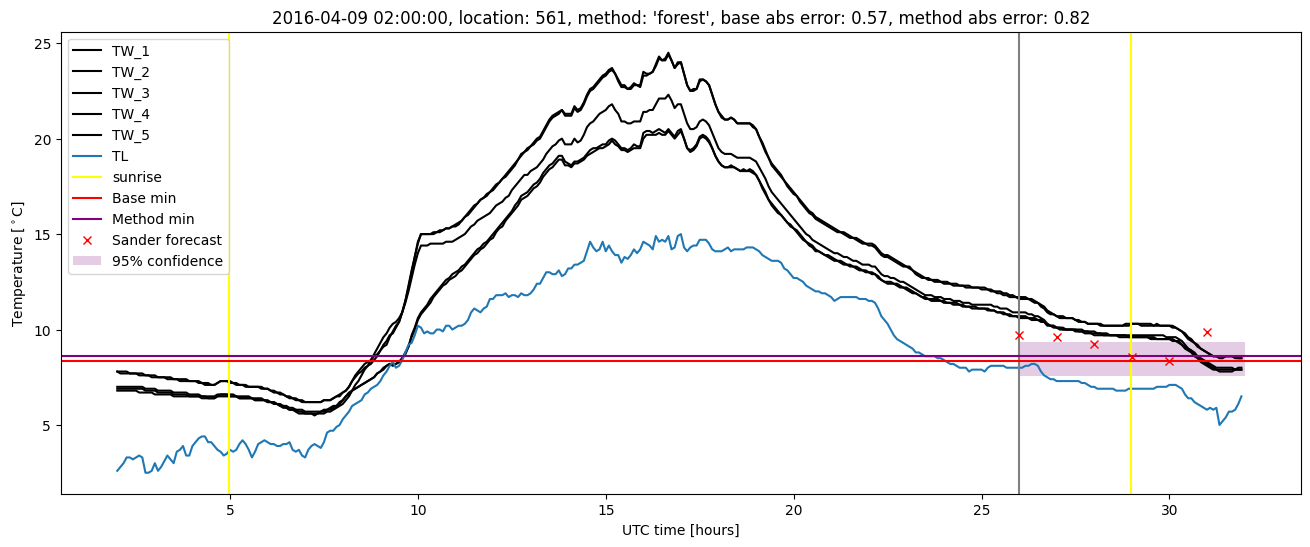
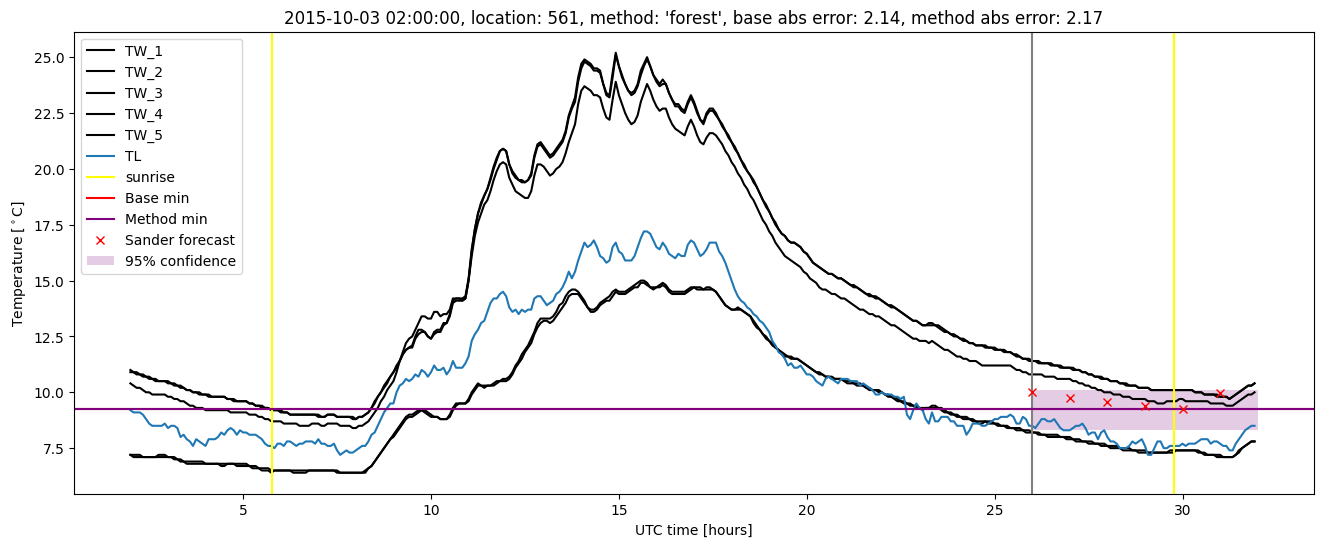
| forest |
winter 2016 |
1.000 |
0.222 |
0.369 |
0.445 |
2.173 |
0.491 |
3.333 |
| baseline |
winter 2017 |
0.991 |
0.024 |
0.351 |
0.439 |
2.092 |
NaN |
NaN |
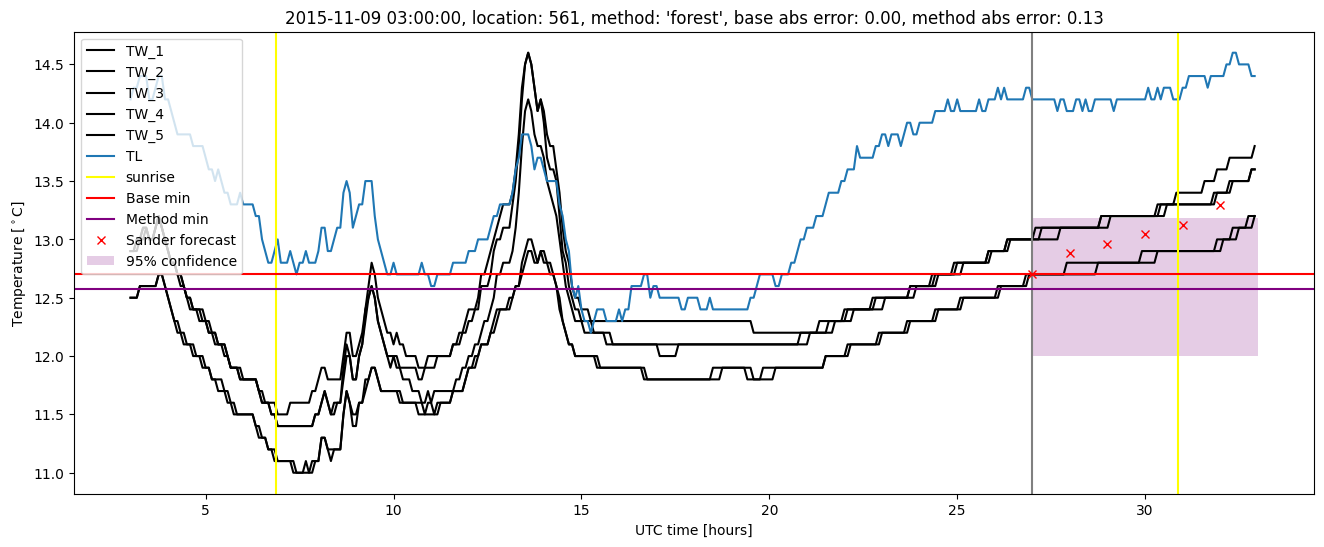
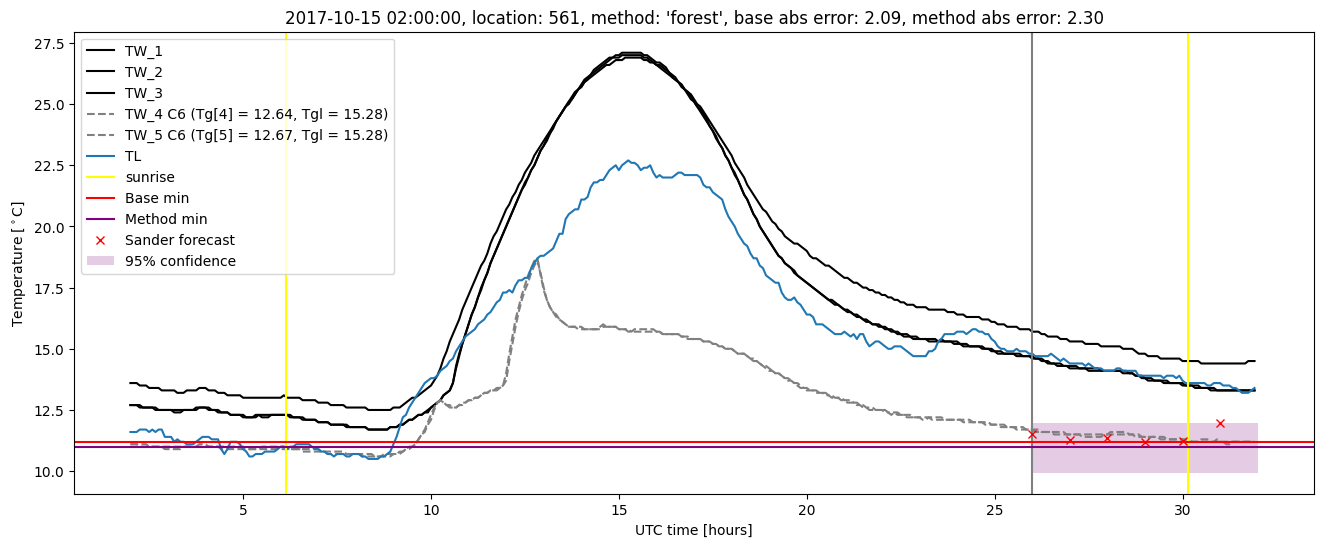
| forest |
winter 2017 |
0.982 |
0.024 |
0.328 |
0.432 |
1.849 |
0.508 |
3.237 |
| baseline |
winter 2018 |
0.993 |
0.031 |
0.282 |
0.393 |
2.090 |
NaN |
NaN |
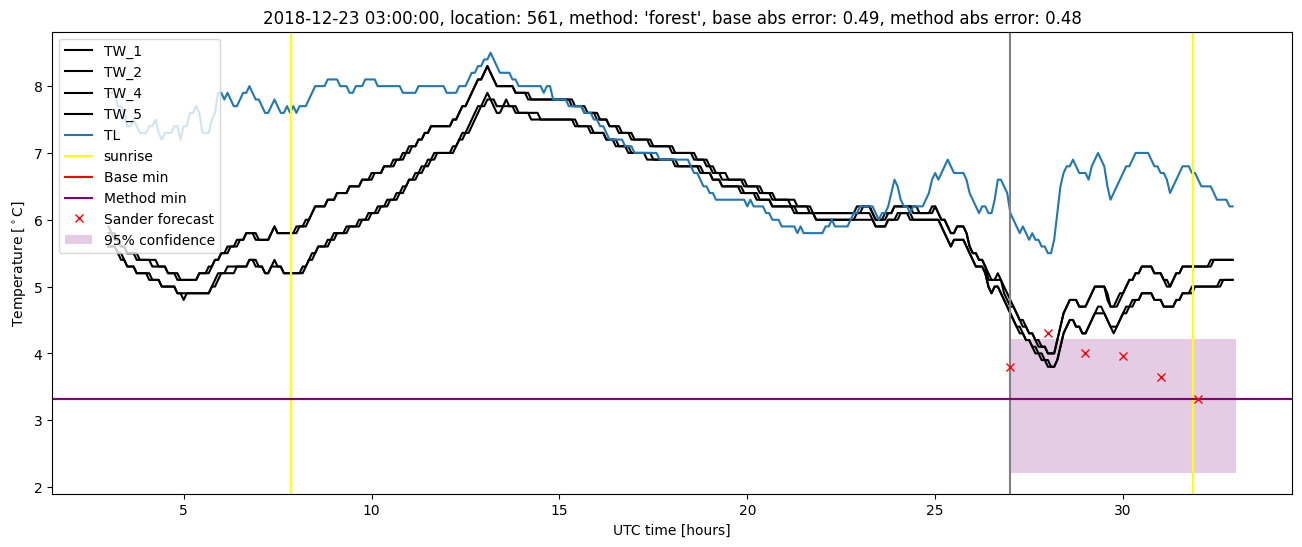
| forest |
winter 2018 |
0.993 |
0.062 |
0.249 |
0.369 |
2.300 |
0.515 |
2.510 |
| baseline |
winter 2019 |
1.000 |
0.000e+00 |
0.304 |
0.383 |
2.699 |
NaN |
NaN |
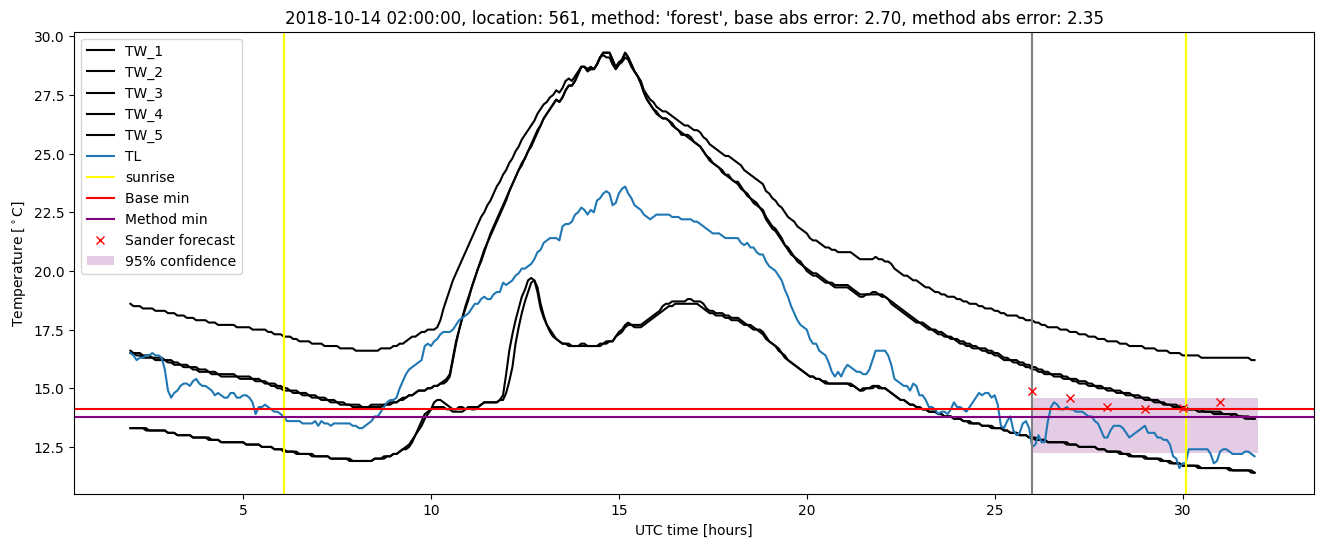
| forest |
winter 2019 |
1.000 |
0.000e+00 |
0.288 |
0.383 |
2.355 |
0.534 |
3.079 |
| baseline |
all |
0.996 |
0.073 |
0.343 |
0.432 |
2.699 |
NaN |
NaN |
| forest |
all |
0.995 |
0.082 |
0.311 |
0.409 |
2.355 |
0.510 |
3.043 |
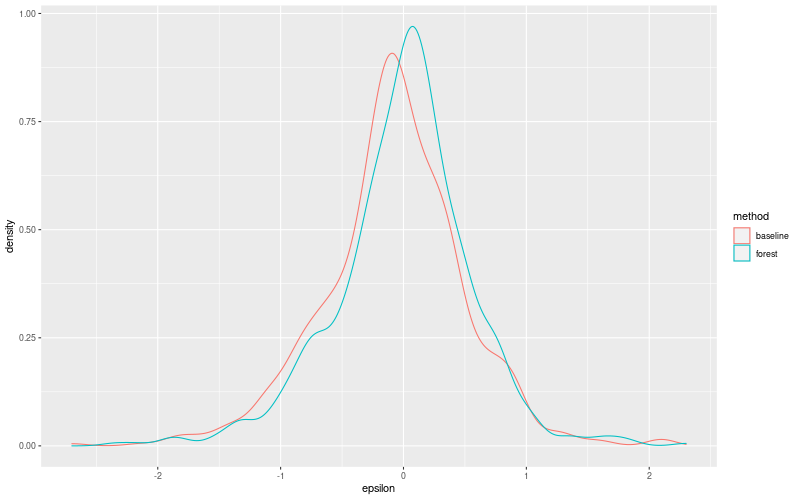
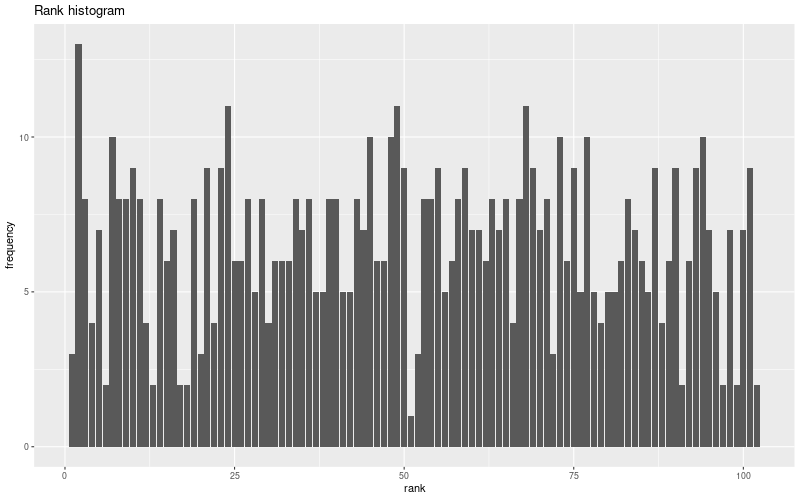
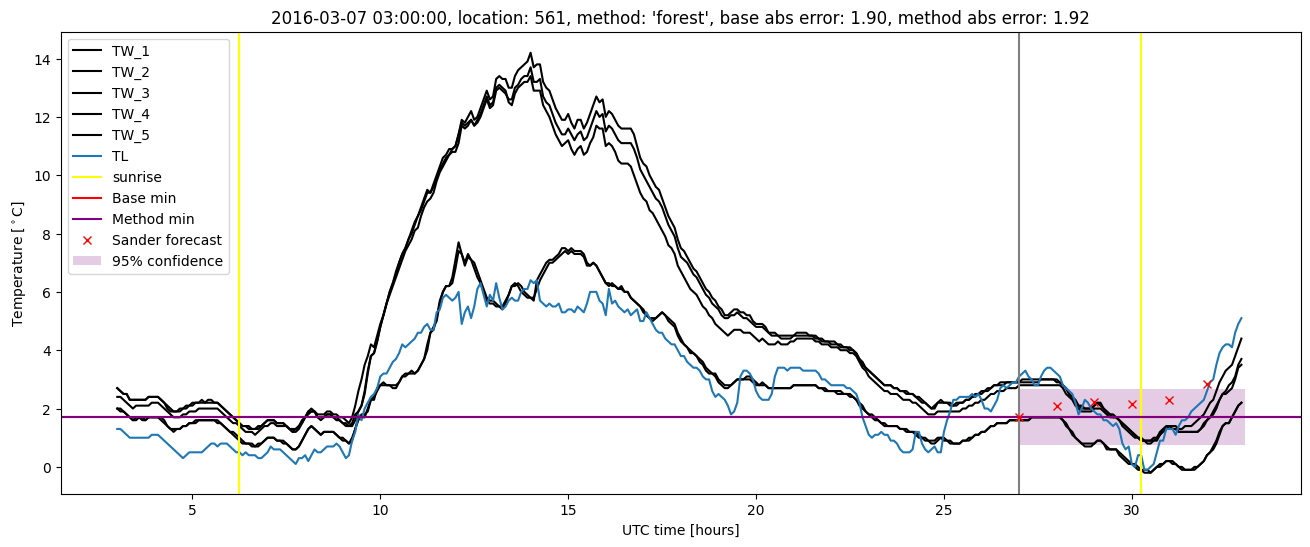
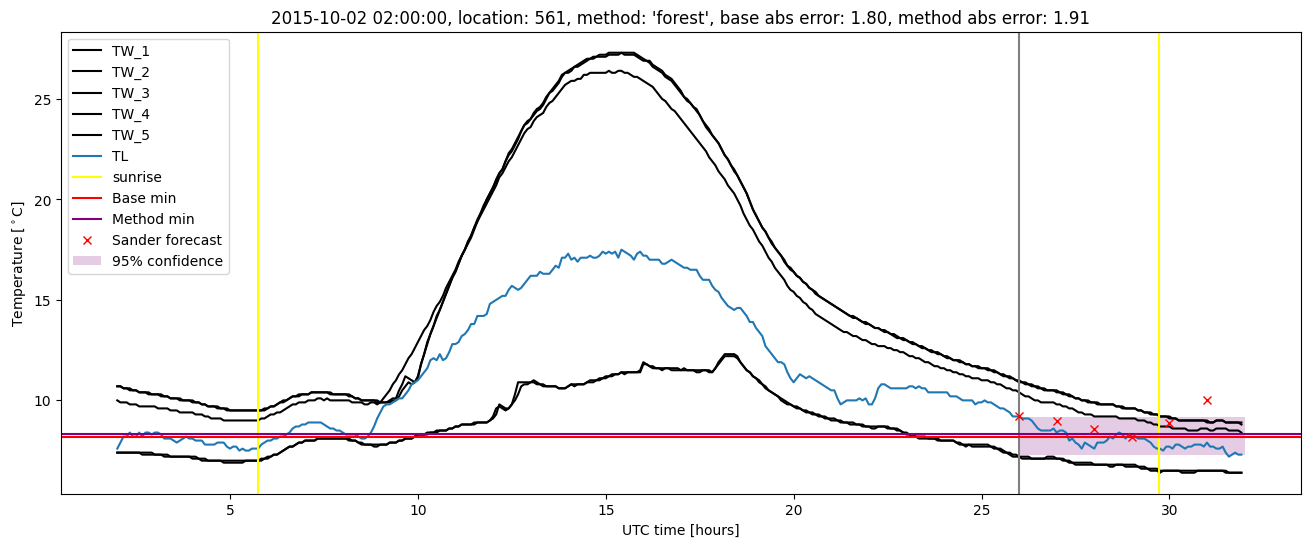
Random forest plots
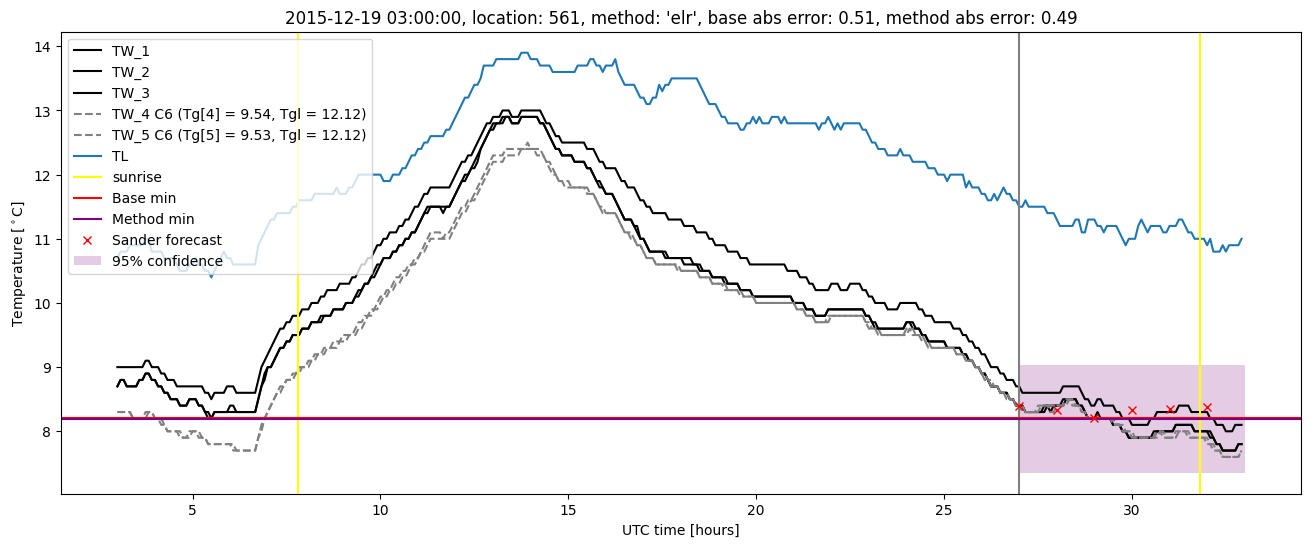
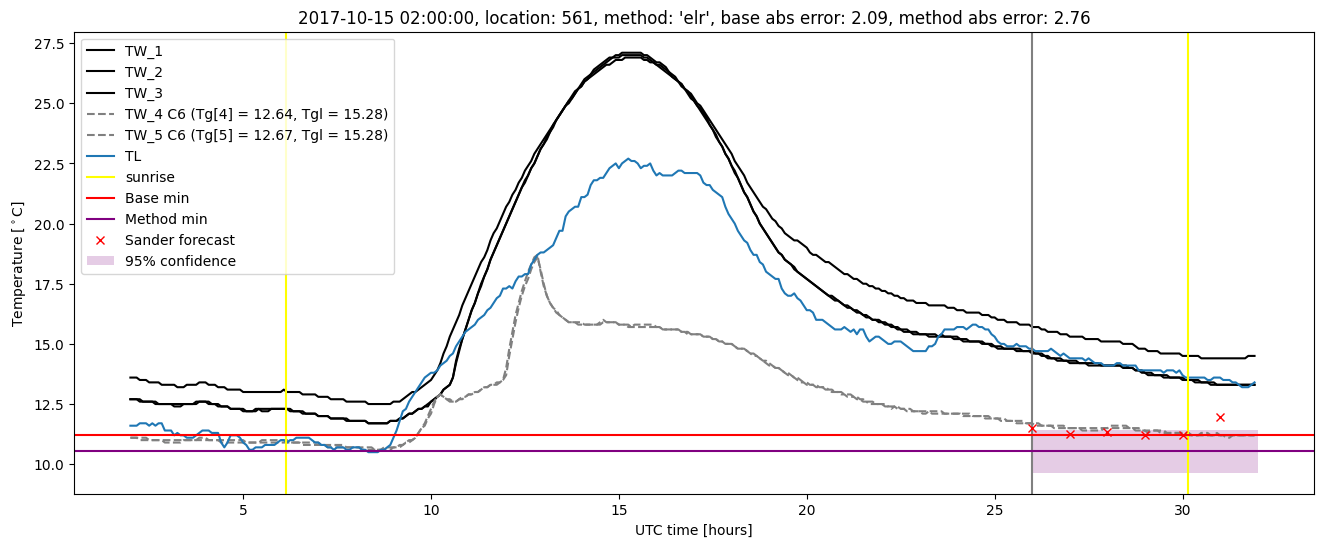
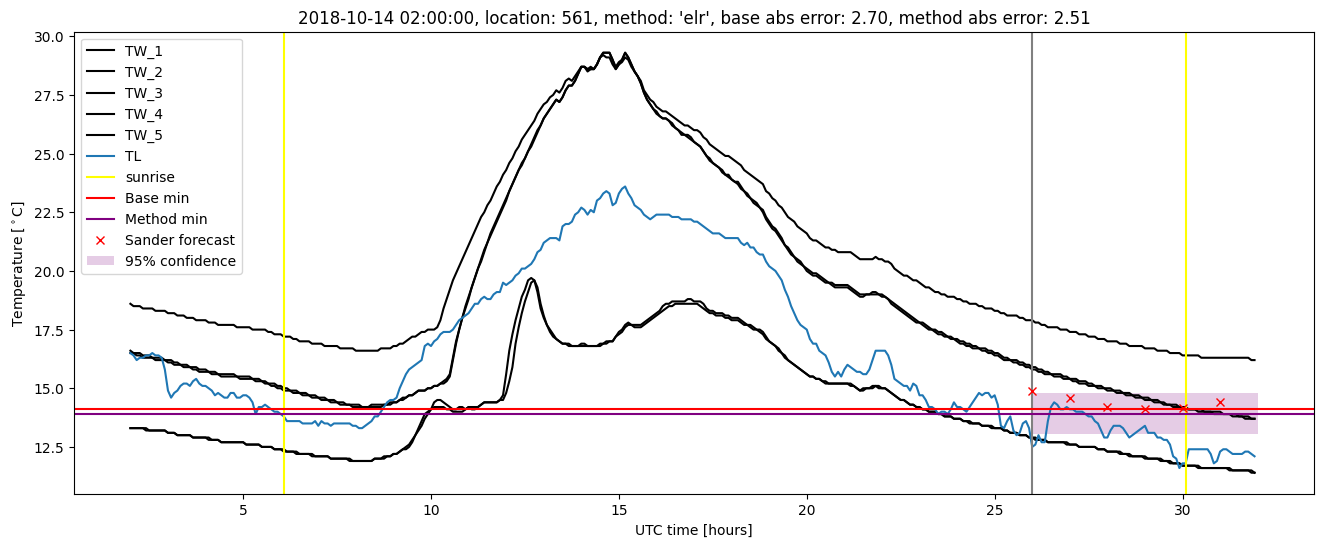
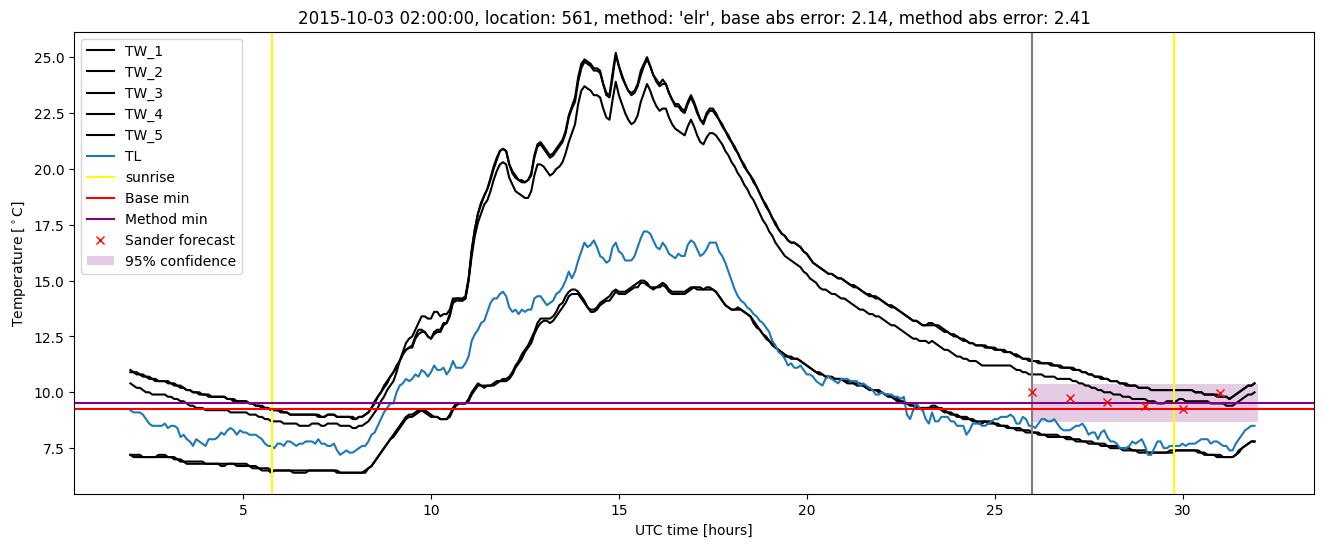
Extended logistic regression results
| names |
period |
power |
significance |
meanSquareError |
absError |
maxError |
CRPS |
IGN |
| baseline |
winter 2016 |
1.000 |
0.222 |
0.416 |
0.495 |
2.137 |
NaN |
NaN |
| elr |
winter 2016 |
0.994 |
0.148 |
0.402 |
0.484 |
2.413 |
0.550 |
5.267 |
| baseline |
winter 2017 |
0.991 |
0.024 |
0.351 |
0.439 |
2.092 |
NaN |
NaN |
| elr |
winter 2017 |
0.991 |
0.024 |
0.340 |
0.440 |
1.956 |
0.553 |
4.609 |
| baseline |
winter 2018 |
0.993 |
0.031 |
0.282 |
0.393 |
2.090 |
NaN |
NaN |
| elr |
winter 2018 |
0.993 |
0.031 |
0.304 |
0.414 |
2.755 |
0.564 |
4.409 |
| baseline |
winter 2019 |
1.000 |
0.000e+00 |
0.304 |
0.383 |
2.699 |
NaN |
NaN |
| elr |
winter 2019 |
1.000 |
0.000e+00 |
0.318 |
0.405 |
2.510 |
0.570 |
4.757 |
| baseline |
all |
0.996 |
0.073 |
0.343 |
0.432 |
2.699 |
NaN |
NaN |
| elr |
all |
0.995 |
0.054 |
0.345 |
0.439 |
2.755 |
0.559 |
4.786 |
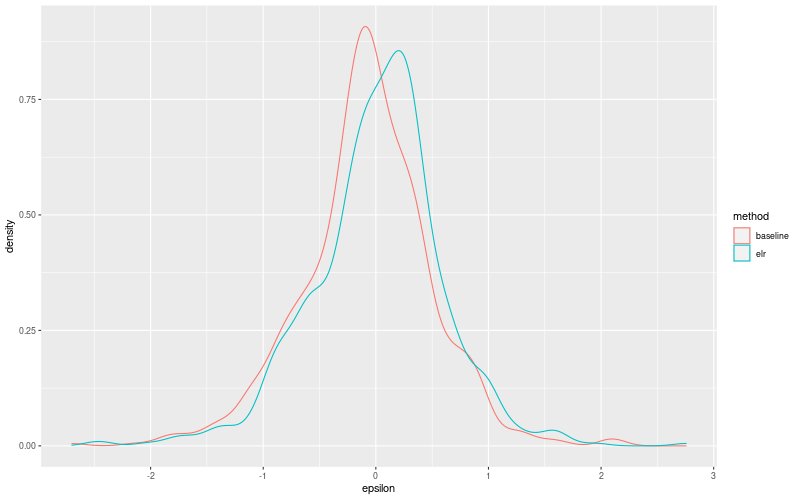
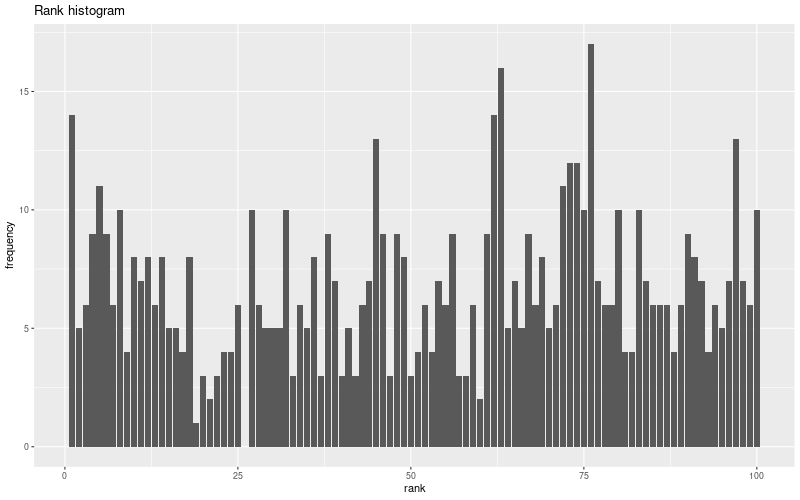
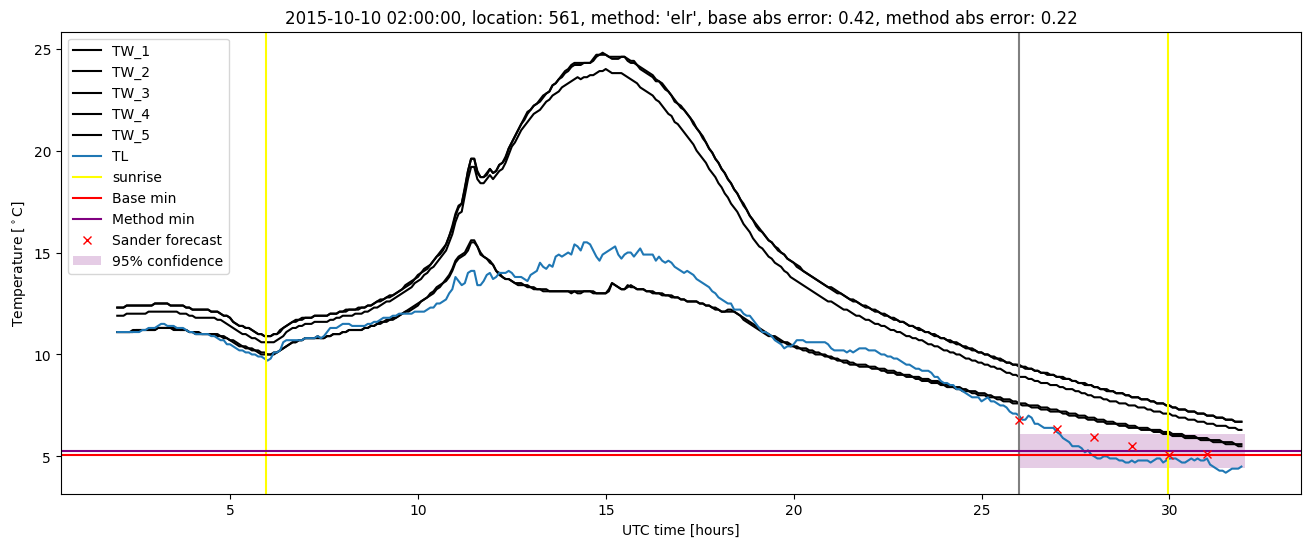
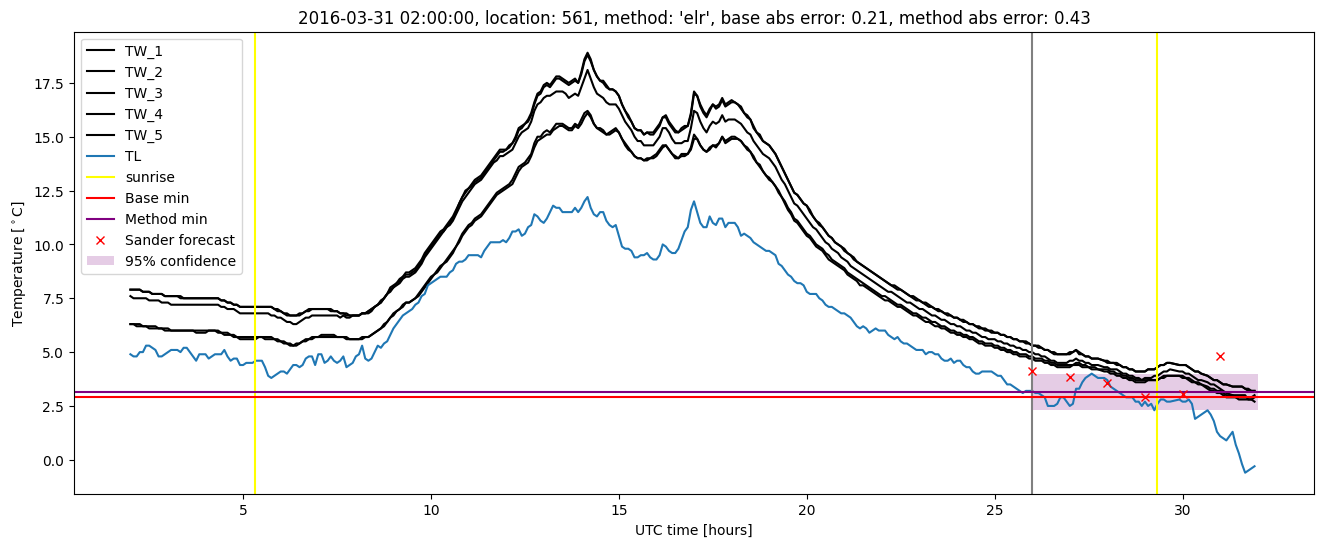
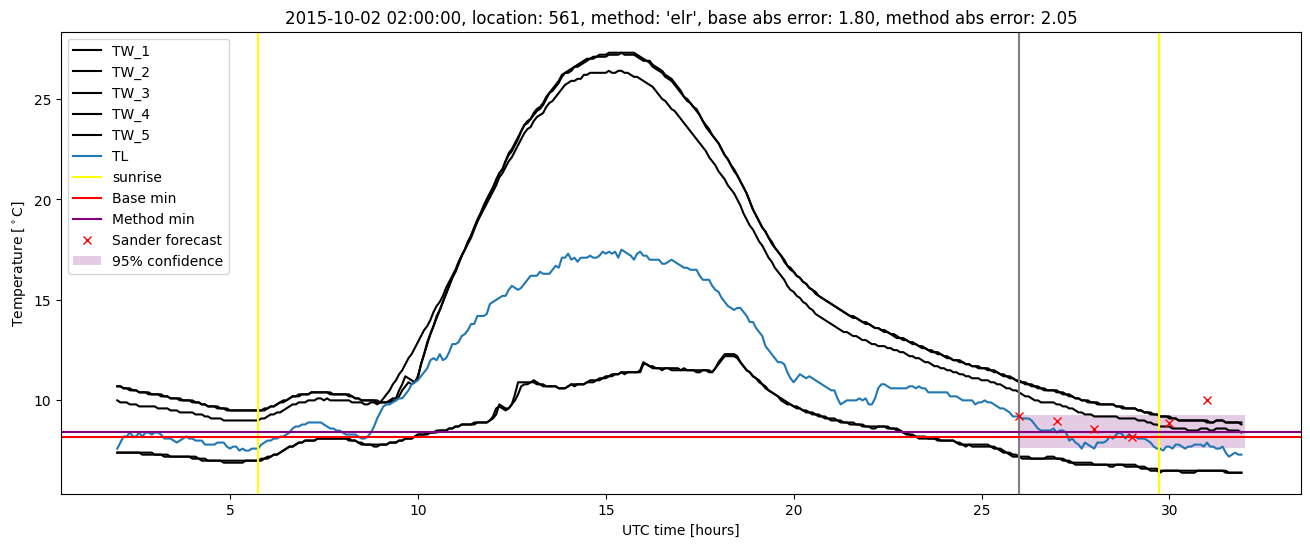
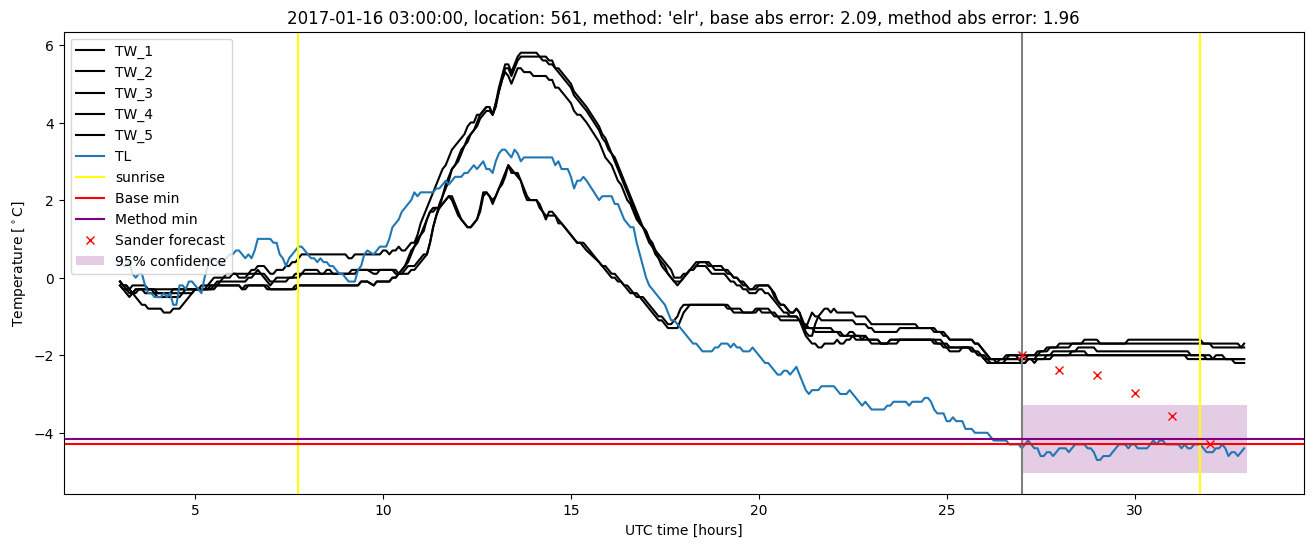
Extended logistic regression plots