GMS location: 560
Random forest results
| names |
period |
power |
significance |
meanSquareError |
absError |
maxError |
CRPS |
IGN |
| baseline |
winter 2016 |
0.989 |
0.000e+00 |
0.294 |
0.437 |
1.524 |
NaN |
NaN |
| forest |
winter 2016 |
1.000 |
0.000e+00 |
0.211 |
0.350 |
1.395 |
0.413 |
3.093 |
| baseline |
winter 2017 |
0.968 |
0.036 |
0.407 |
0.467 |
2.503 |
NaN |
NaN |
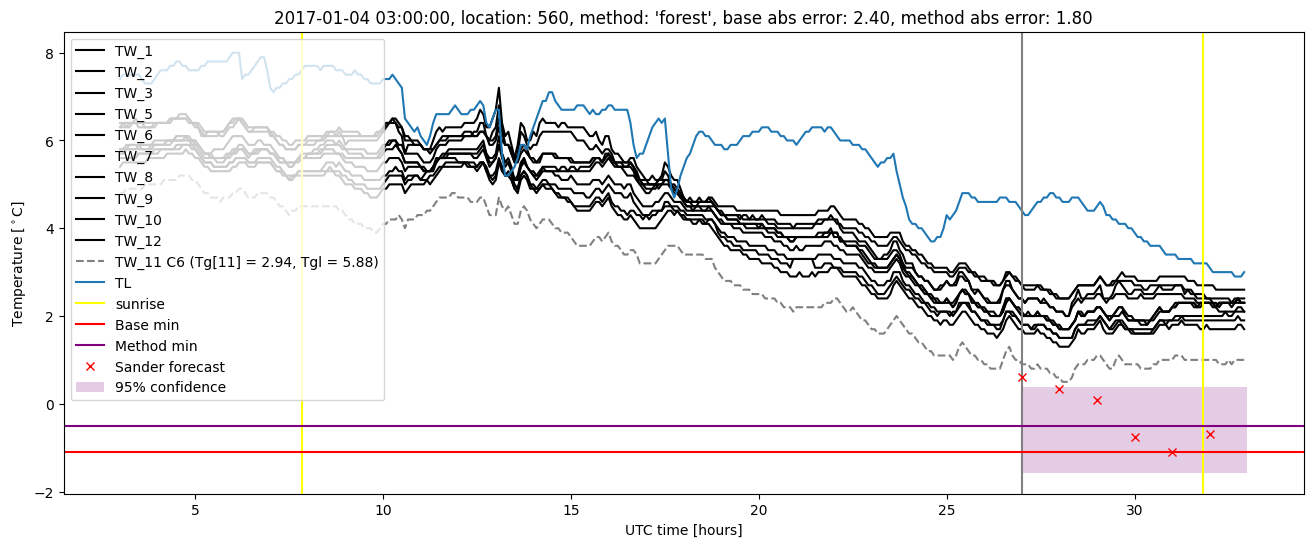
| forest |
winter 2017 |
0.984 |
0.036 |
0.267 |
0.384 |
1.796 |
0.428 |
3.236 |
| baseline |
winter 2018 |
0.986 |
0.038 |
0.388 |
0.479 |
1.715 |
NaN |
NaN |
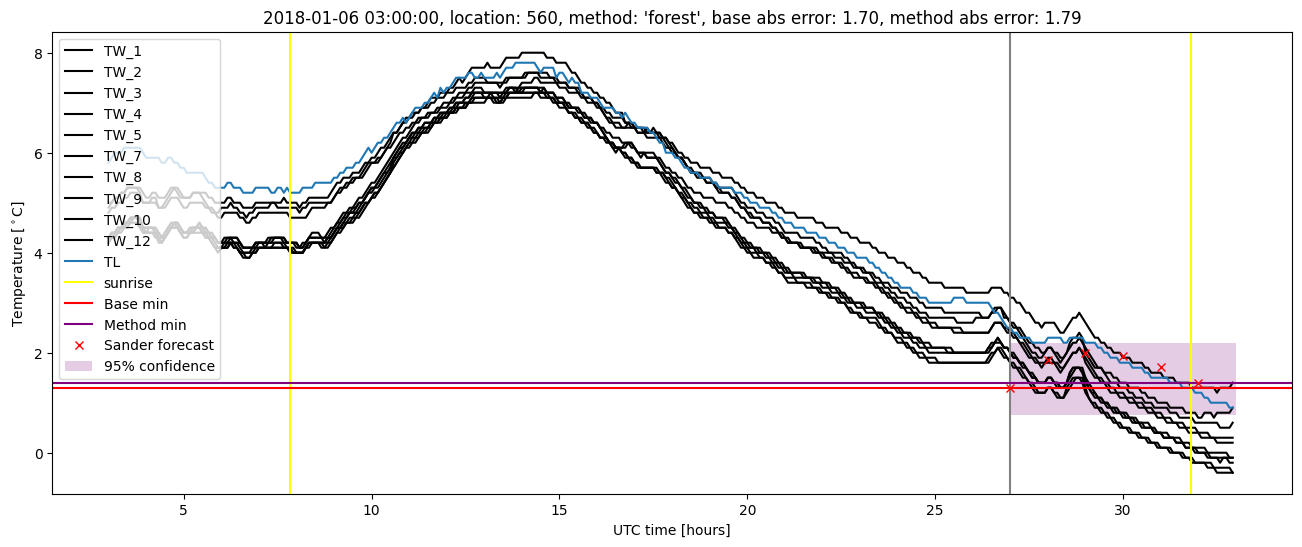
| forest |
winter 2018 |
0.993 |
0.077 |
0.290 |
0.388 |
1.794 |
0.434 |
3.481 |
| baseline |
winter 2019 |
0.983 |
0.000e+00 |
0.339 |
0.405 |
2.194 |
NaN |
NaN |
| forest |
winter 2019 |
0.983 |
0.100 |
0.247 |
0.373 |
1.815 |
0.422 |
2.748 |
| baseline |
all |
0.982 |
0.026 |
0.353 |
0.449 |
2.503 |
NaN |
NaN |
| forest |
all |
0.991 |
0.051 |
0.252 |
0.372 |
1.815 |
0.424 |
3.157 |
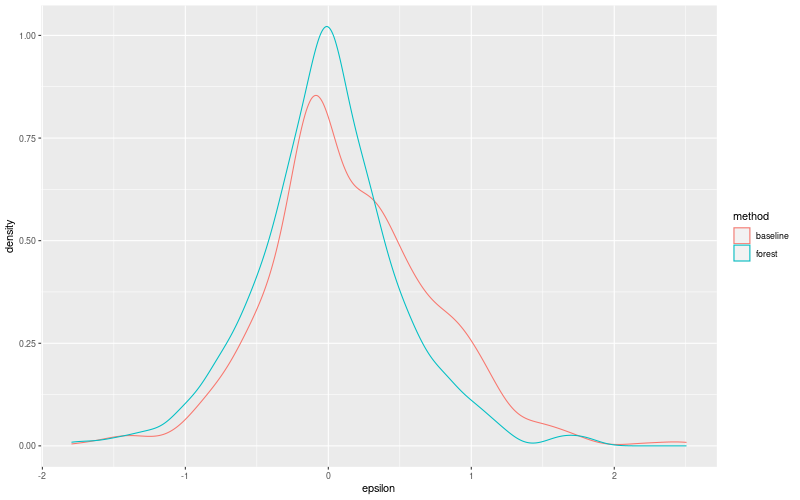
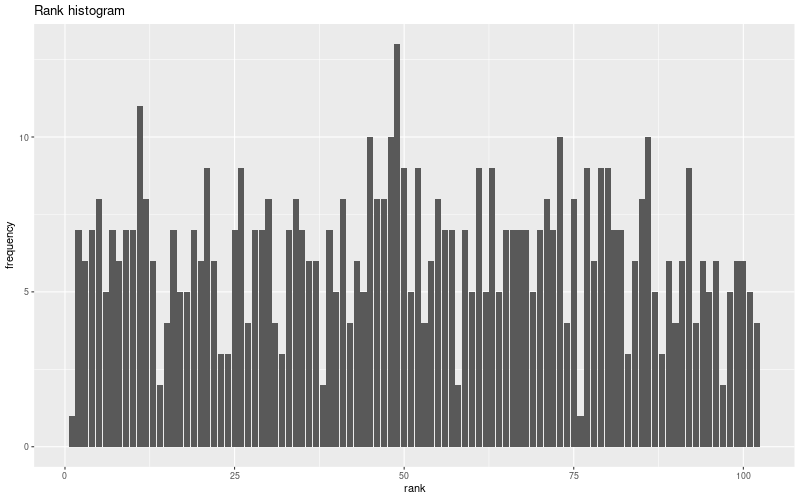
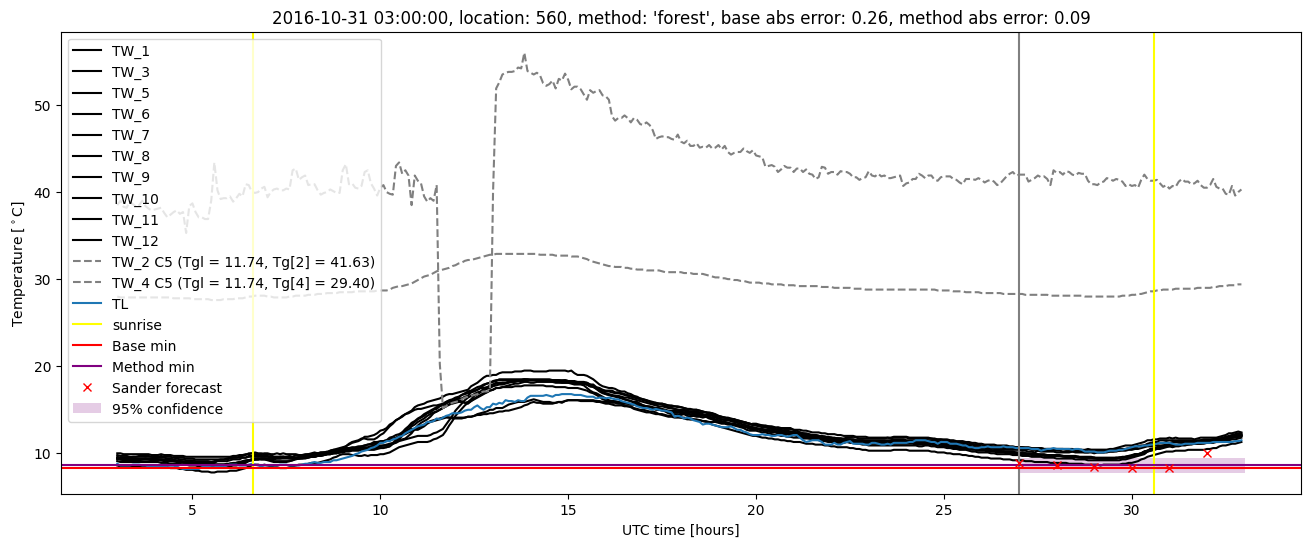
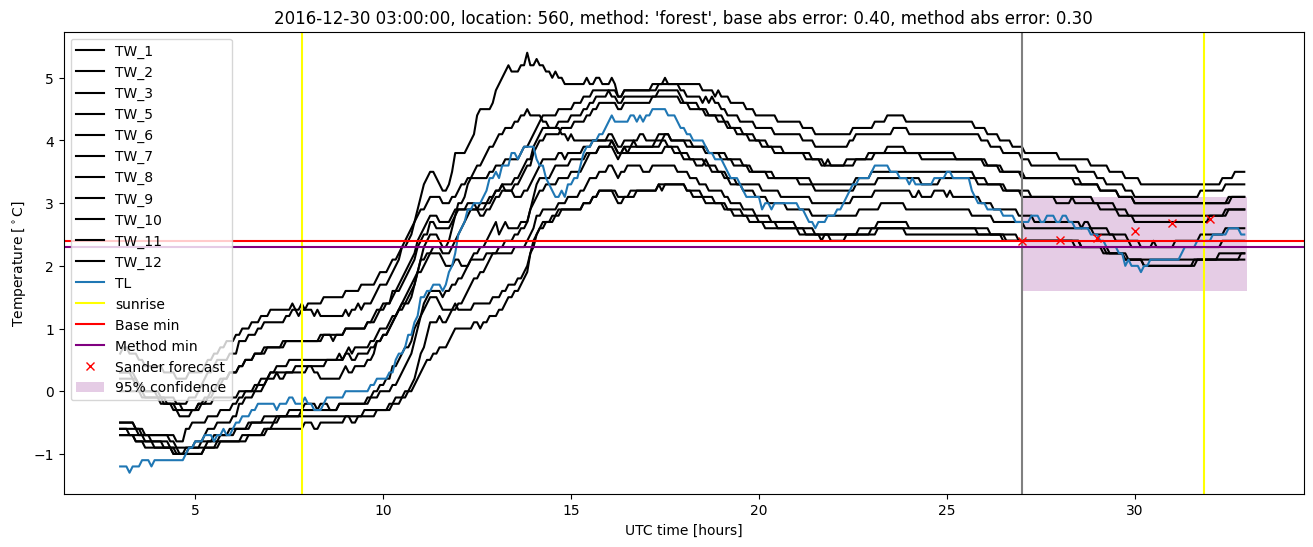
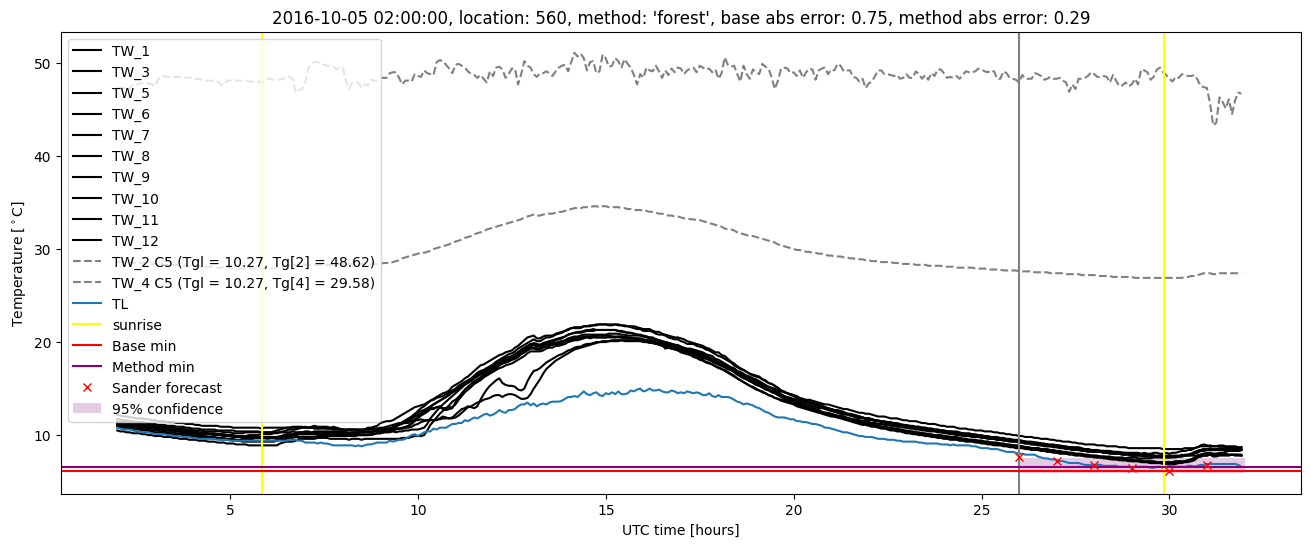
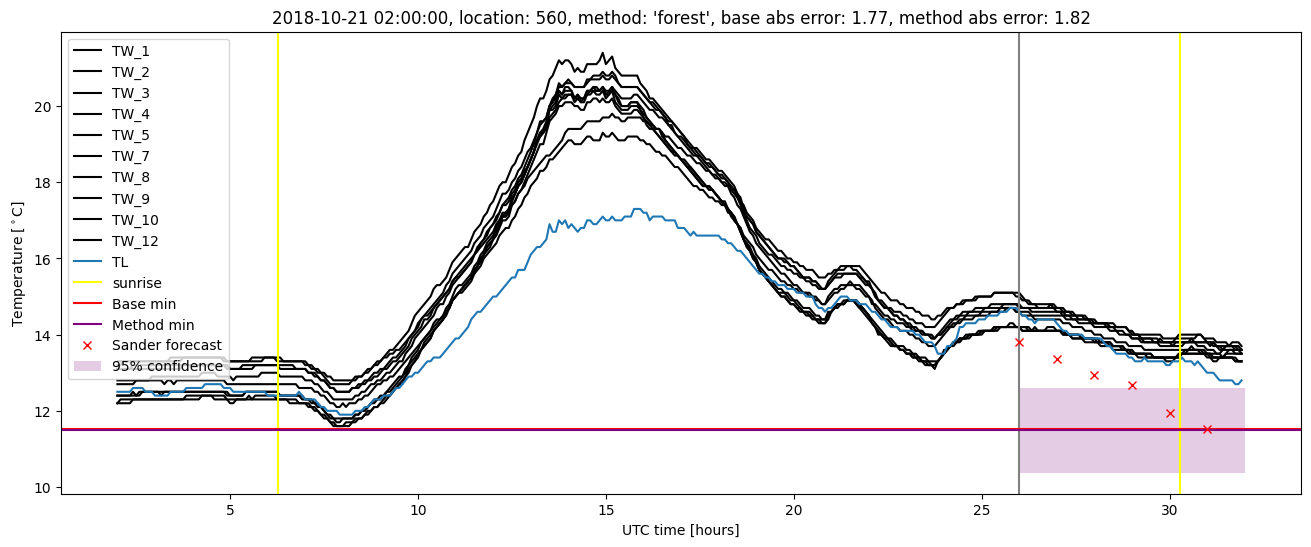
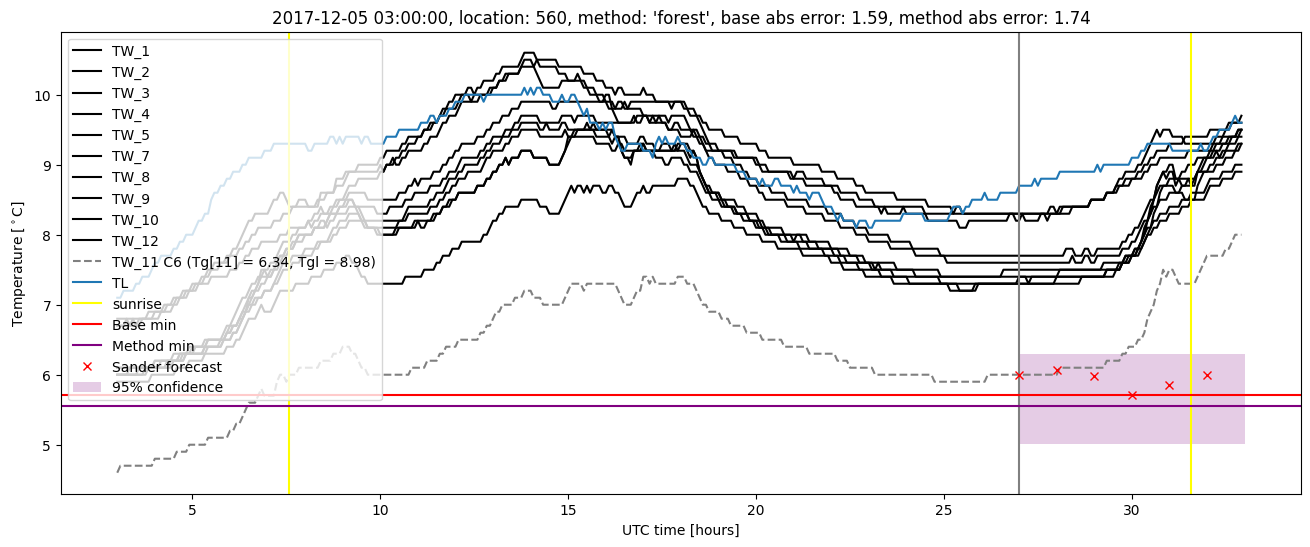
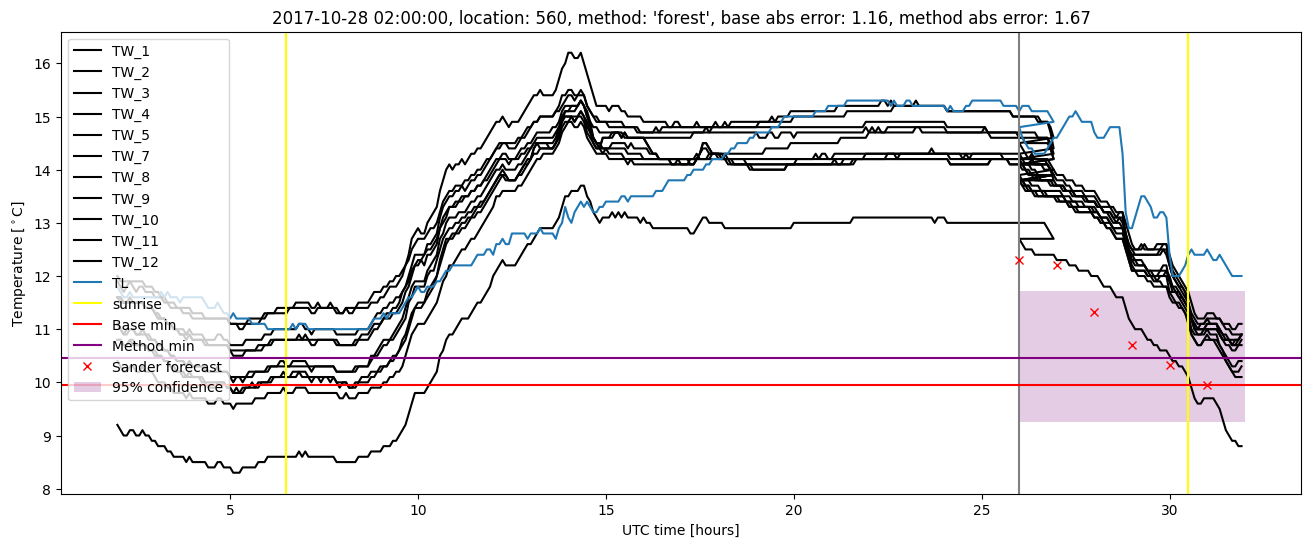
Random forest plots
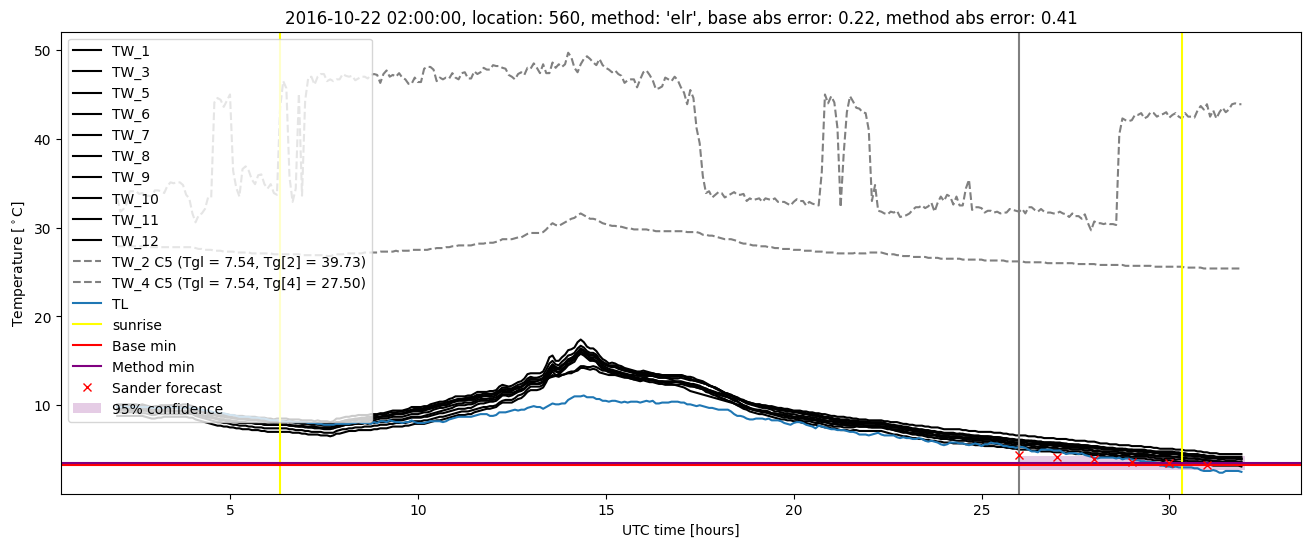
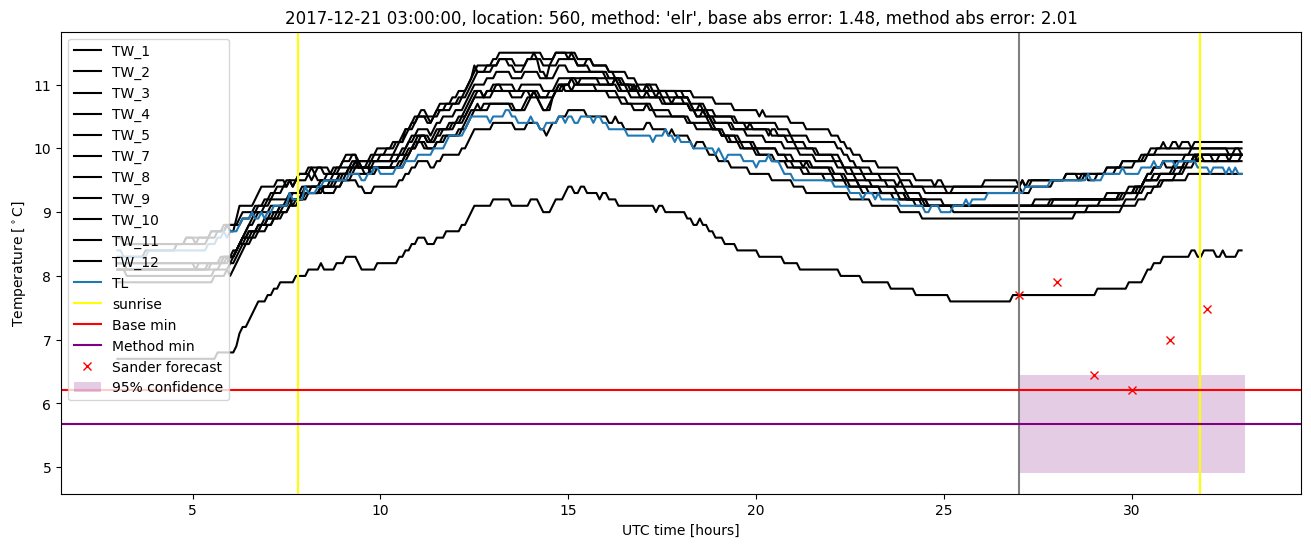
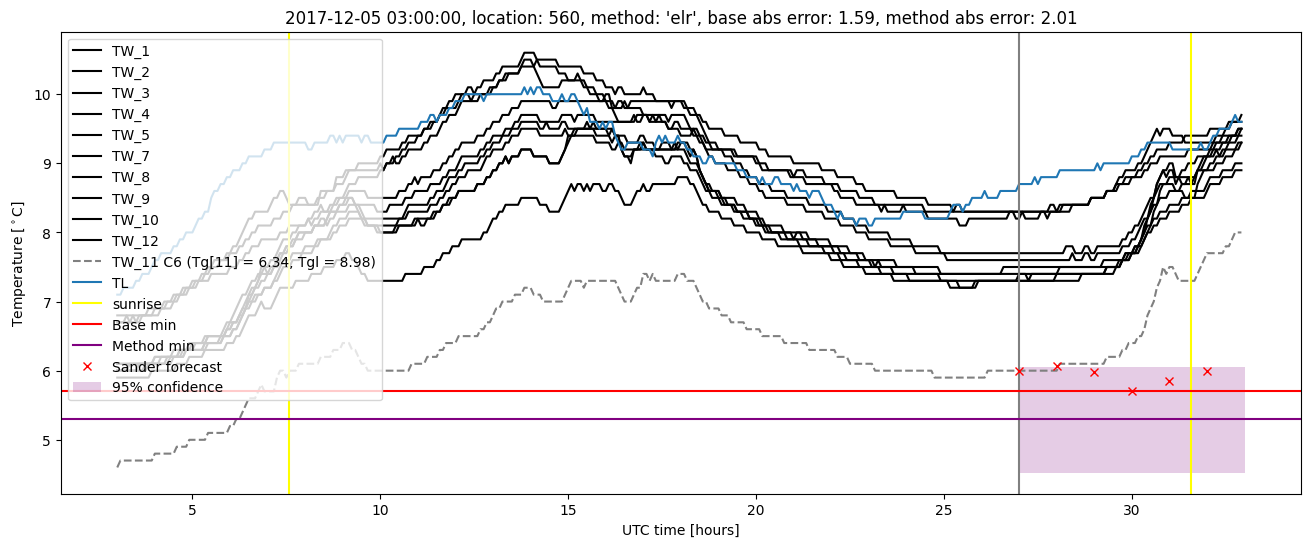
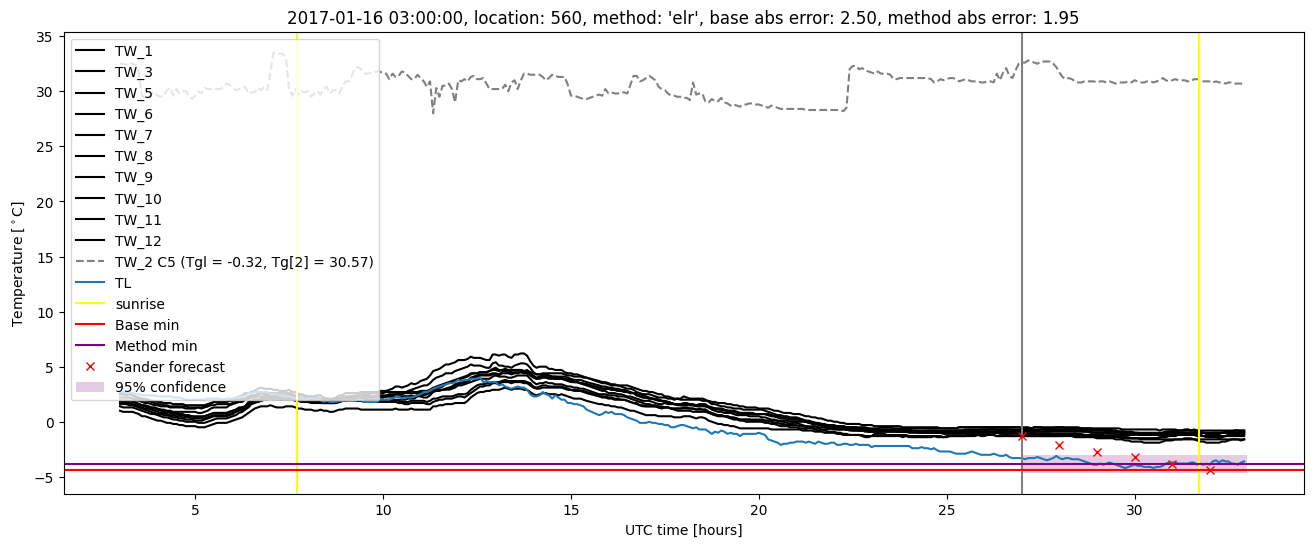
Extended logistic regression results
| names |
period |
power |
significance |
meanSquareError |
absError |
maxError |
CRPS |
IGN |
| baseline |
winter 2016 |
0.989 |
0.000e+00 |
0.294 |
0.437 |
1.524 |
NaN |
NaN |
| elr |
winter 2016 |
1.000 |
0.000e+00 |
0.217 |
0.381 |
1.345 |
0.480 |
3.795 |
| baseline |
winter 2017 |
0.968 |
0.036 |
0.407 |
0.467 |
2.503 |
NaN |
NaN |
| elr |
winter 2017 |
0.984 |
0.036 |
0.305 |
0.411 |
1.947 |
0.510 |
5.753 |
| baseline |
winter 2018 |
0.986 |
0.038 |
0.388 |
0.479 |
1.715 |
NaN |
NaN |
| elr |
winter 2018 |
0.986 |
0.115 |
0.336 |
0.432 |
2.014 |
0.525 |
6.489 |
| baseline |
winter 2019 |
0.983 |
0.000e+00 |
0.339 |
0.405 |
2.194 |
NaN |
NaN |
| elr |
winter 2019 |
0.983 |
0.100 |
0.264 |
0.398 |
1.693 |
0.495 |
5.188 |
| baseline |
all |
0.982 |
0.026 |
0.353 |
0.449 |
2.503 |
NaN |
NaN |
| elr |
all |
0.989 |
0.064 |
0.277 |
0.404 |
2.014 |
0.501 |
5.217 |
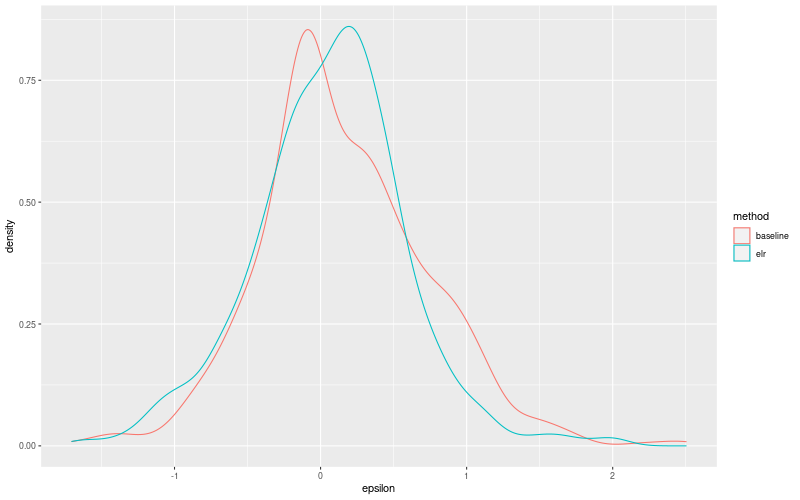
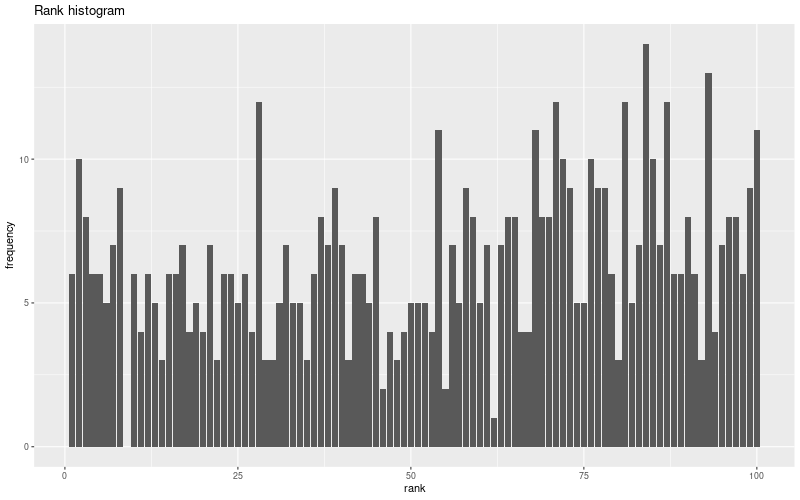
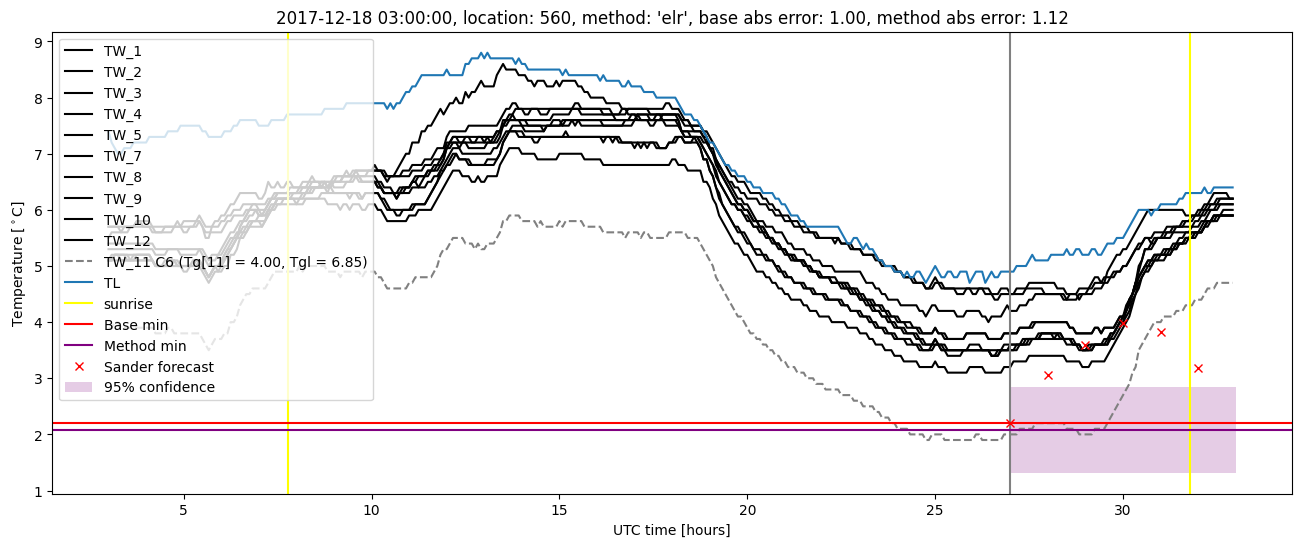
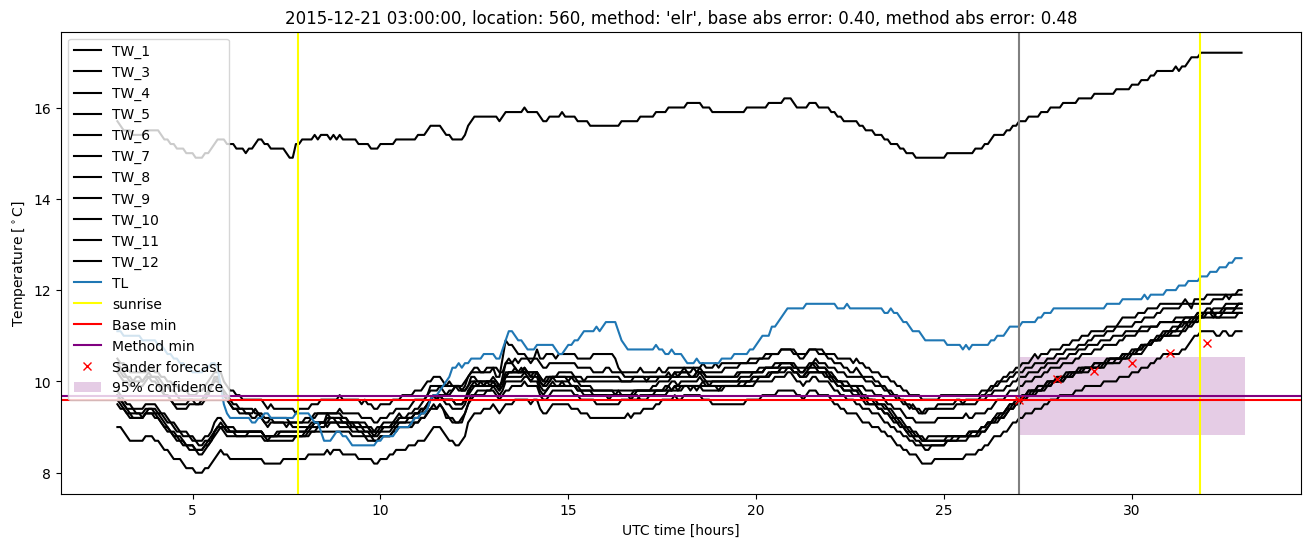
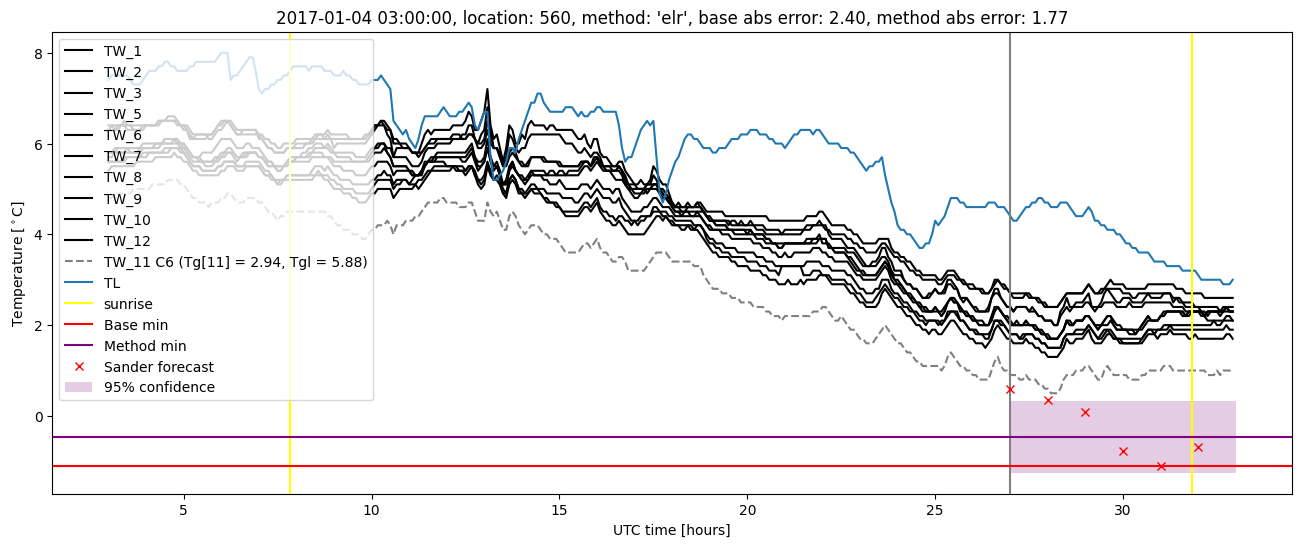
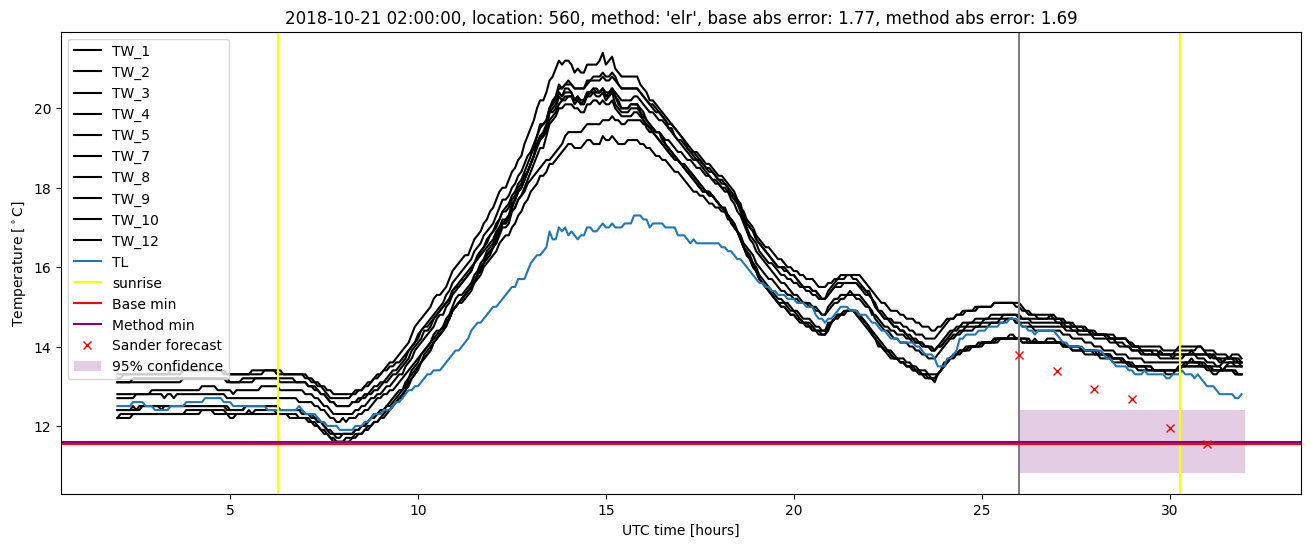
Extended logistic regression plots