GMS location: 559
Random forest results
| names |
period |
power |
significance |
meanSquareError |
absError |
maxError |
CRPS |
IGN |
| baseline |
winter 2016 |
0.979 |
0.000e+00 |
0.523 |
0.555 |
2.154 |
NaN |
NaN |
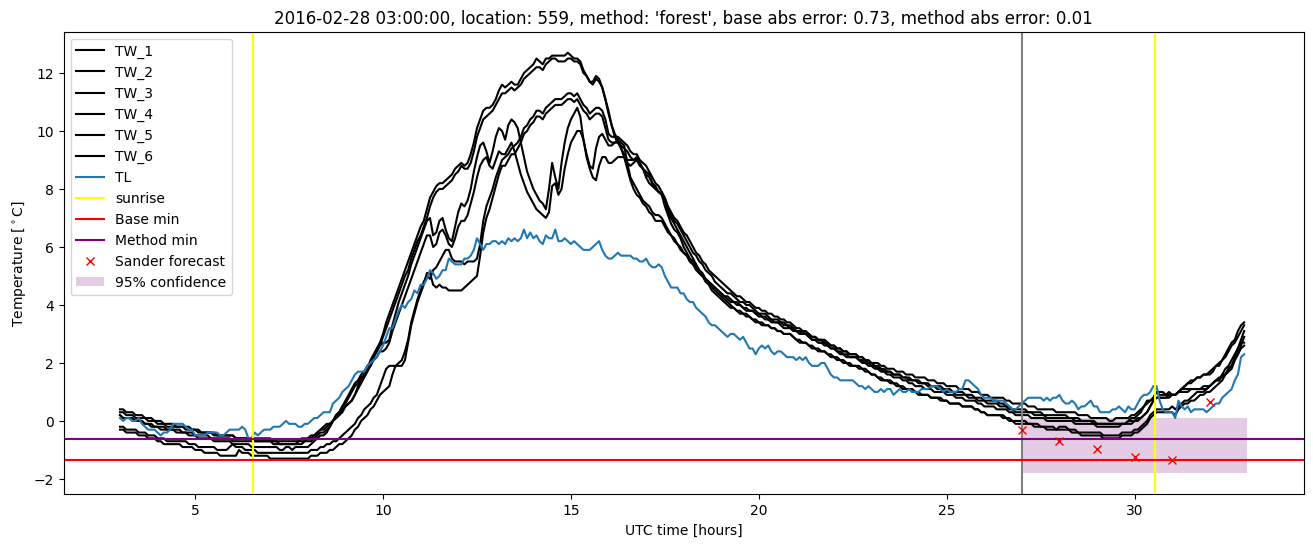
| forest |
winter 2016 |
1.000 |
0.000e+00 |
0.288 |
0.405 |
2.275 |
0.384 |
1.551 |
| baseline |
winter 2017 |
0.959 |
0.067 |
0.685 |
0.643 |
2.306 |
NaN |
NaN |
| forest |
winter 2017 |
0.976 |
0.100 |
0.358 |
0.466 |
1.654 |
0.400 |
2.004 |
| baseline |
winter 2018 |
0.986 |
0.160 |
0.564 |
0.553 |
2.684 |
NaN |
NaN |
| forest |
winter 2018 |
0.993 |
0.200 |
0.382 |
0.437 |
2.637 |
0.391 |
1.563 |
| baseline |
winter 2019 |
0.991 |
0.000e+00 |
0.644 |
0.607 |
2.487 |
NaN |
NaN |
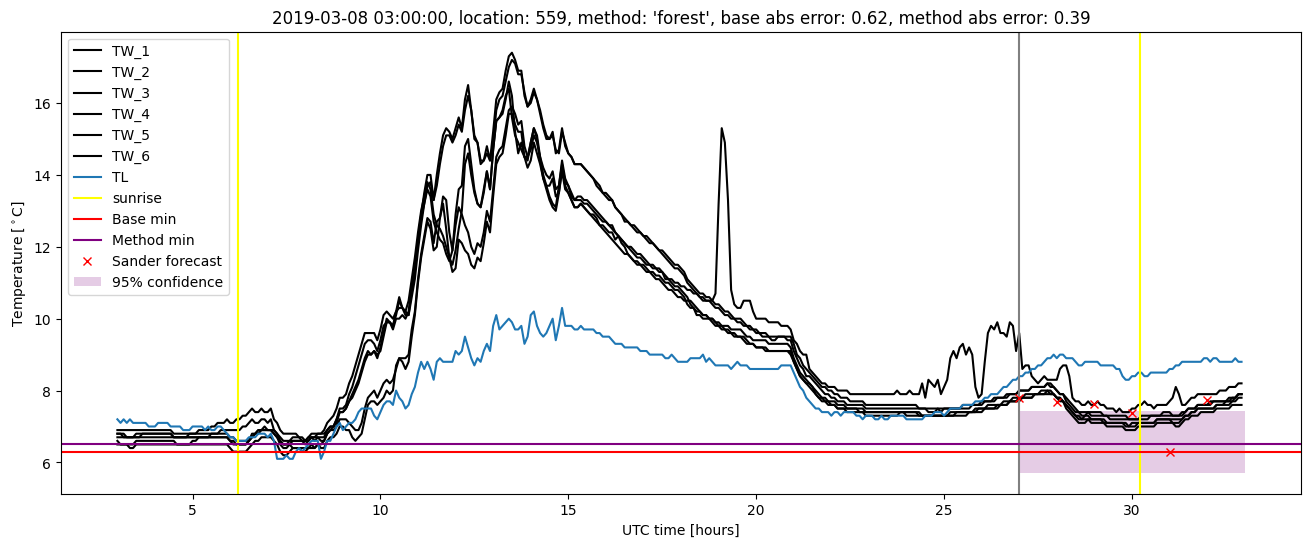
| forest |
winter 2019 |
0.991 |
0.083 |
0.325 |
0.427 |
1.892 |
0.404 |
1.862 |
| baseline |
all |
0.979 |
0.076 |
0.595 |
0.585 |
2.684 |
NaN |
NaN |
| forest |
all |
0.991 |
0.114 |
0.336 |
0.432 |
2.637 |
0.393 |
1.720 |
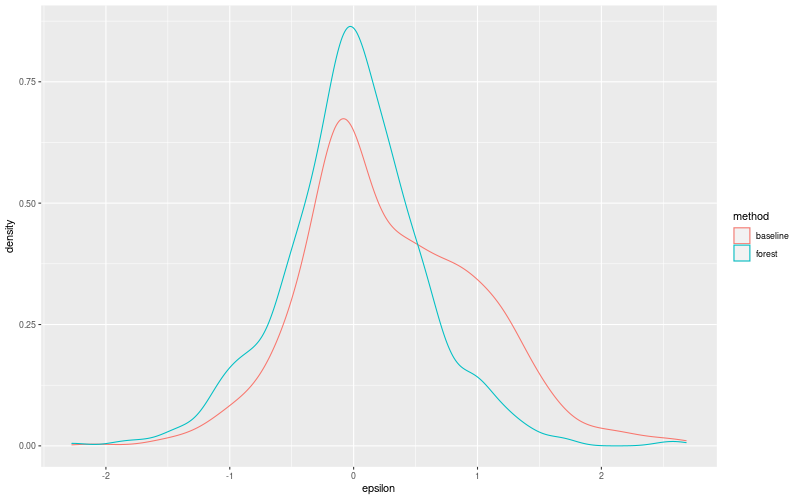
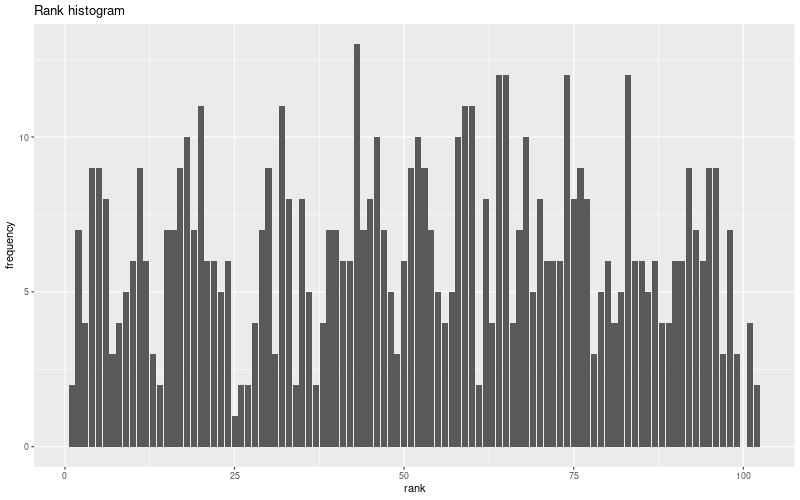
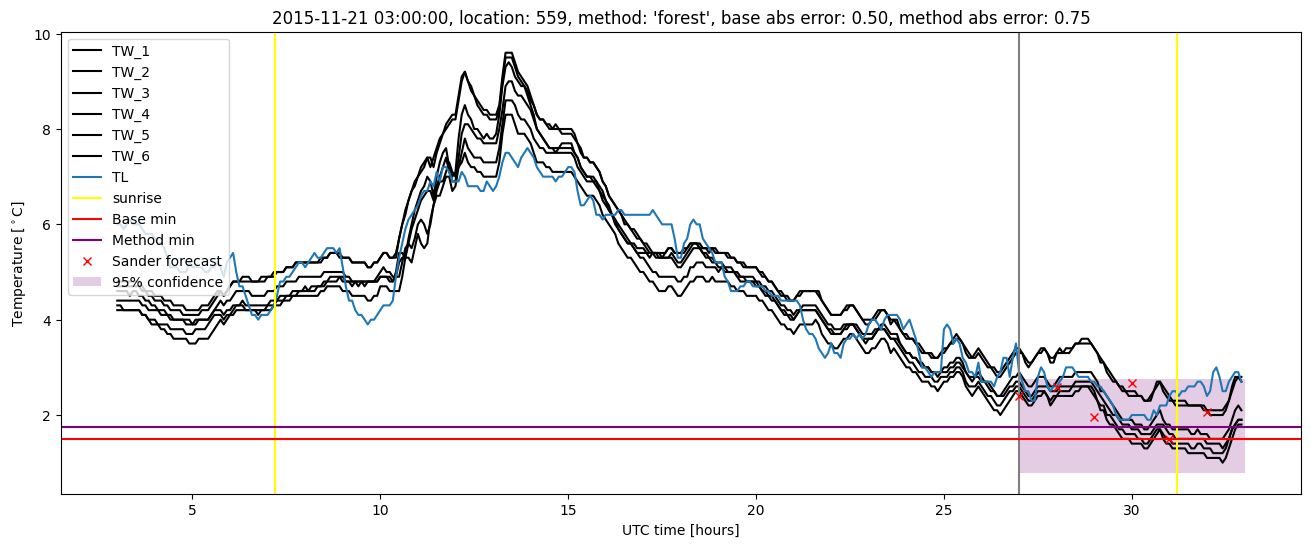
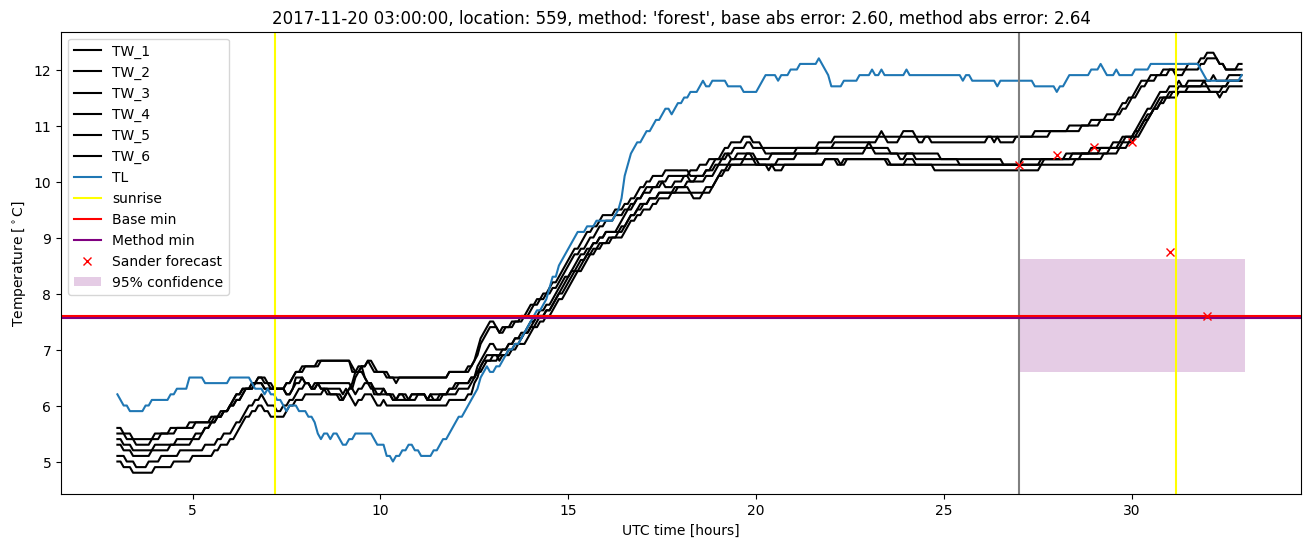
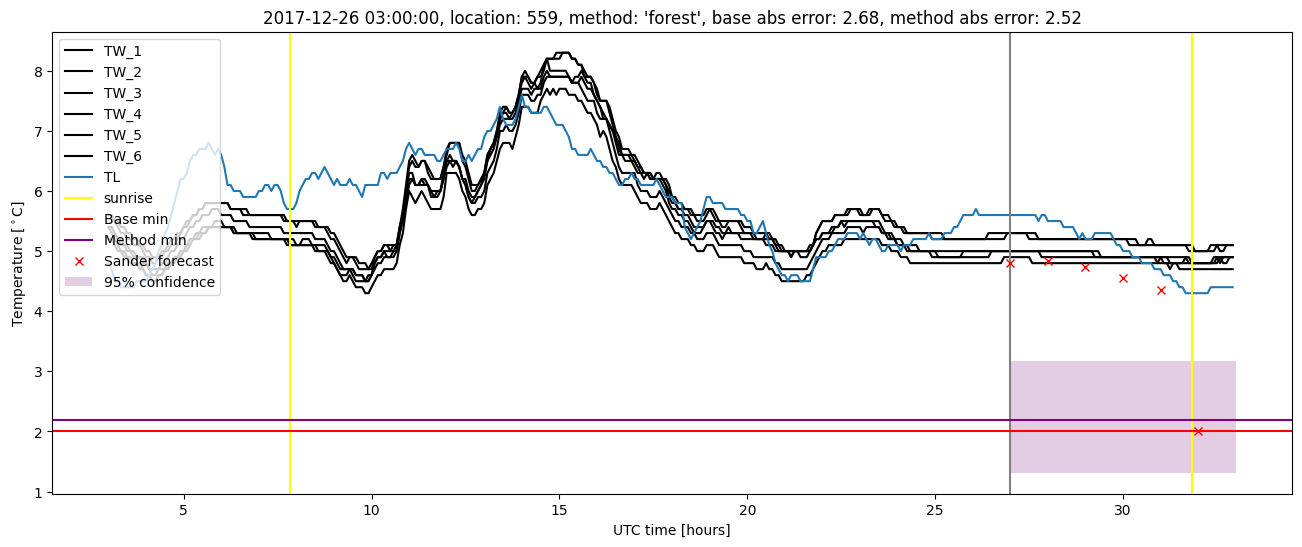
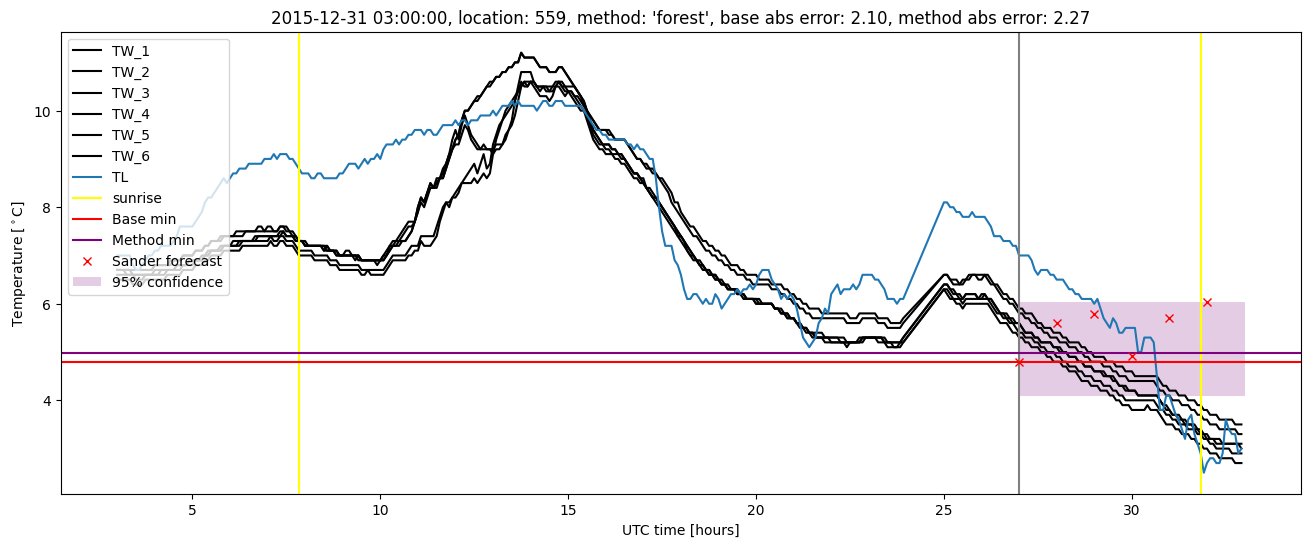
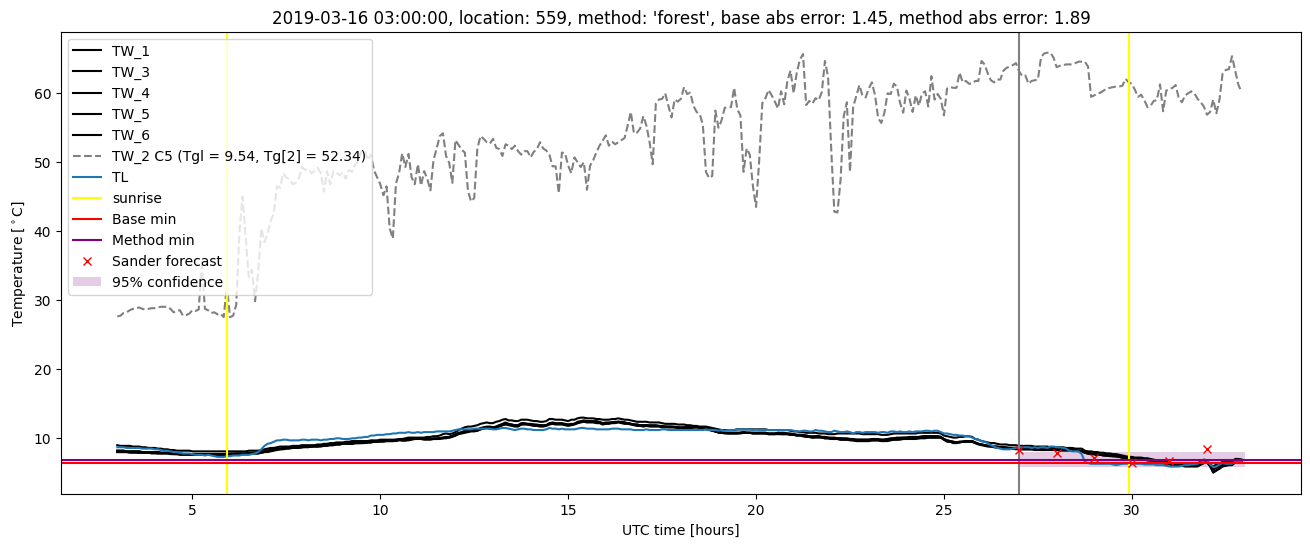
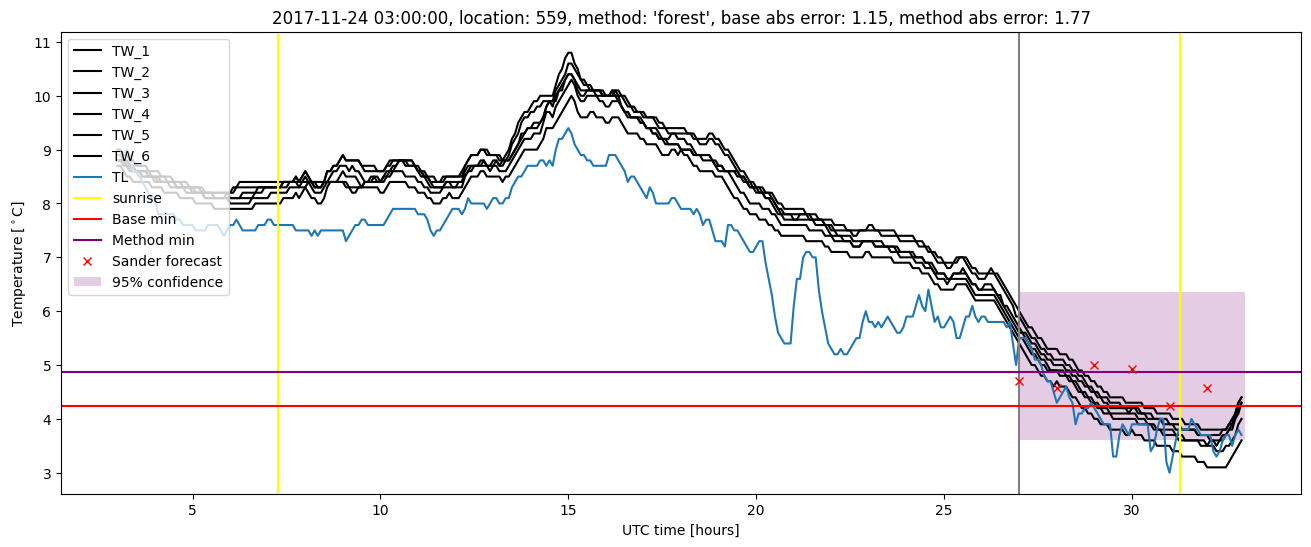
Random forest plots
Extended logistic regression results
| names |
period |
power |
significance |
meanSquareError |
absError |
maxError |
CRPS |
IGN |
| baseline |
winter 2016 |
0.979 |
0.000e+00 |
0.523 |
0.555 |
2.154 |
NaN |
NaN |
| elr |
winter 2016 |
1.000 |
0.000e+00 |
0.295 |
0.429 |
1.963 |
0.490 |
2.438 |
| baseline |
winter 2017 |
0.959 |
0.067 |
0.685 |
0.643 |
2.306 |
NaN |
NaN |
| elr |
winter 2017 |
0.984 |
0.033 |
0.364 |
0.476 |
1.696 |
0.495 |
2.913 |
| baseline |
winter 2018 |
0.986 |
0.160 |
0.564 |
0.553 |
2.684 |
NaN |
NaN |
| elr |
winter 2018 |
0.993 |
0.160 |
0.378 |
0.440 |
2.953 |
0.490 |
2.868 |
| baseline |
winter 2019 |
0.991 |
0.000e+00 |
0.644 |
0.607 |
2.487 |
NaN |
NaN |
| elr |
winter 2019 |
1.000 |
0.083 |
0.298 |
0.415 |
1.793 |
0.514 |
2.766 |
| baseline |
all |
0.979 |
0.076 |
0.595 |
0.585 |
2.684 |
NaN |
NaN |
| elr |
all |
0.995 |
0.076 |
0.334 |
0.440 |
2.953 |
0.496 |
2.725 |
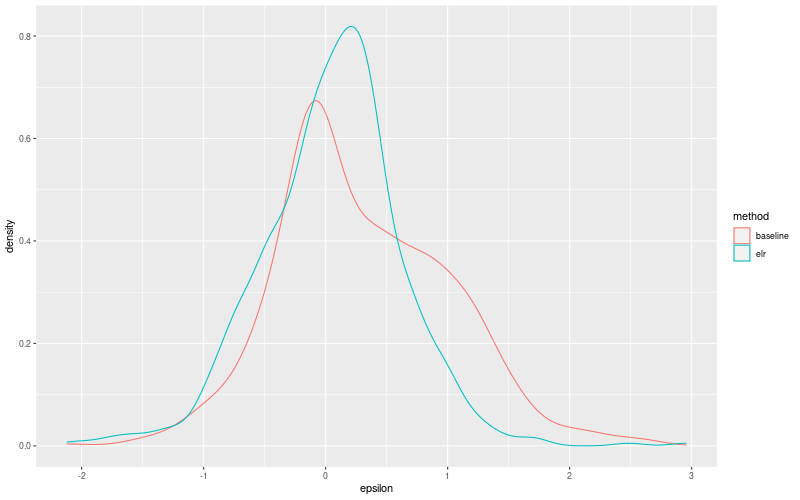
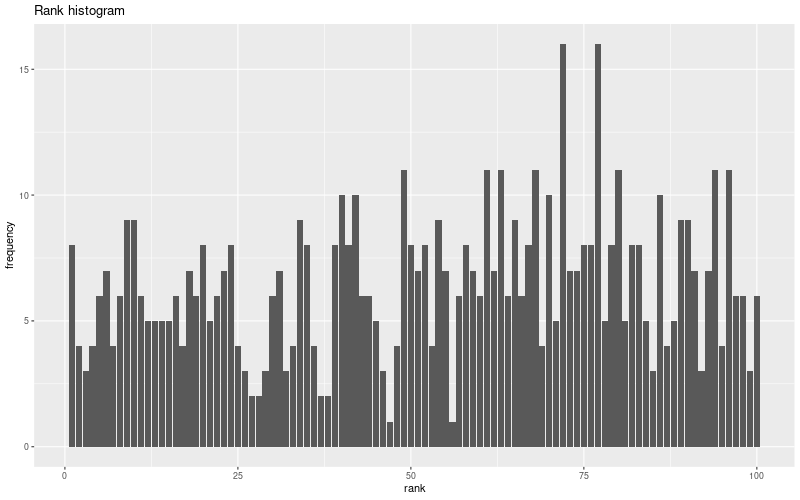
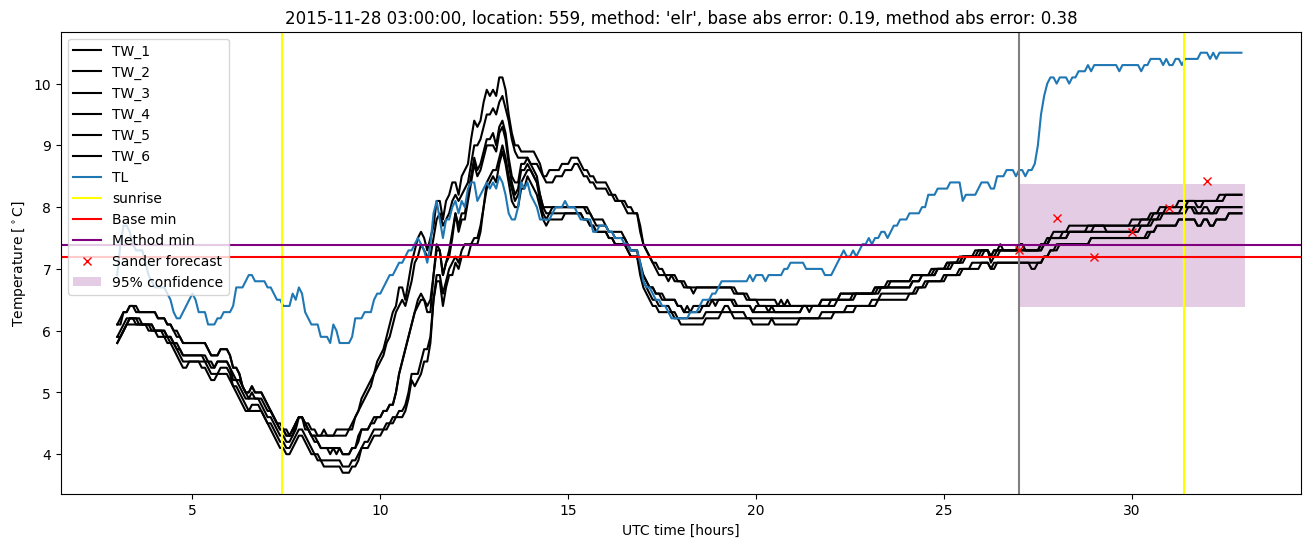
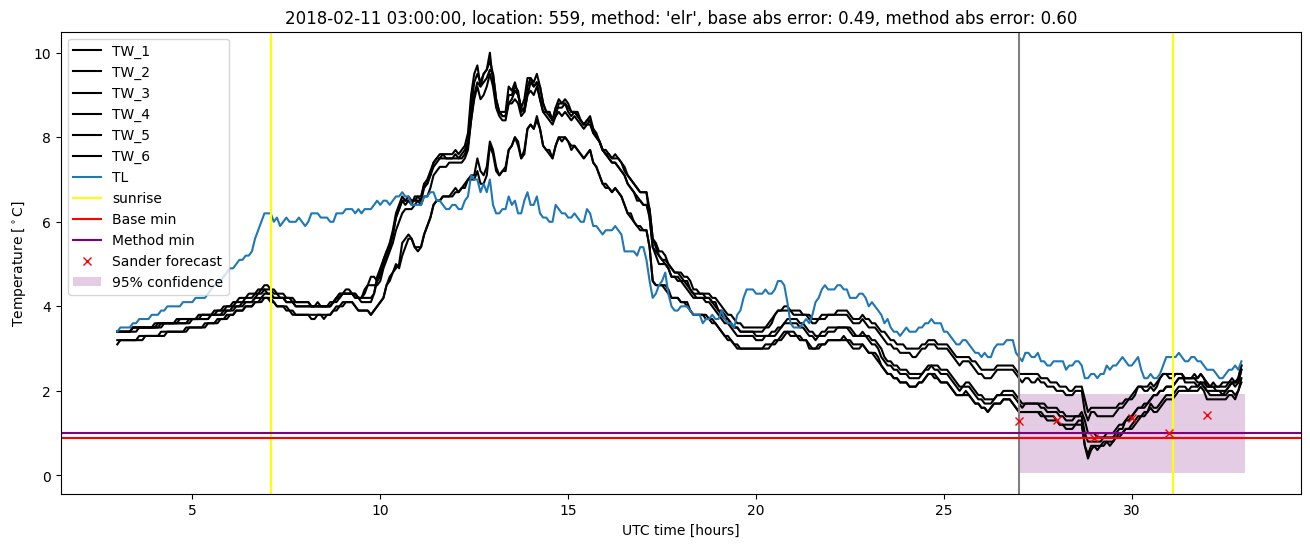
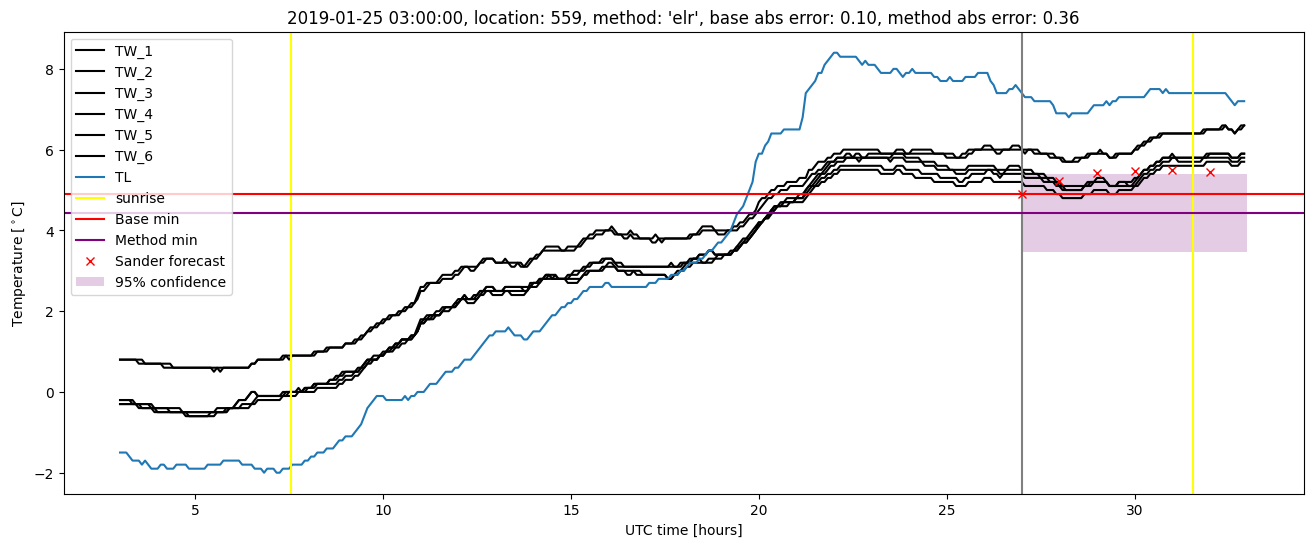
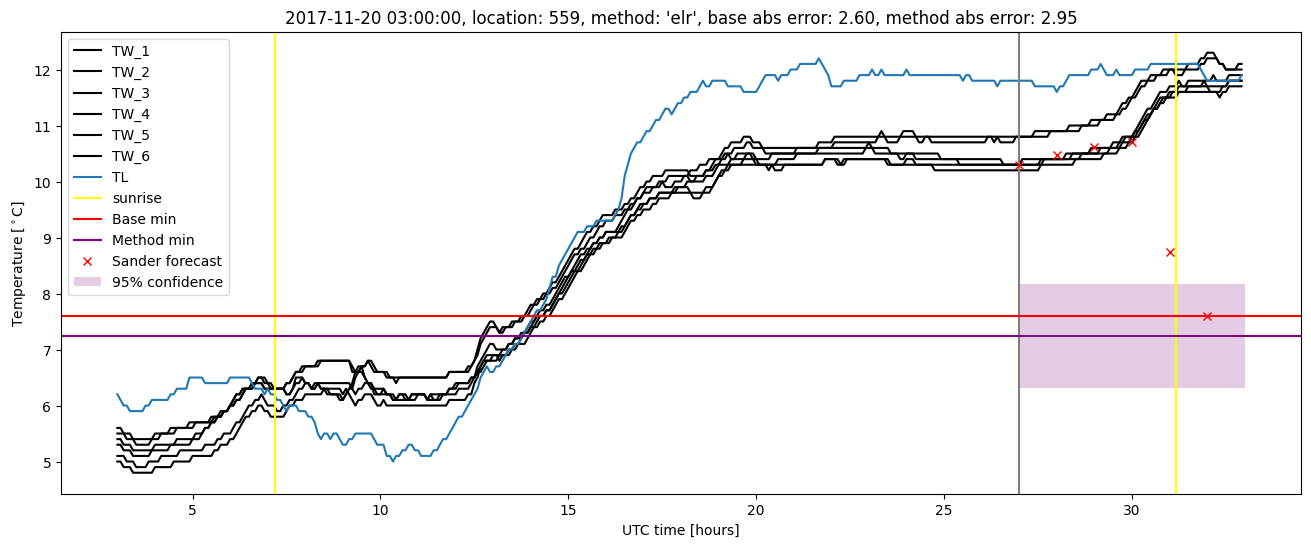
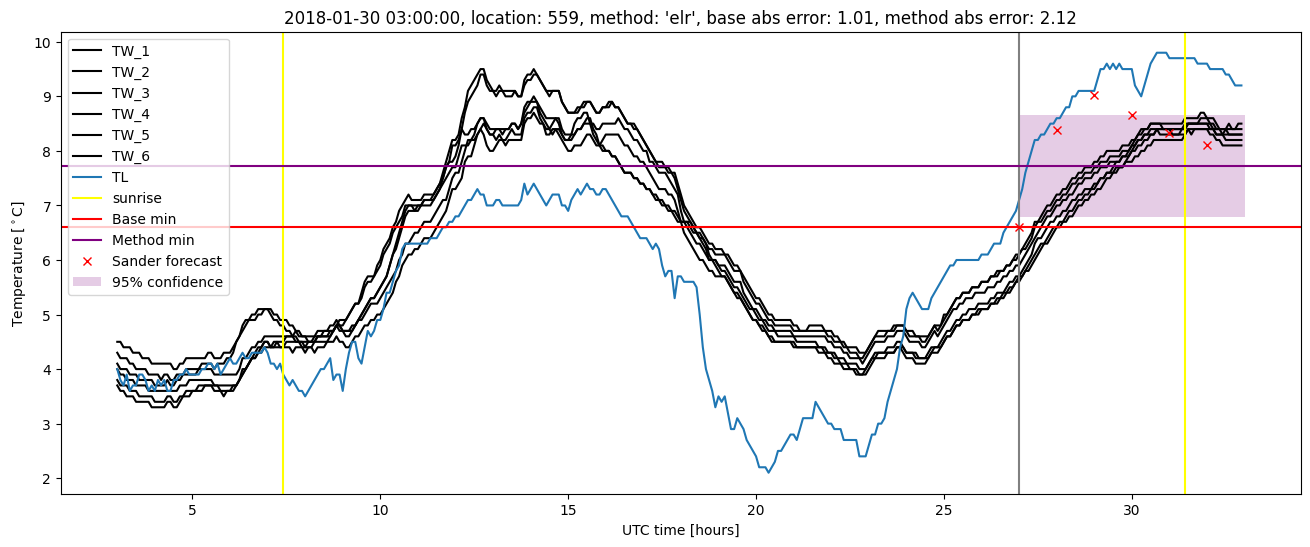
Extended logistic regression plots