GMS location: 558
Random forest results
| names |
period |
power |
significance |
meanSquareError |
absError |
maxError |
CRPS |
IGN |
| baseline |
winter 2016 |
0.989 |
0.000e+00 |
0.349 |
0.447 |
2.201 |
NaN |
NaN |
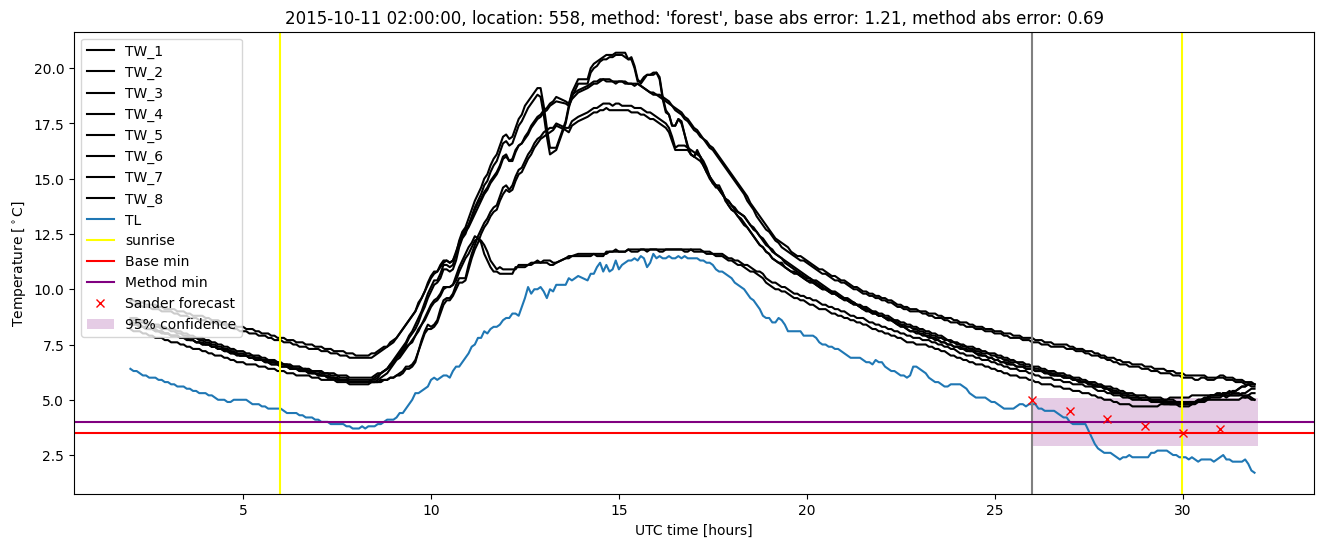
| forest |
winter 2016 |
1.000 |
0.059 |
0.253 |
0.368 |
2.066 |
0.437 |
2.799 |
| baseline |
winter 2017 |
0.968 |
0.033 |
0.462 |
0.527 |
2.029 |
NaN |
NaN |
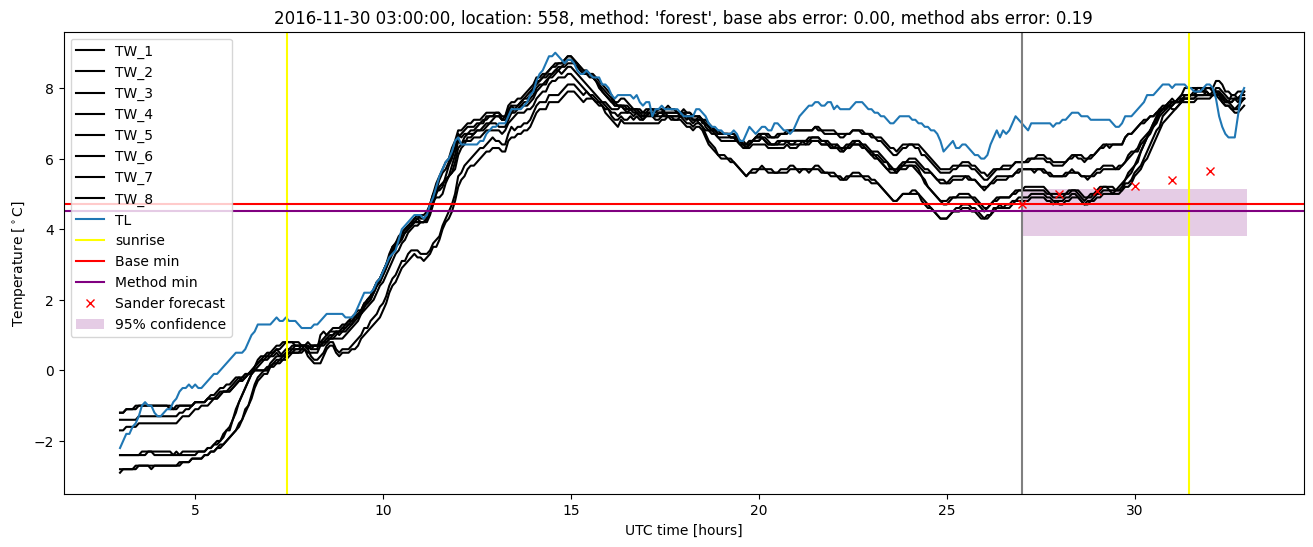
| forest |
winter 2017 |
0.959 |
0.033 |
0.299 |
0.415 |
1.456 |
0.443 |
3.074 |
| baseline |
winter 2018 |
0.994 |
0.080 |
0.301 |
0.435 |
1.576 |
NaN |
NaN |
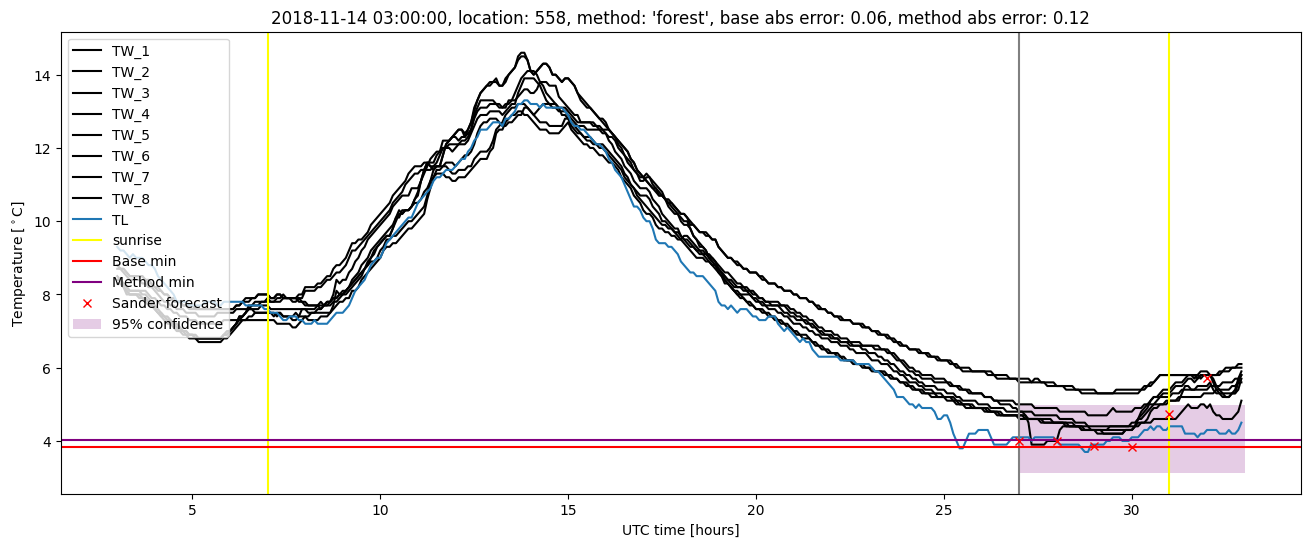
| forest |
winter 2018 |
0.994 |
0.120 |
0.234 |
0.366 |
1.487 |
0.440 |
2.224 |
| baseline |
winter 2019 |
1.000 |
0.071 |
0.376 |
0.456 |
2.044 |
NaN |
NaN |
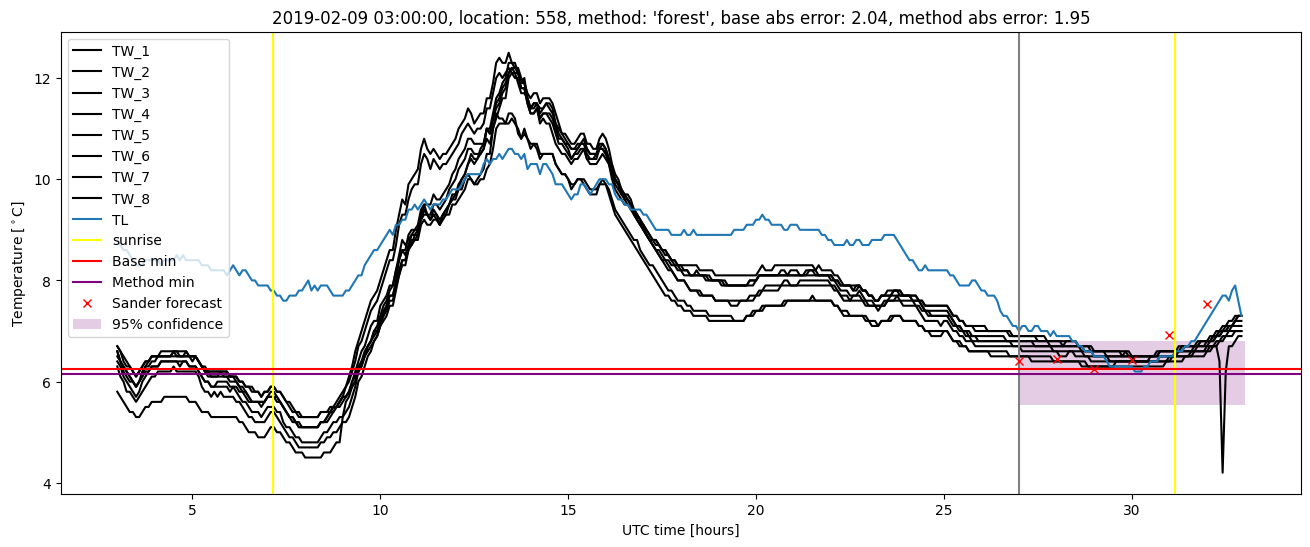
| forest |
winter 2019 |
1.000 |
0.071 |
0.281 |
0.390 |
1.952 |
0.448 |
2.988 |
| baseline |
all |
0.989 |
0.046 |
0.368 |
0.464 |
2.201 |
NaN |
NaN |
| forest |
all |
0.990 |
0.070 |
0.265 |
0.383 |
2.066 |
0.441 |
2.755 |
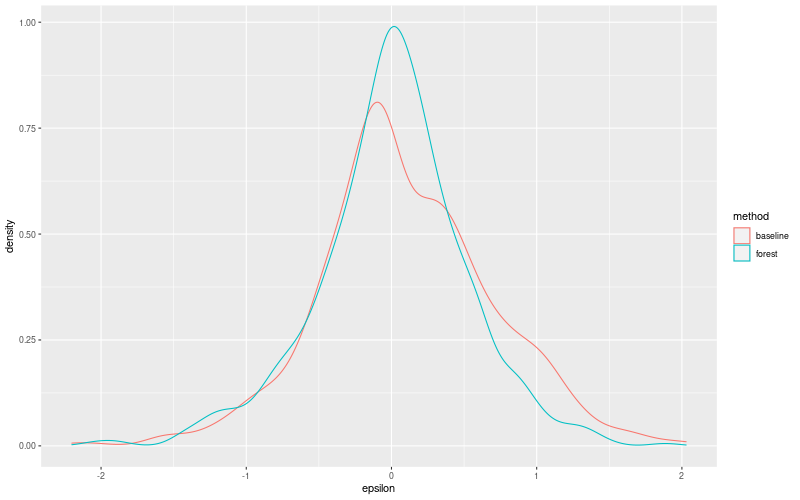
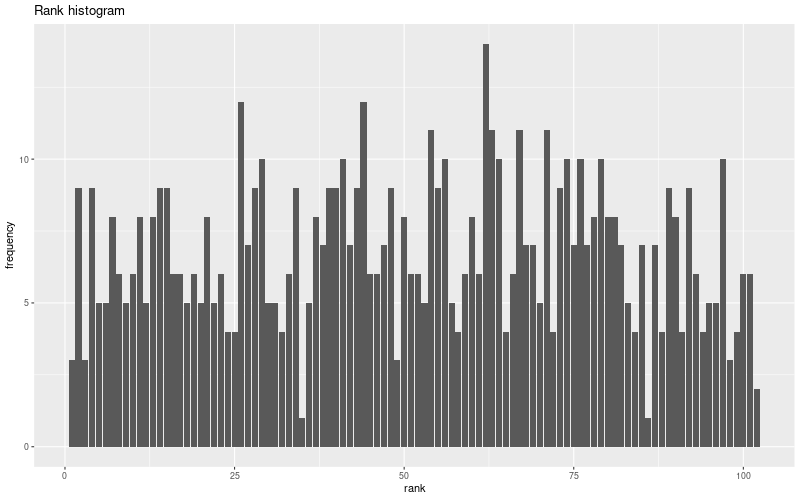
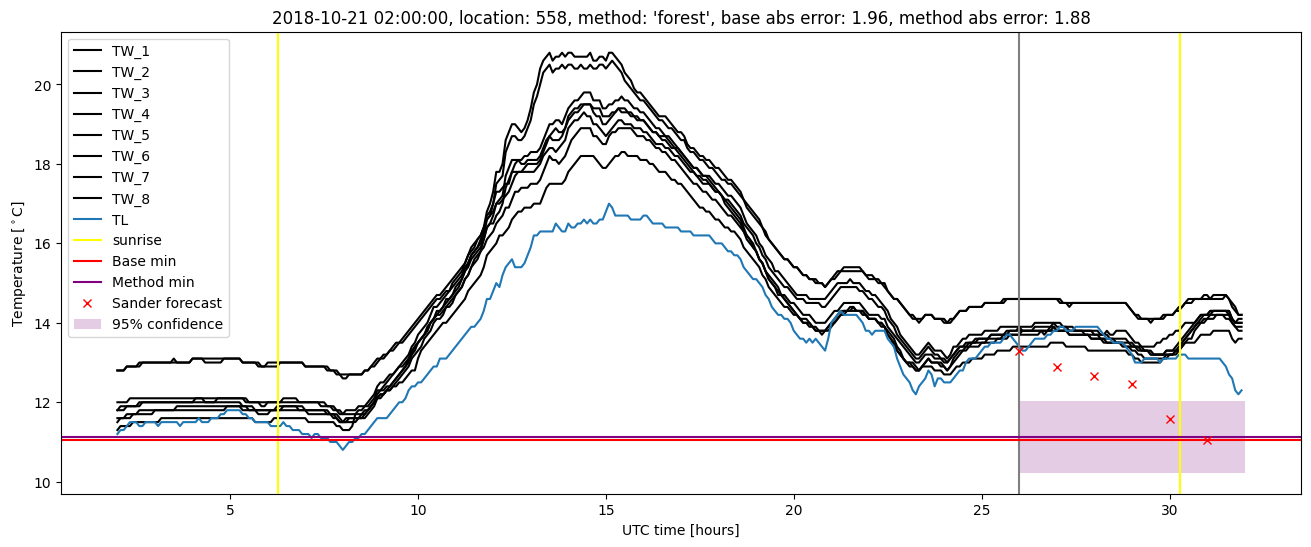
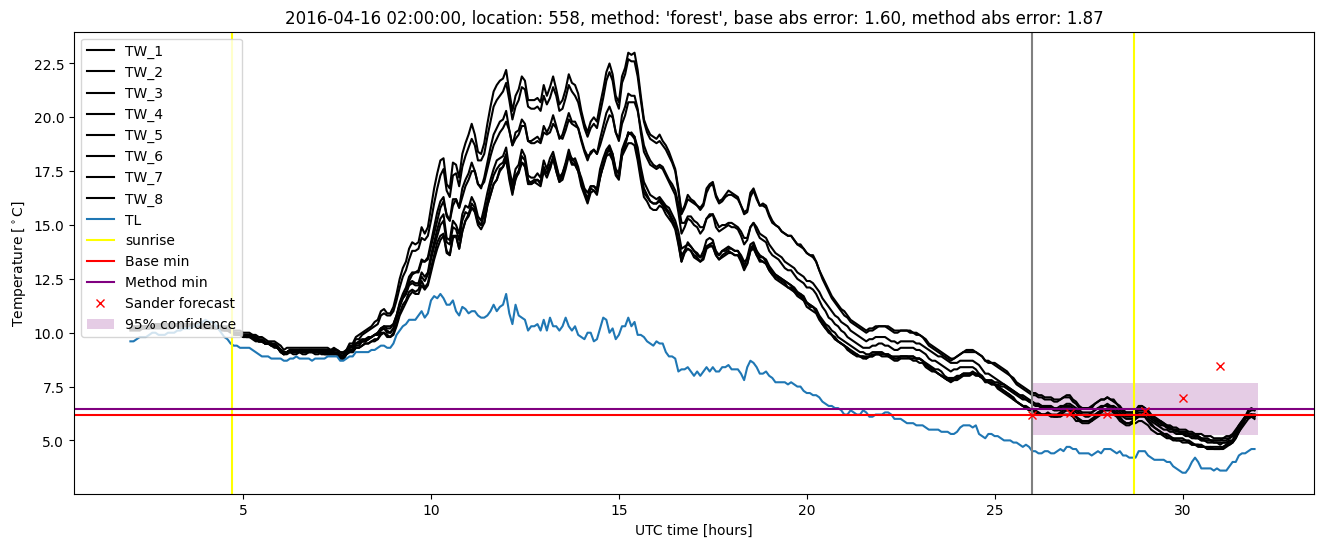
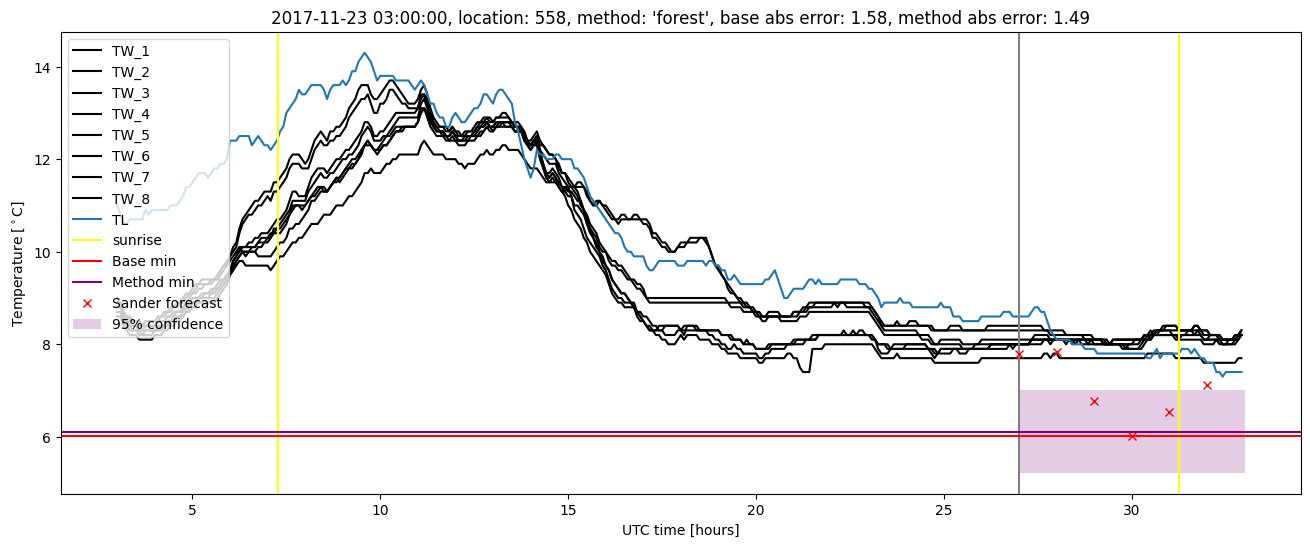
Random forest plots

Extended logistic regression results
| names |
period |
power |
significance |
meanSquareError |
absError |
maxError |
CRPS |
IGN |
| baseline |
winter 2016 |
0.989 |
0.000e+00 |
0.349 |
0.447 |
2.201 |
NaN |
NaN |
| elr |
winter 2016 |
0.995 |
0.059 |
0.282 |
0.413 |
2.127 |
0.506 |
4.280 |
| baseline |
winter 2017 |
0.968 |
0.033 |
0.462 |
0.527 |
2.029 |
NaN |
NaN |
| elr |
winter 2017 |
0.968 |
0.033 |
0.321 |
0.437 |
1.596 |
0.537 |
4.618 |
| baseline |
winter 2018 |
0.994 |
0.080 |
0.301 |
0.435 |
1.576 |
NaN |
NaN |
| elr |
winter 2018 |
0.987 |
0.120 |
0.285 |
0.404 |
1.766 |
0.518 |
4.171 |
| baseline |
winter 2019 |
1.000 |
0.071 |
0.376 |
0.456 |
2.044 |
NaN |
NaN |
| elr |
winter 2019 |
1.000 |
0.143 |
0.336 |
0.436 |
1.836 |
0.526 |
5.142 |
| baseline |
all |
0.989 |
0.046 |
0.368 |
0.464 |
2.201 |
NaN |
NaN |
| elr |
all |
0.989 |
0.081 |
0.304 |
0.421 |
2.127 |
0.520 |
4.522 |
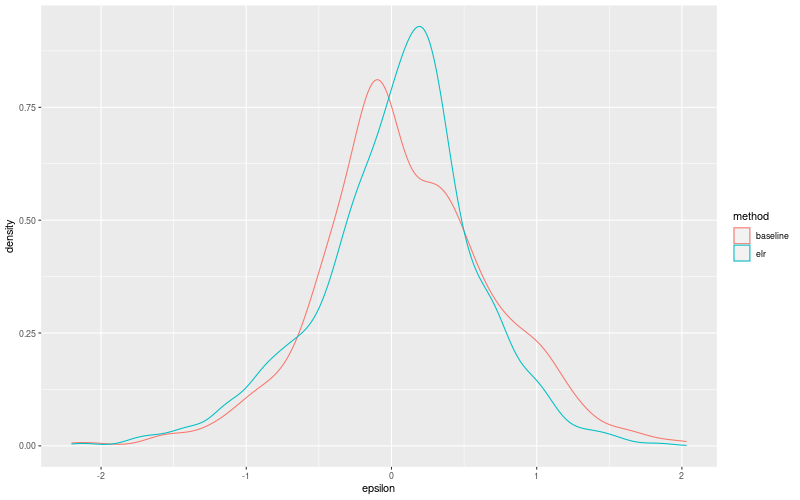
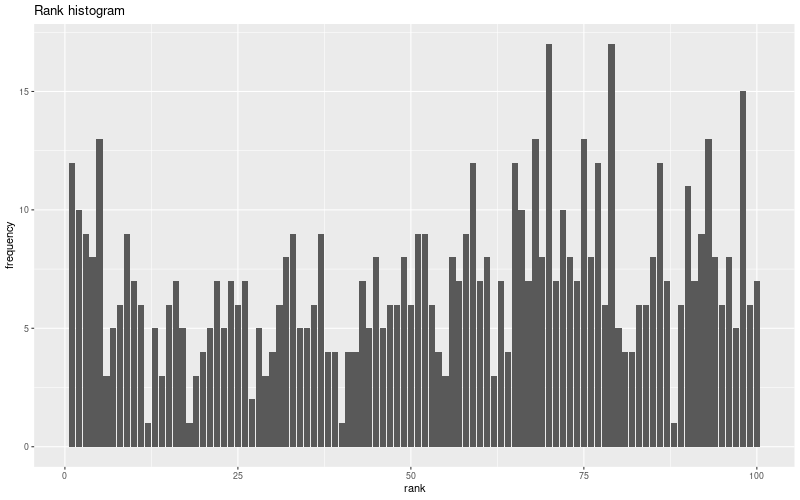
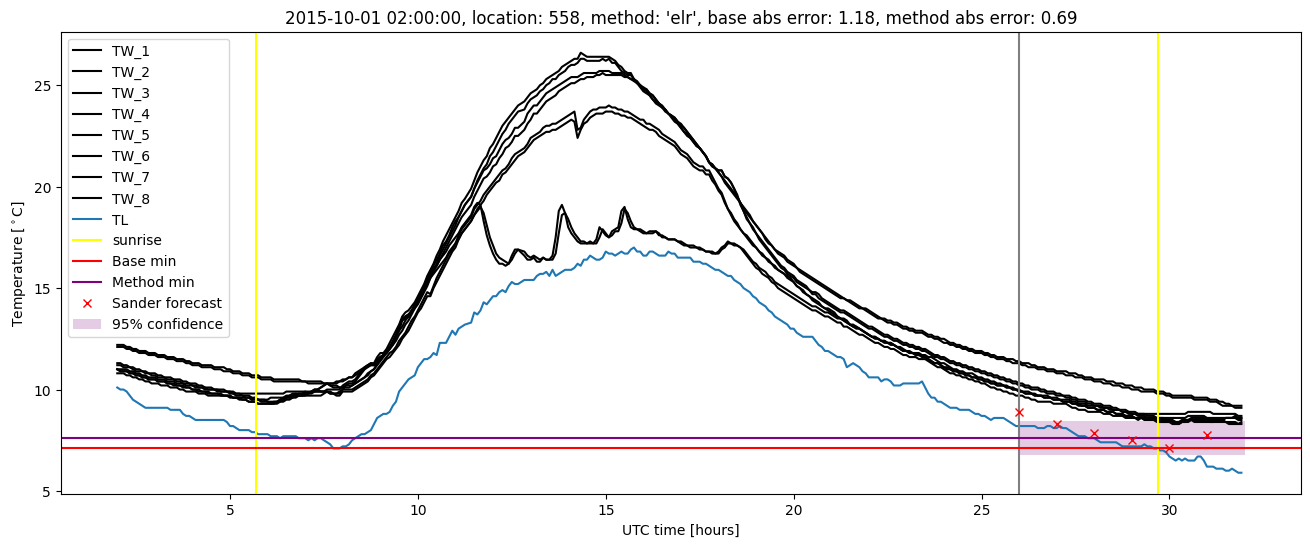
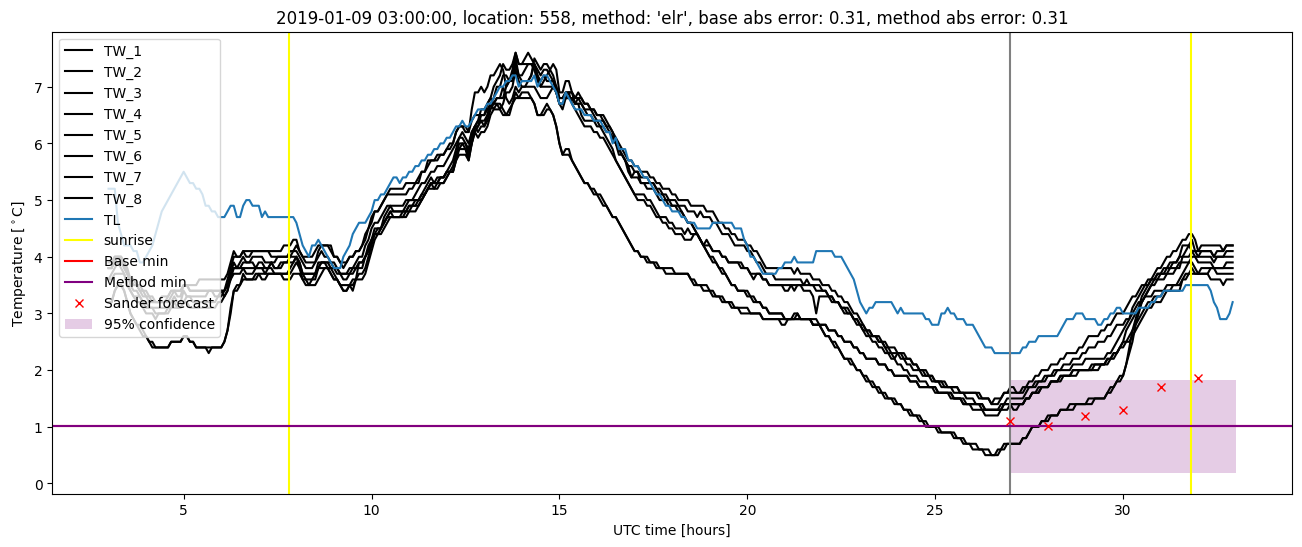
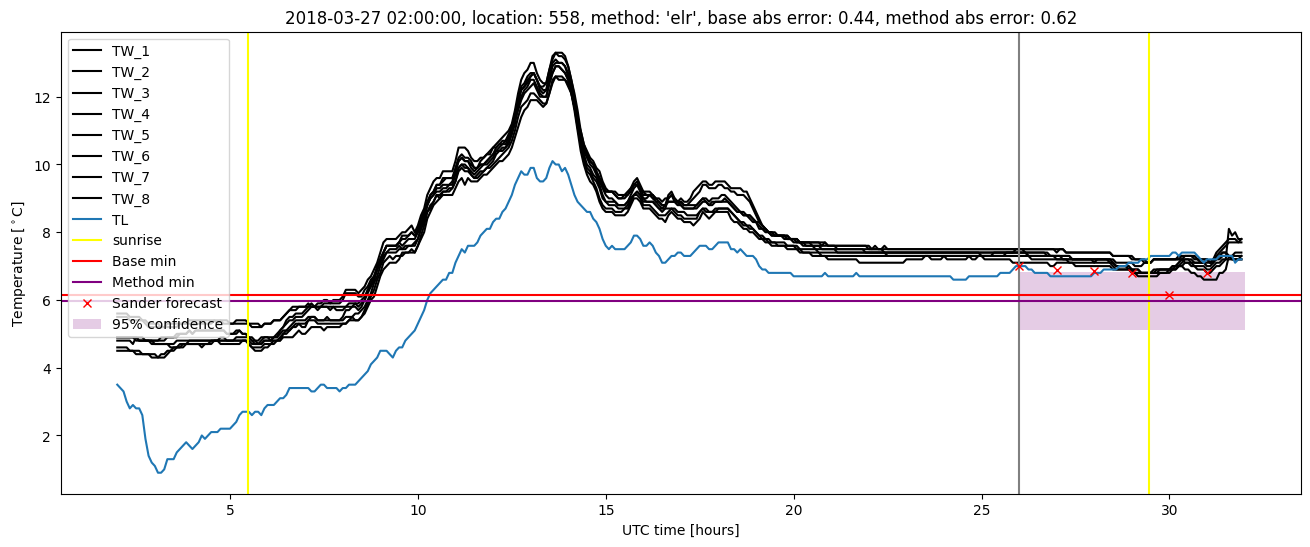
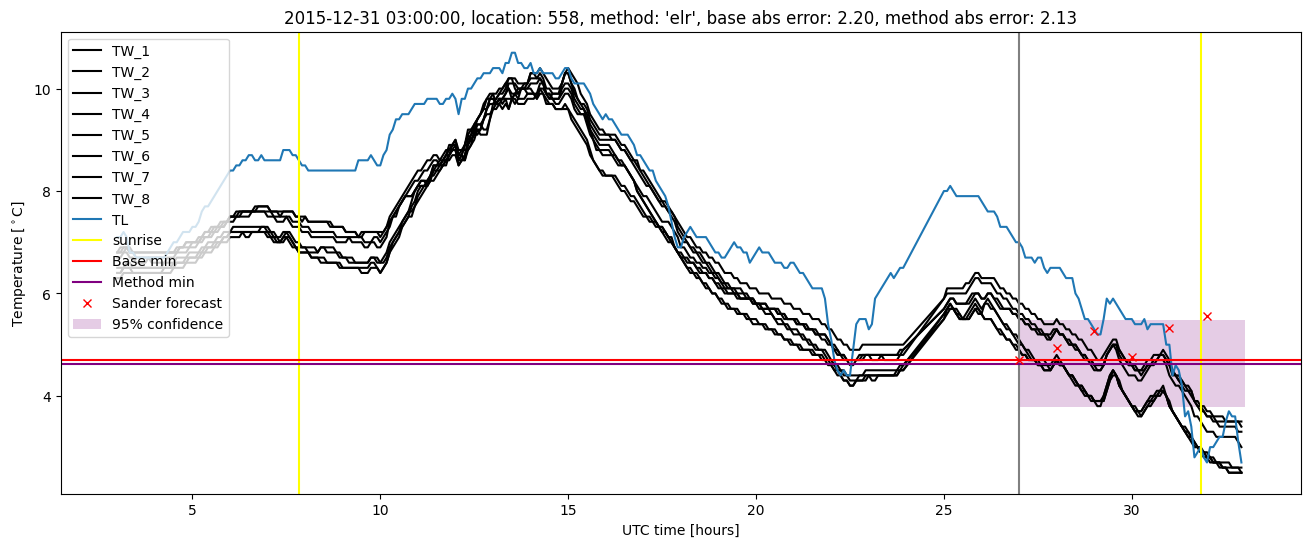
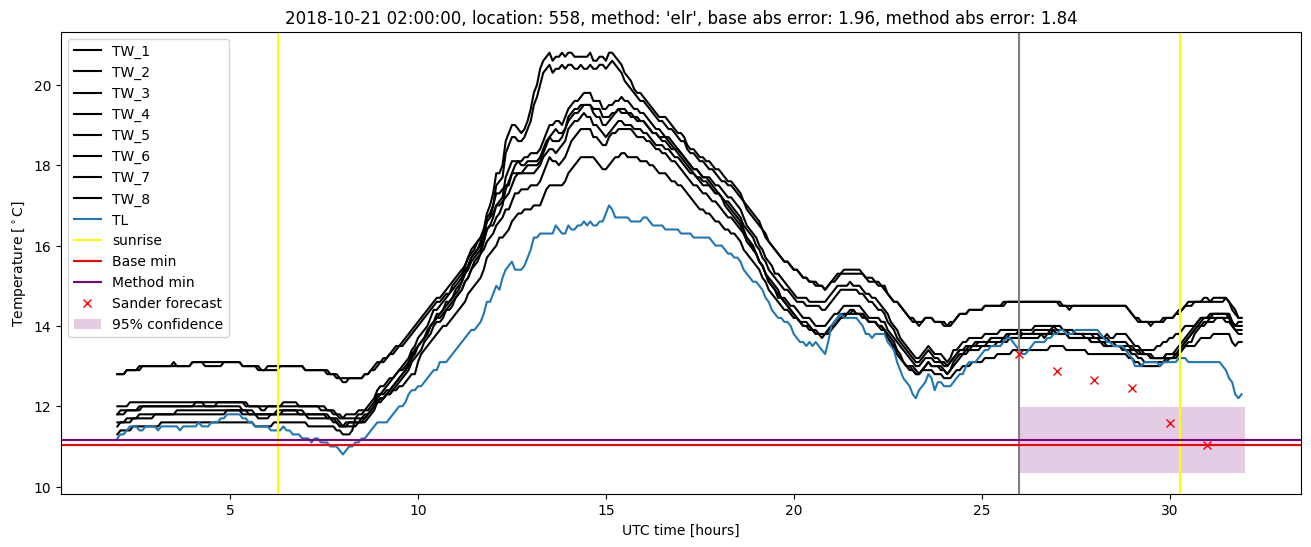
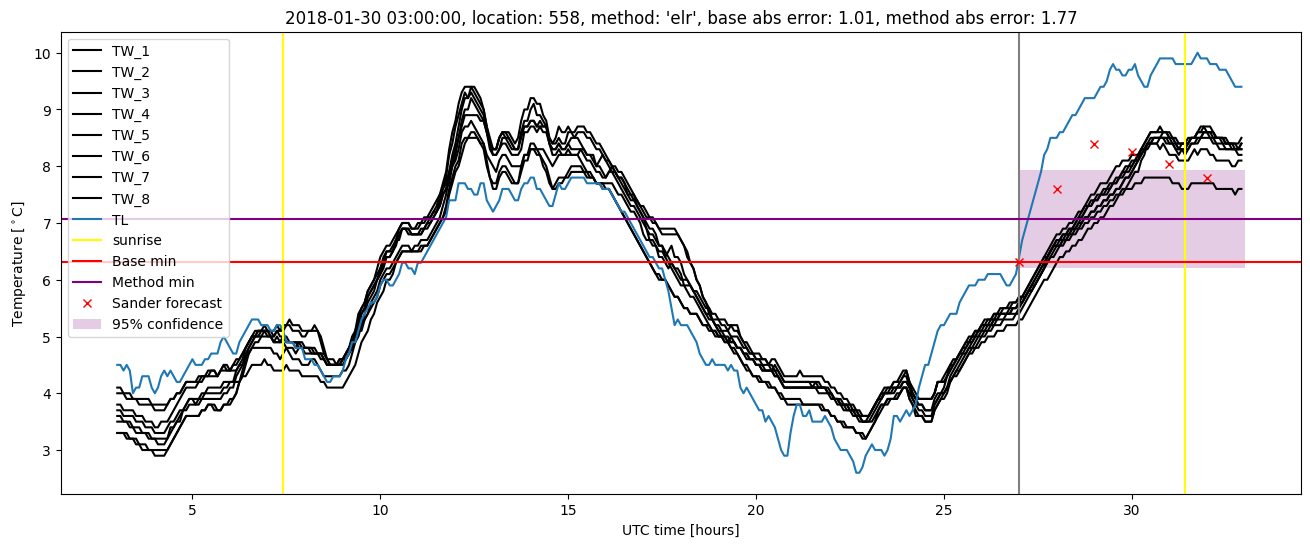
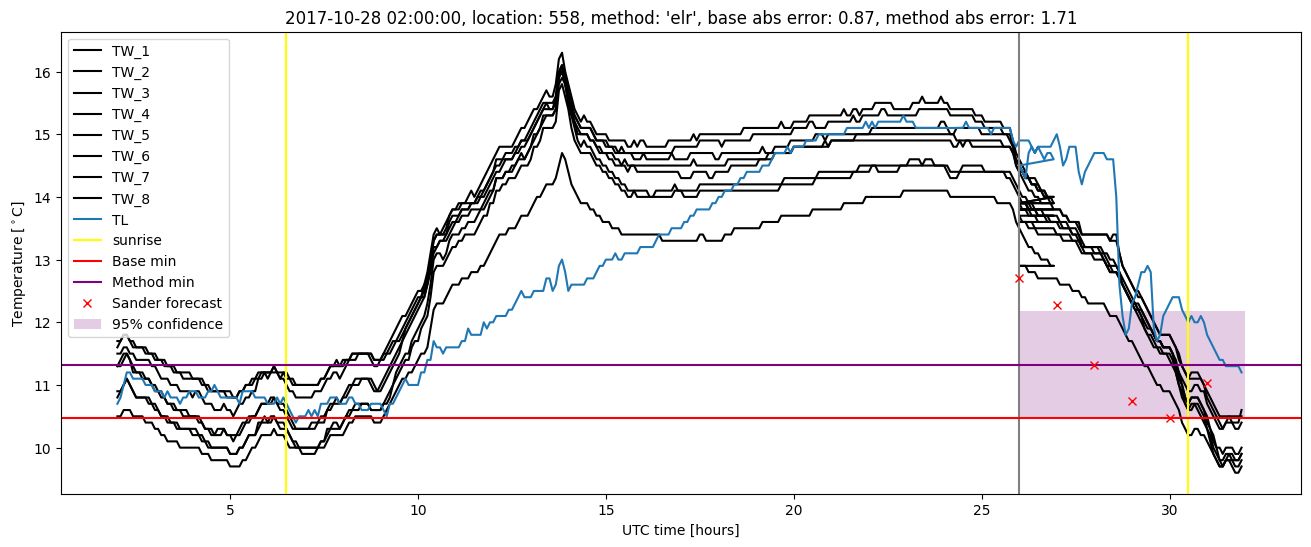
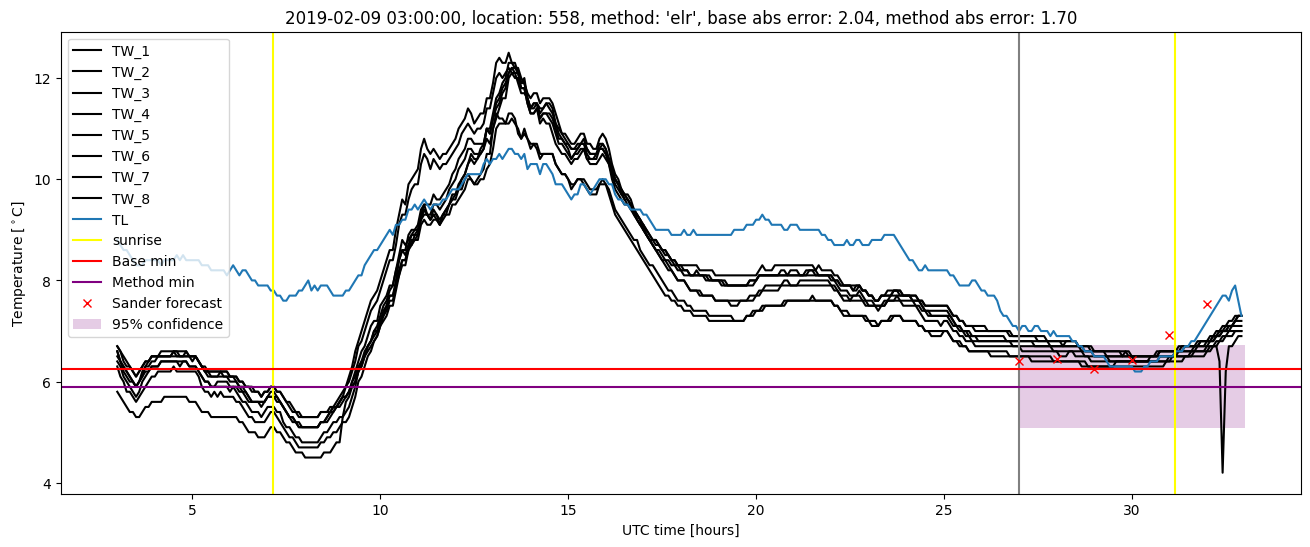
Extended logistic regression plots