GMS location: 556
Random forest results
| names |
period |
power |
significance |
meanSquareError |
absError |
maxError |
CRPS |
IGN |
| baseline |
winter 2016 |
1.000 |
0.000e+00 |
0.333 |
0.445 |
1.602 |
NaN |
NaN |
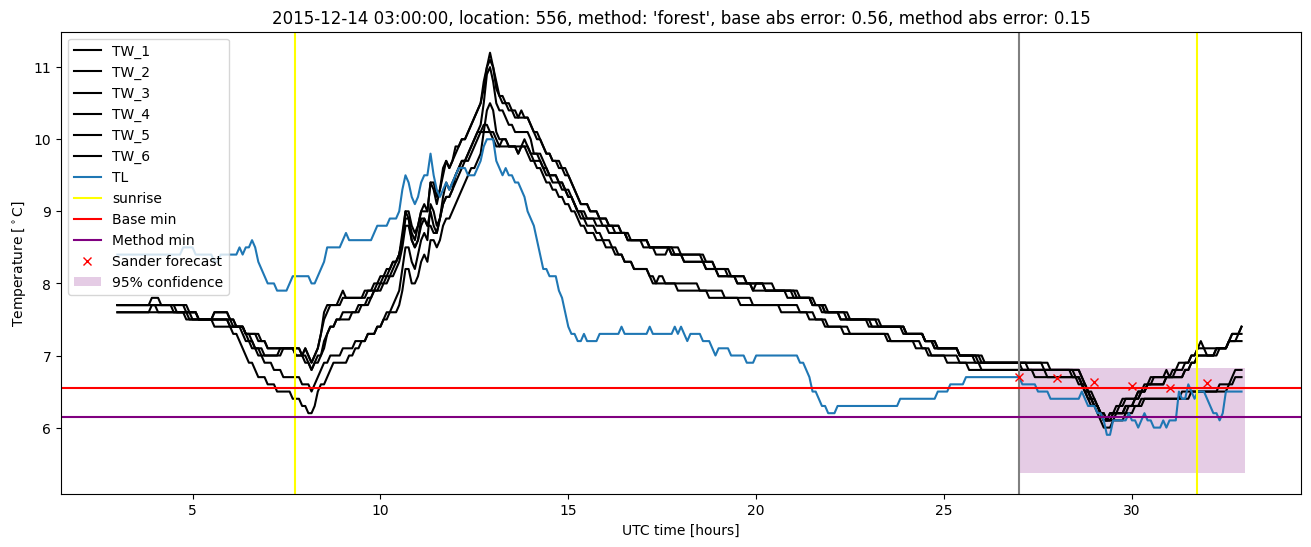
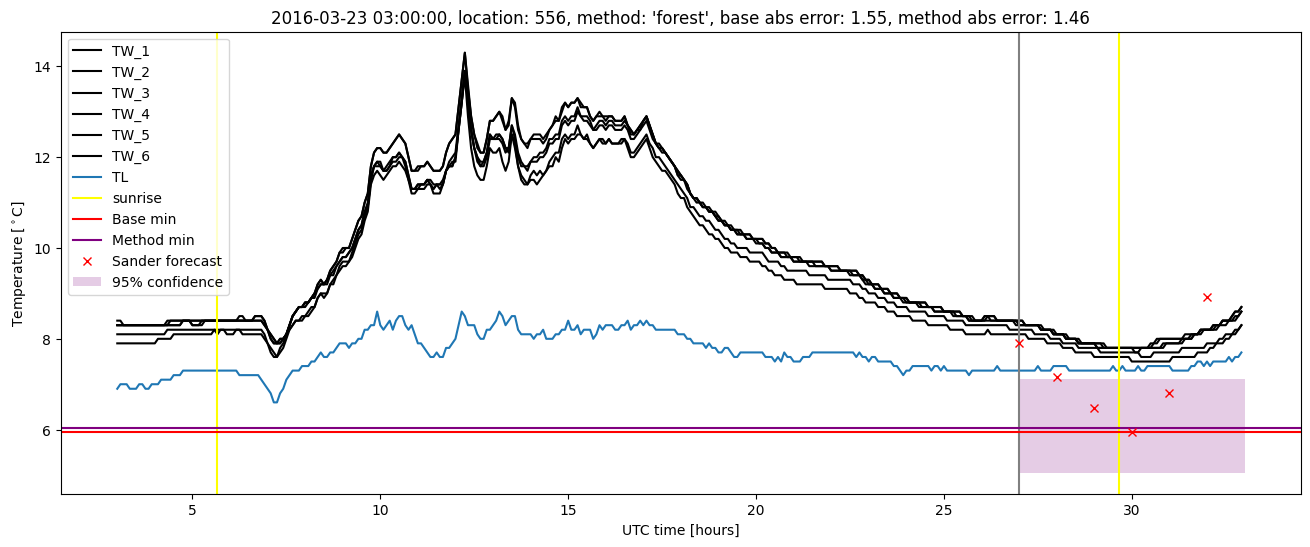
| forest |
winter 2016 |
1.000 |
0.000e+00 |
0.294 |
0.412 |
1.459 |
0.521 |
3.741 |
| baseline |
winter 2017 |
0.976 |
0.035 |
0.370 |
0.452 |
1.933 |
NaN |
NaN |
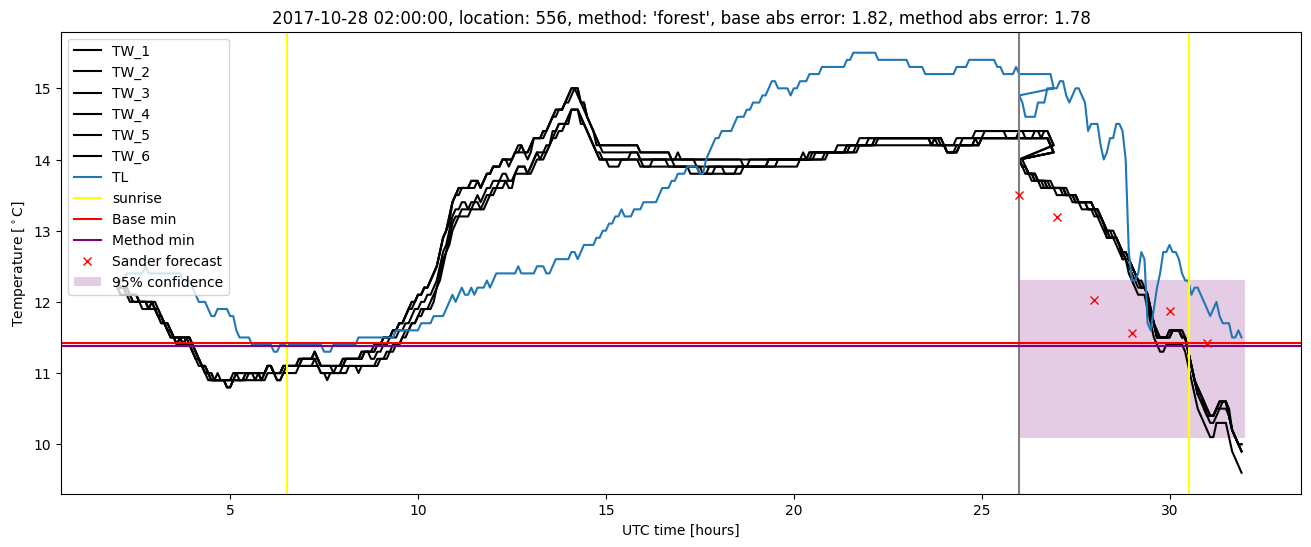
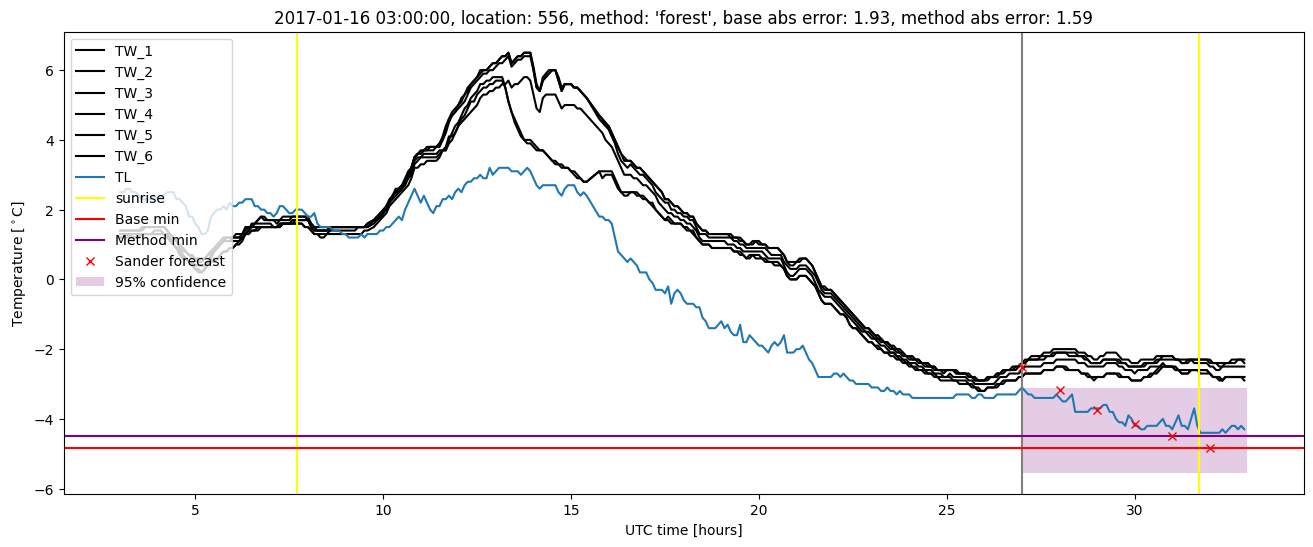
| forest |
winter 2017 |
0.984 |
0.035 |
0.300 |
0.405 |
1.589 |
0.503 |
3.620 |
| baseline |
winter 2018 |
0.981 |
0.115 |
0.323 |
0.417 |
2.202 |
NaN |
NaN |
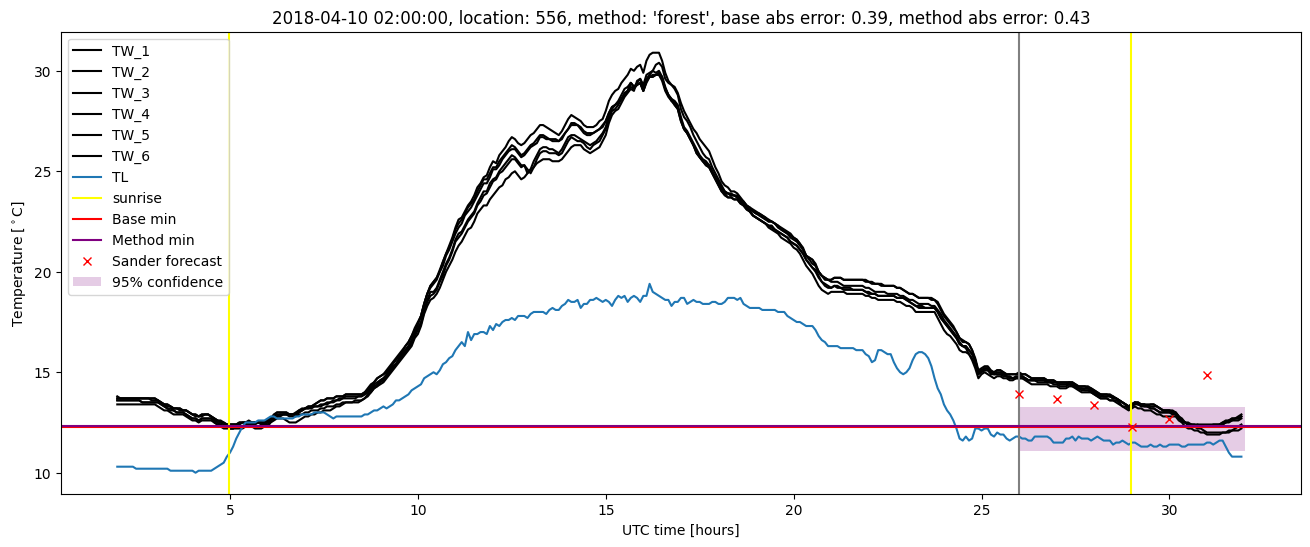
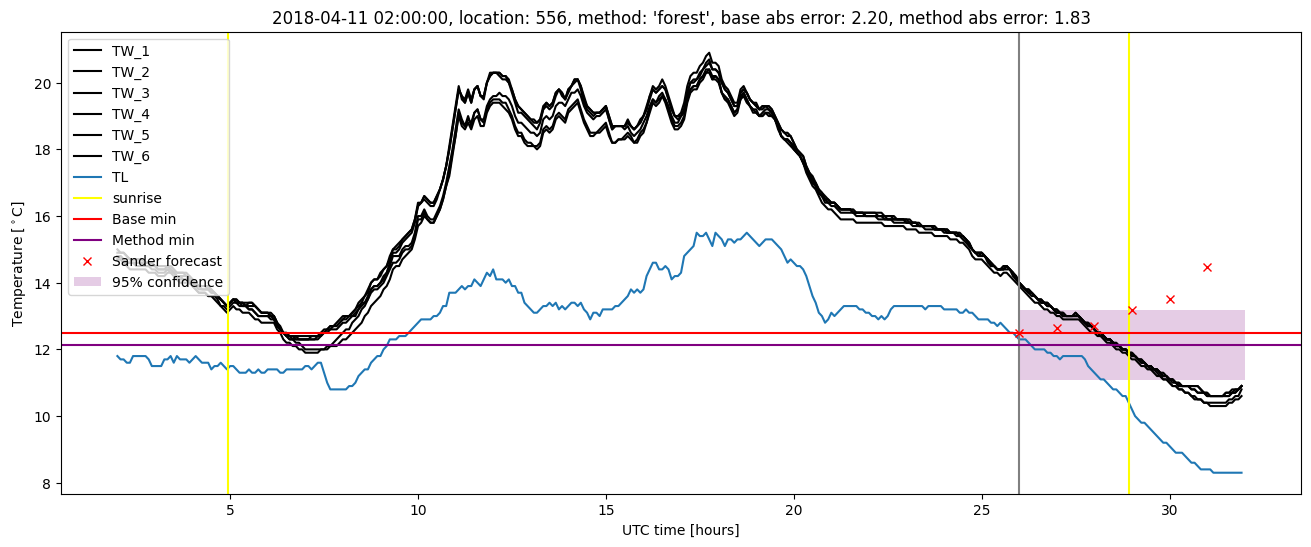
| forest |
winter 2018 |
0.987 |
0.115 |
0.265 |
0.372 |
1.833 |
0.494 |
3.169 |
| baseline |
winter 2019 |
0.992 |
0.000e+00 |
0.314 |
0.414 |
1.880 |
NaN |
NaN |
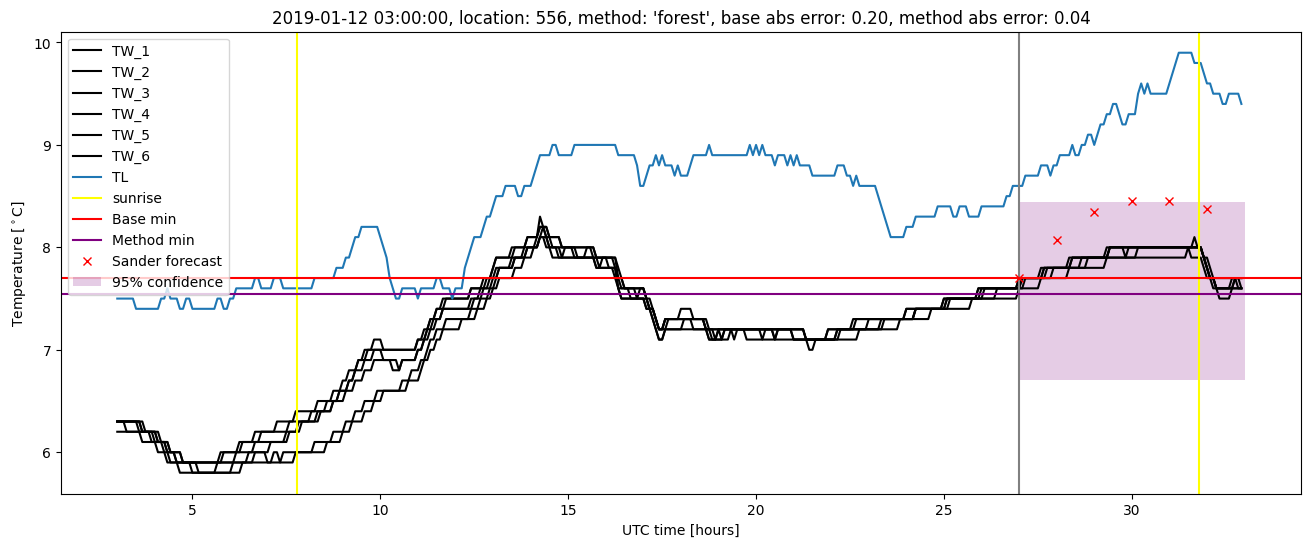
| forest |
winter 2019 |
0.992 |
0.000e+00 |
0.252 |
0.371 |
1.373 |
0.515 |
3.311 |
| baseline |
all |
0.988 |
0.050 |
0.335 |
0.433 |
2.202 |
NaN |
NaN |
| forest |
all |
0.992 |
0.050 |
0.279 |
0.392 |
1.833 |
0.509 |
3.474 |
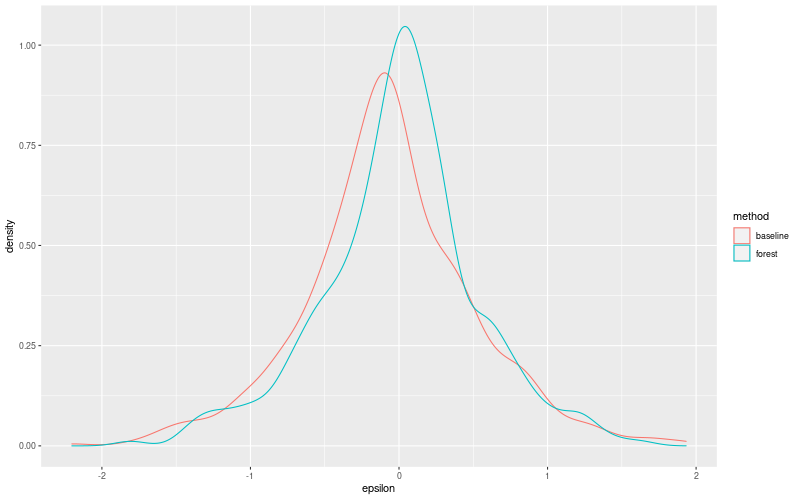
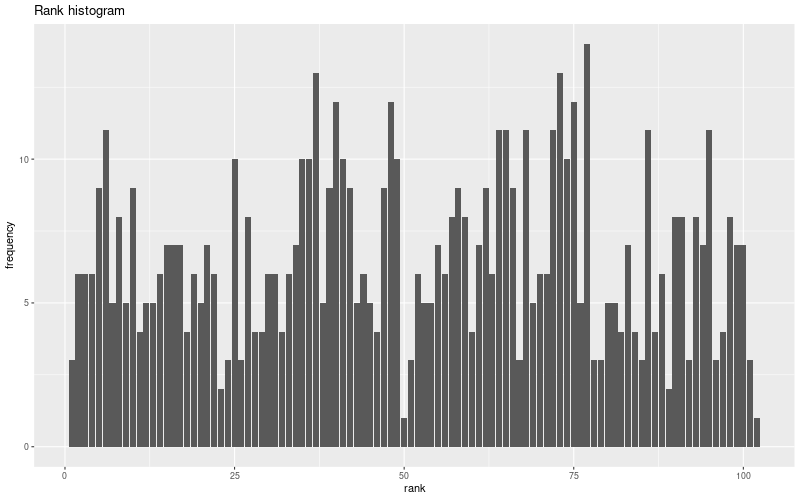
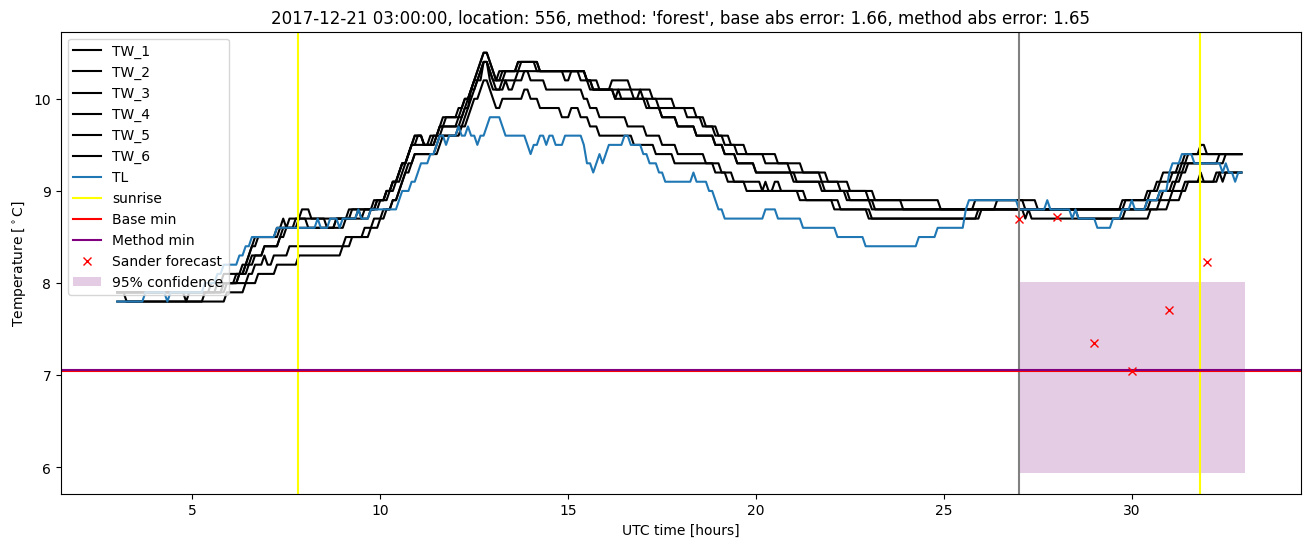
Random forest plots
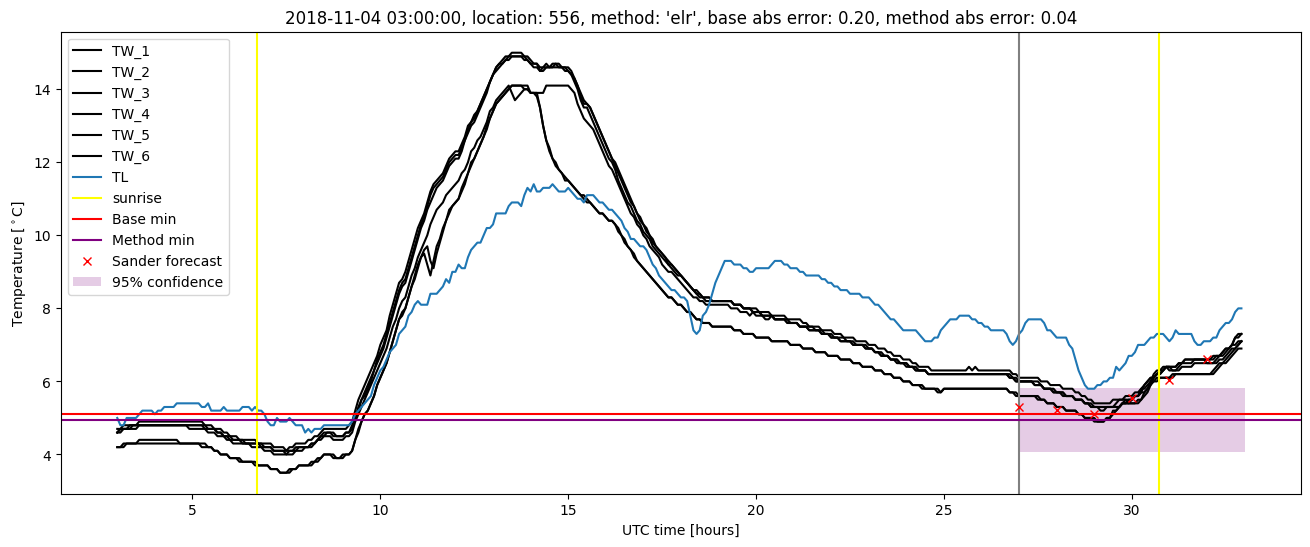
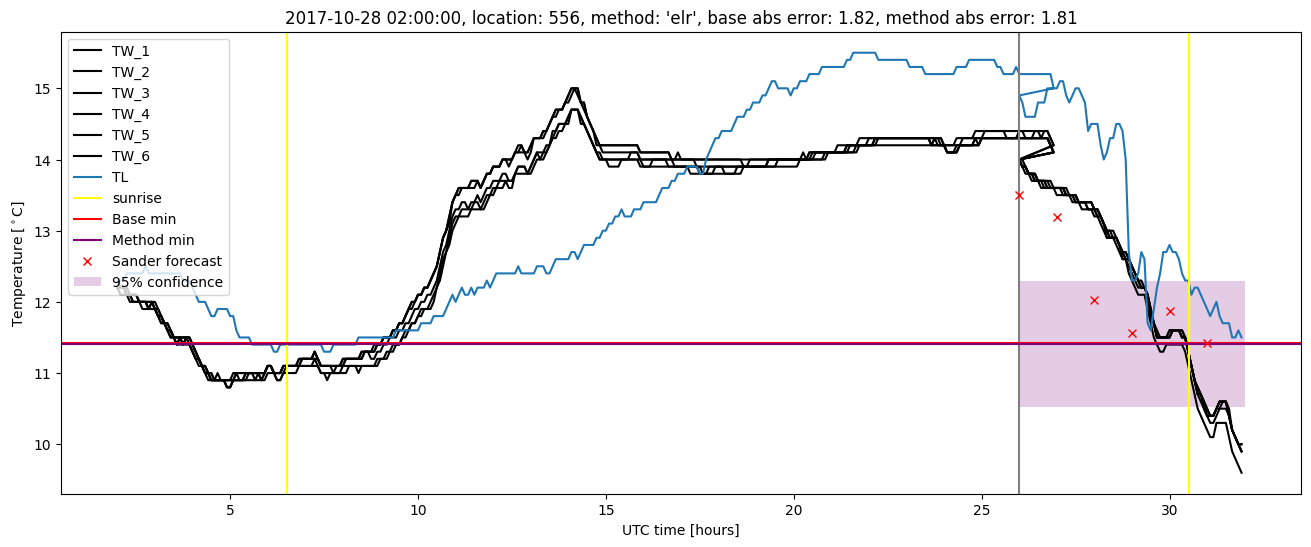
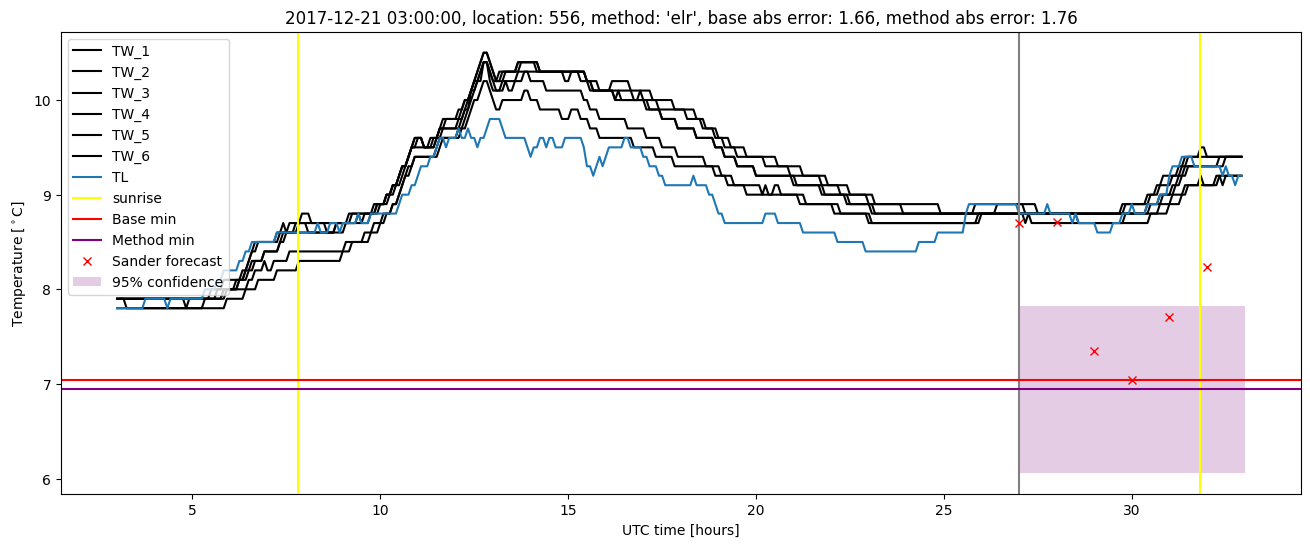
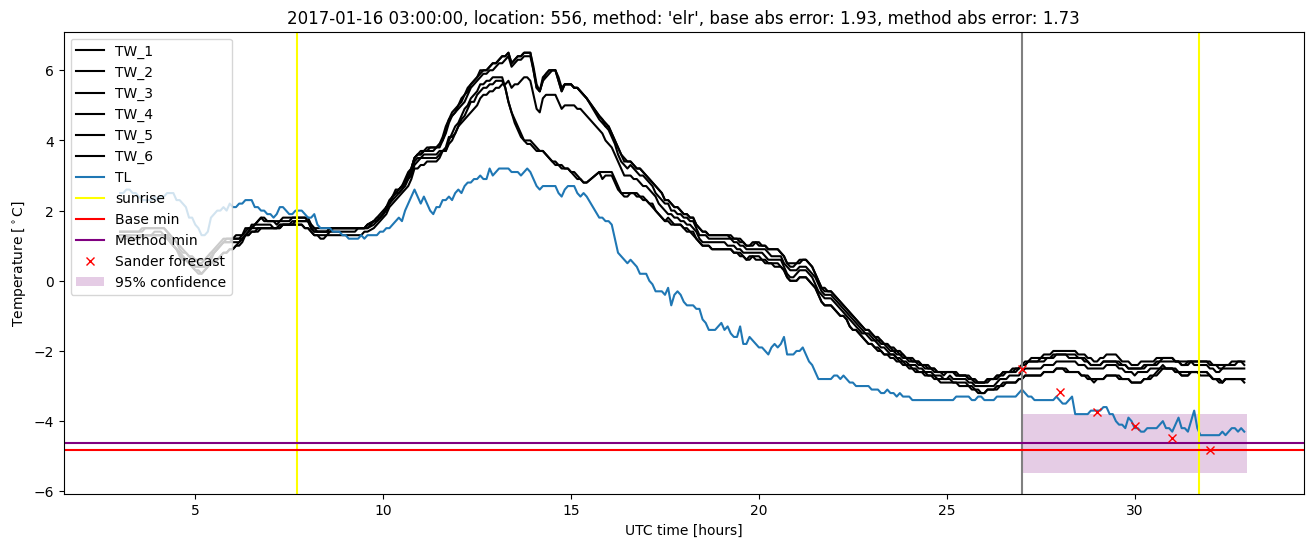
Extended logistic regression results
| names |
period |
power |
significance |
meanSquareError |
absError |
maxError |
CRPS |
IGN |
| baseline |
winter 2016 |
1.000 |
0.000e+00 |
0.333 |
0.445 |
1.602 |
NaN |
NaN |
| elr |
winter 2016 |
1.000 |
0.000e+00 |
0.294 |
0.432 |
1.405 |
0.600 |
5.614 |
| baseline |
winter 2017 |
0.976 |
0.035 |
0.370 |
0.452 |
1.933 |
NaN |
NaN |
| elr |
winter 2017 |
0.976 |
0.035 |
0.356 |
0.475 |
1.730 |
0.574 |
5.626 |
| baseline |
winter 2018 |
0.981 |
0.115 |
0.323 |
0.417 |
2.202 |
NaN |
NaN |
| elr |
winter 2018 |
0.987 |
0.115 |
0.295 |
0.414 |
1.809 |
0.571 |
4.752 |
| baseline |
winter 2019 |
0.992 |
0.000e+00 |
0.314 |
0.414 |
1.880 |
NaN |
NaN |
| elr |
winter 2019 |
0.992 |
0.000e+00 |
0.277 |
0.393 |
1.509 |
0.540 |
4.343 |
| baseline |
all |
0.988 |
0.050 |
0.335 |
0.433 |
2.202 |
NaN |
NaN |
| elr |
all |
0.990 |
0.050 |
0.305 |
0.429 |
1.809 |
0.574 |
5.129 |
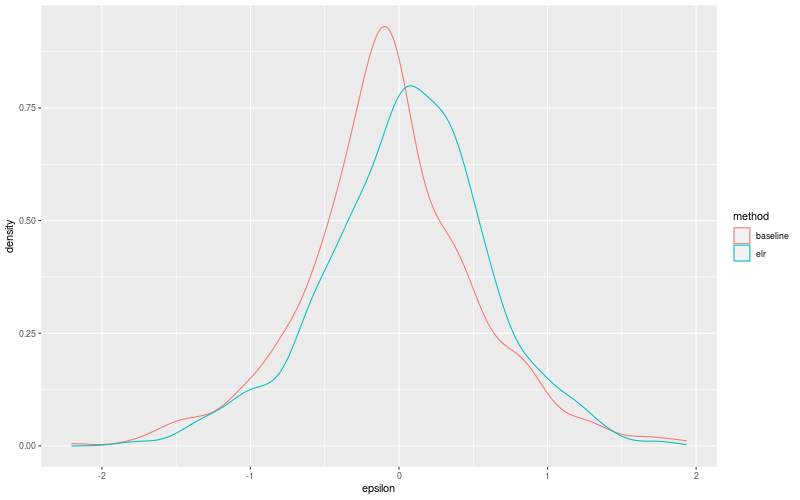
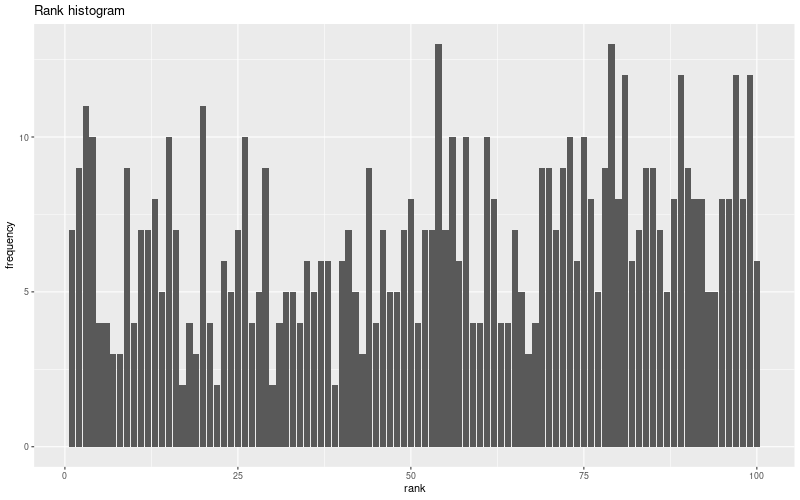
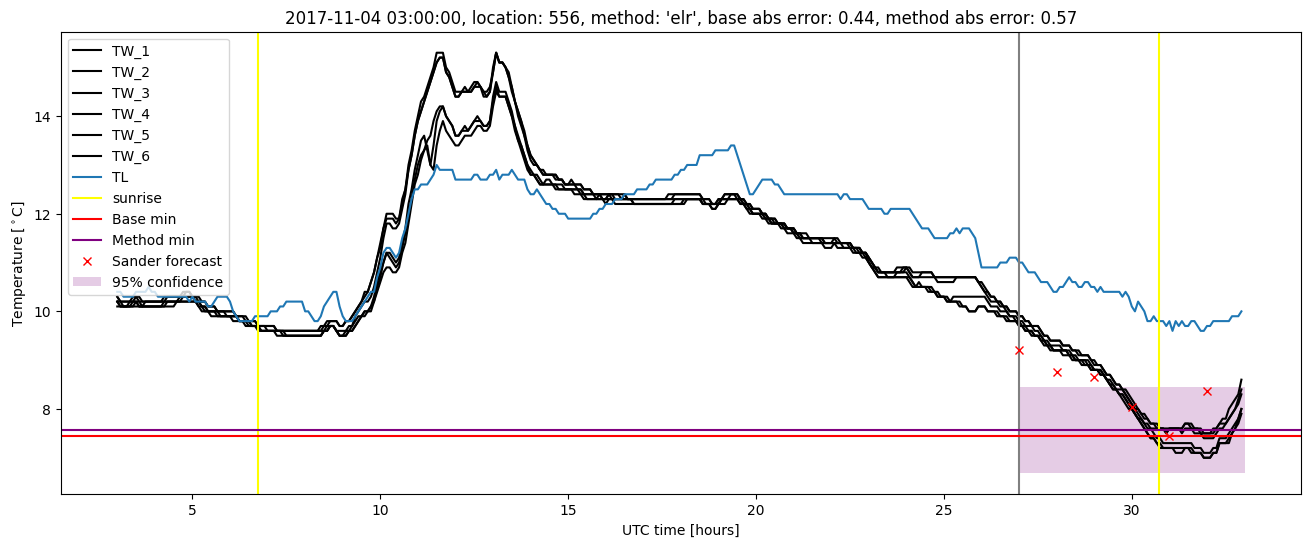
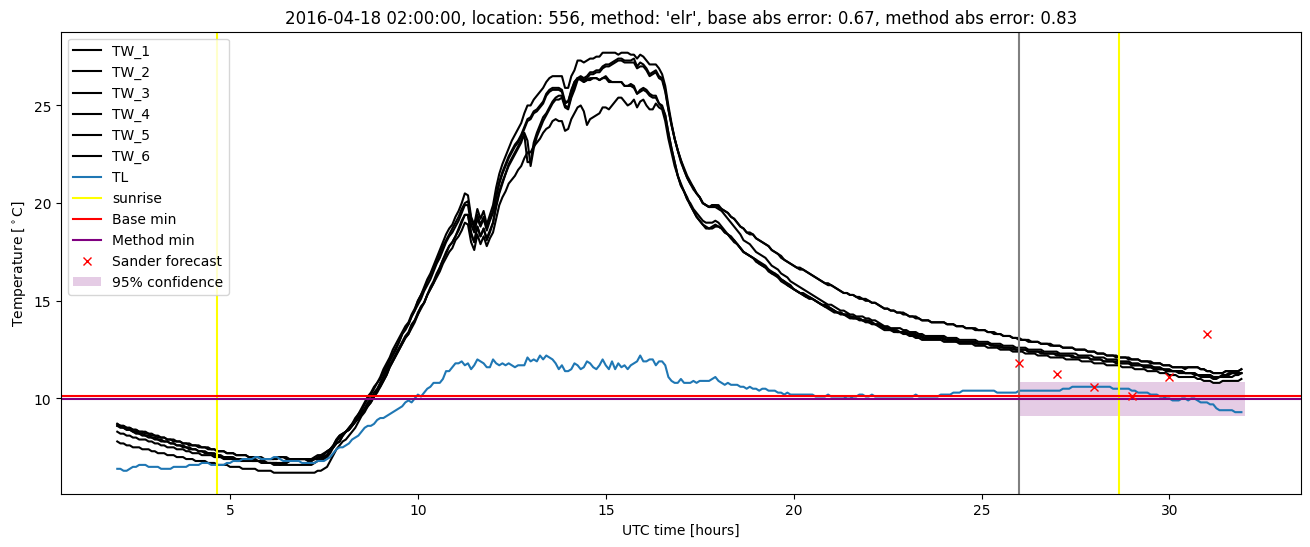
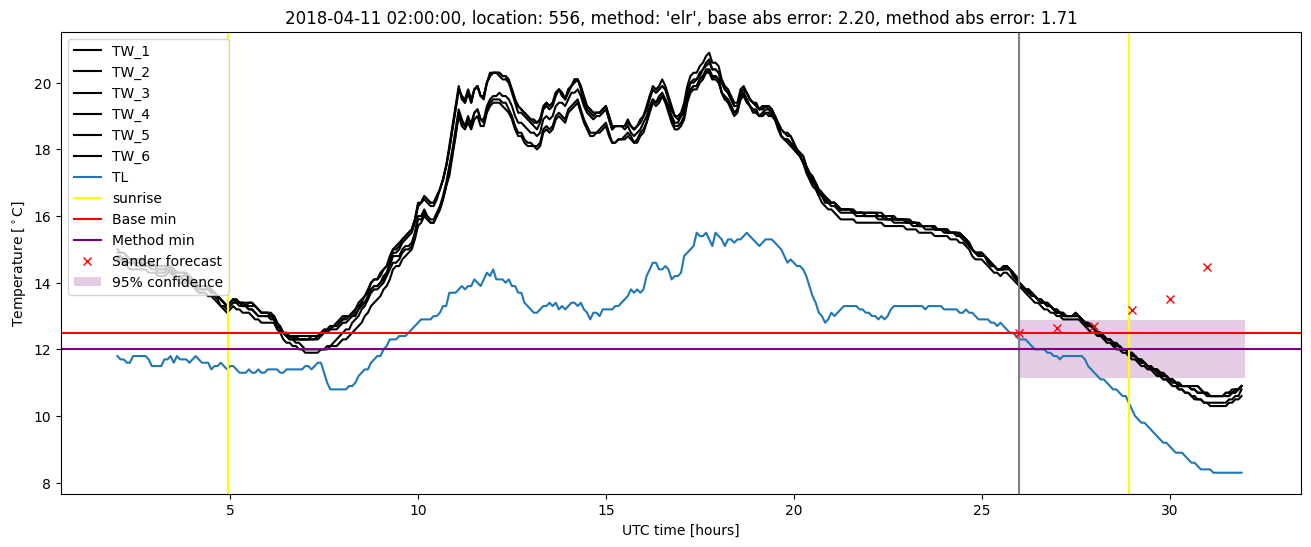
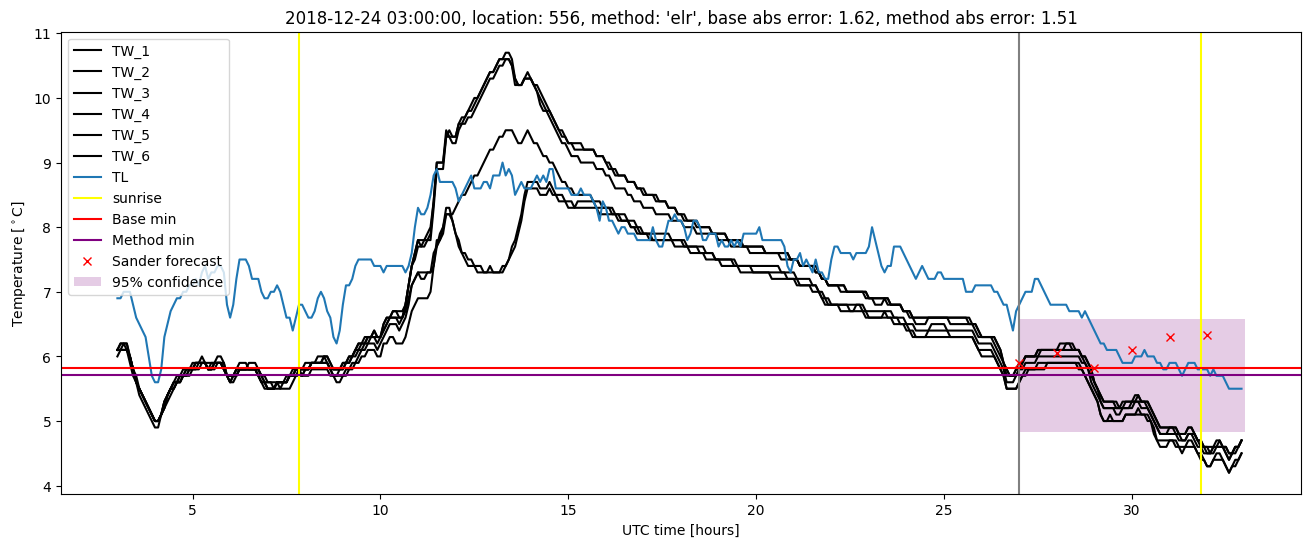
Extended logistic regression plots