GMS location: 555
Random forest results
| names |
period |
power |
significance |
meanSquareError |
absError |
maxError |
CRPS |
IGN |
| baseline |
winter 2016 |
0.989 |
0.000e+00 |
0.366 |
0.472 |
1.644 |
NaN |
NaN |
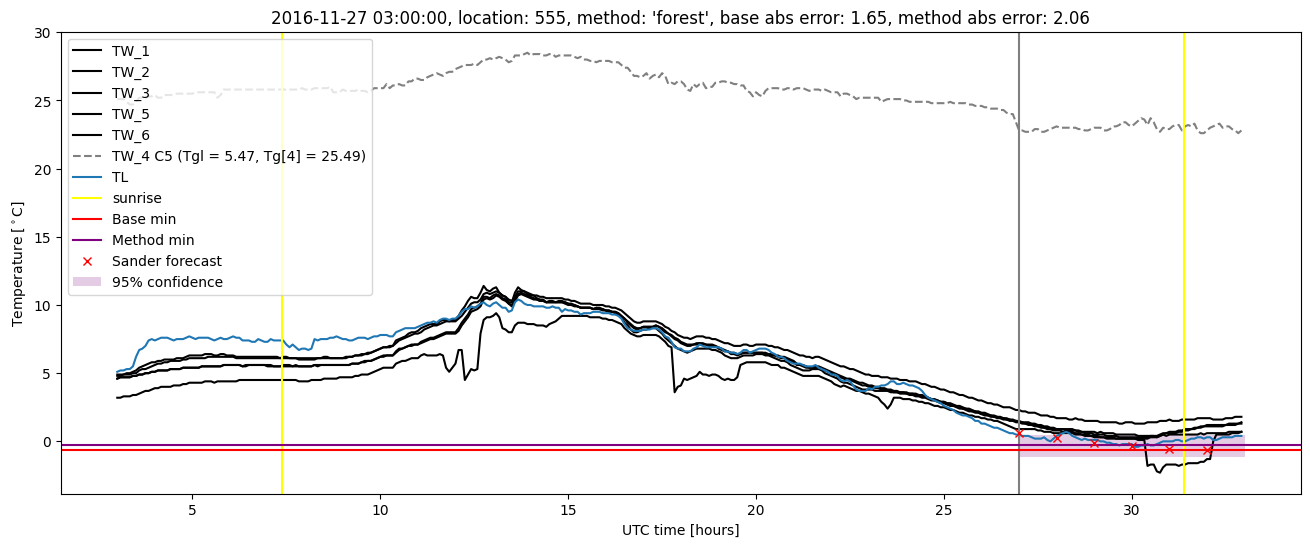
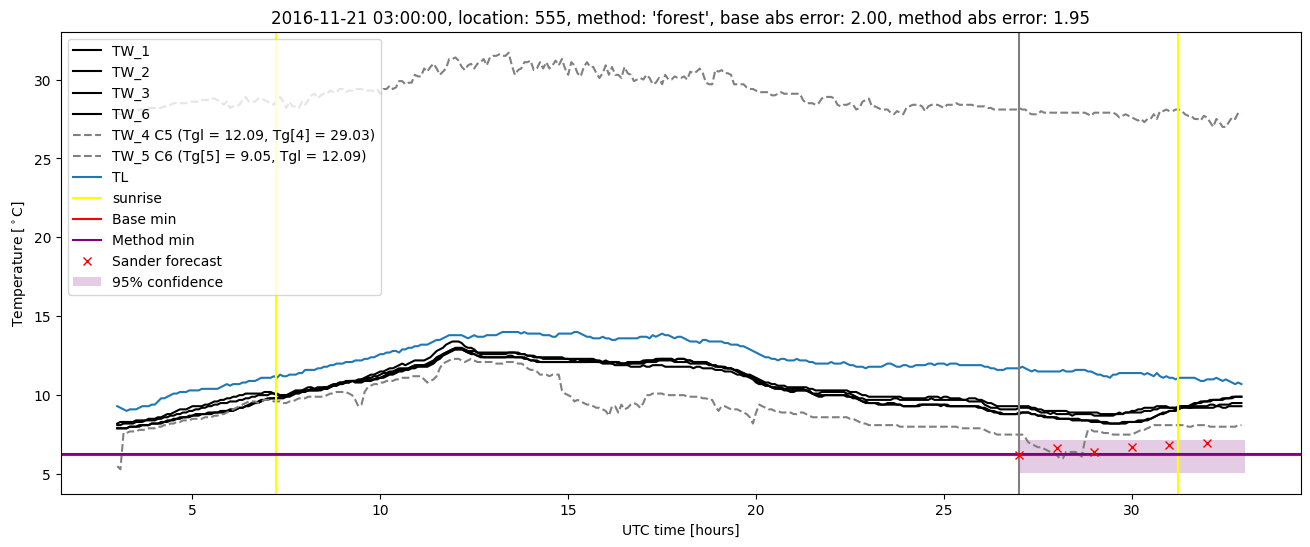
| forest |
winter 2016 |
0.989 |
0.000e+00 |
0.300 |
0.423 |
1.728 |
0.471 |
2.611 |
| baseline |
winter 2017 |
0.968 |
0.077 |
0.526 |
0.522 |
2.599 |
NaN |
NaN |
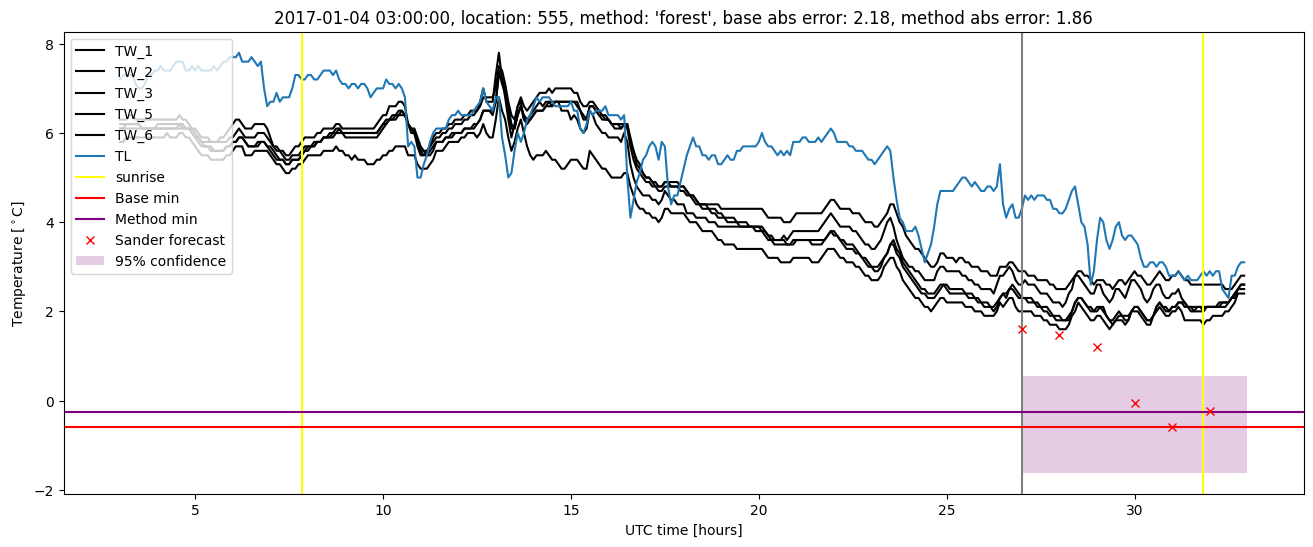
| forest |
winter 2017 |
0.976 |
0.077 |
0.429 |
0.459 |
2.469 |
0.484 |
2.844 |
| baseline |
winter 2018 |
0.986 |
0.056 |
0.338 |
0.442 |
1.599 |
NaN |
NaN |
| forest |
winter 2018 |
0.986 |
0.167 |
0.286 |
0.398 |
1.747 |
0.480 |
2.384 |
| baseline |
winter 2019 |
0.993 |
0.000e+00 |
0.293 |
0.377 |
2.525 |
NaN |
NaN |
| forest |
winter 2019 |
0.986 |
0.000e+00 |
0.255 |
0.368 |
2.154 |
0.467 |
2.255 |
| baseline |
all |
0.985 |
0.044 |
0.380 |
0.455 |
2.599 |
NaN |
NaN |
| forest |
all |
0.985 |
0.073 |
0.316 |
0.413 |
2.469 |
0.475 |
2.530 |
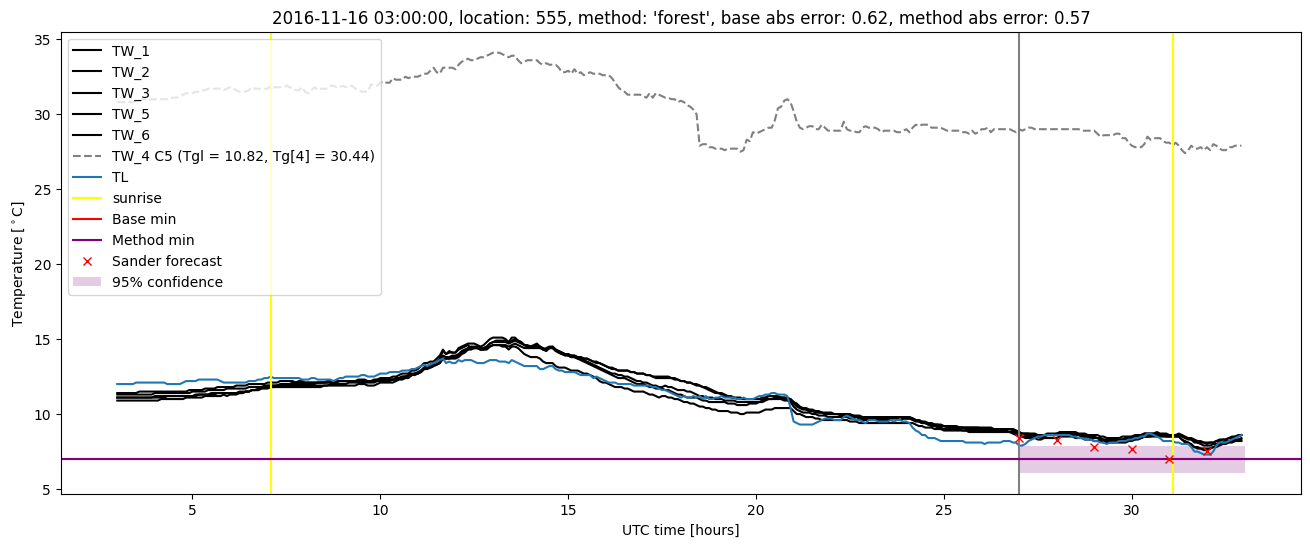
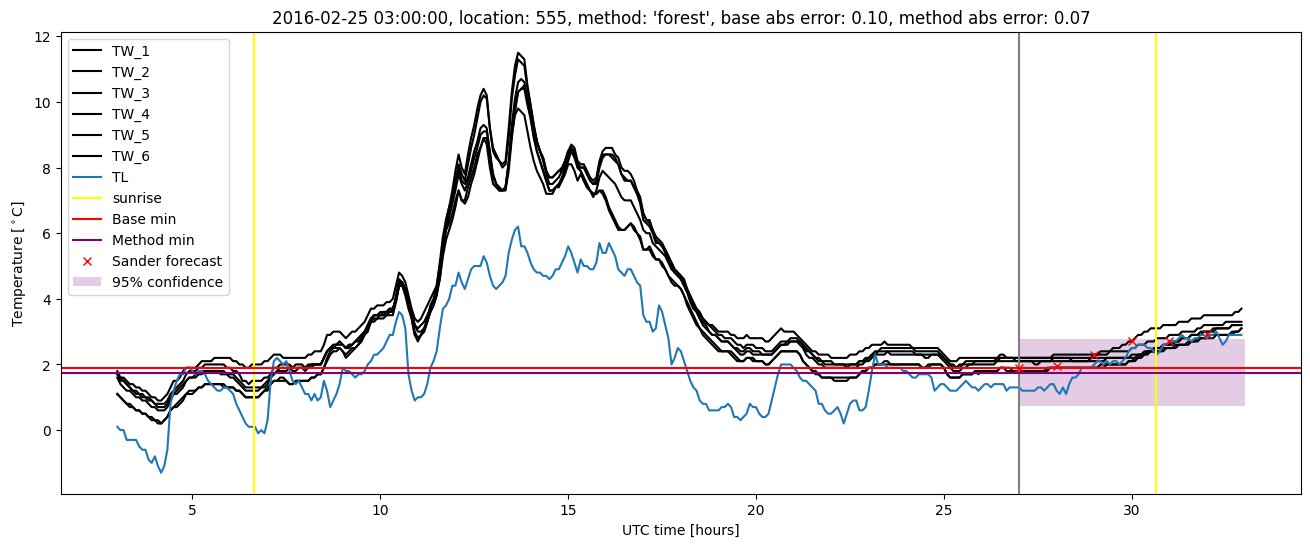
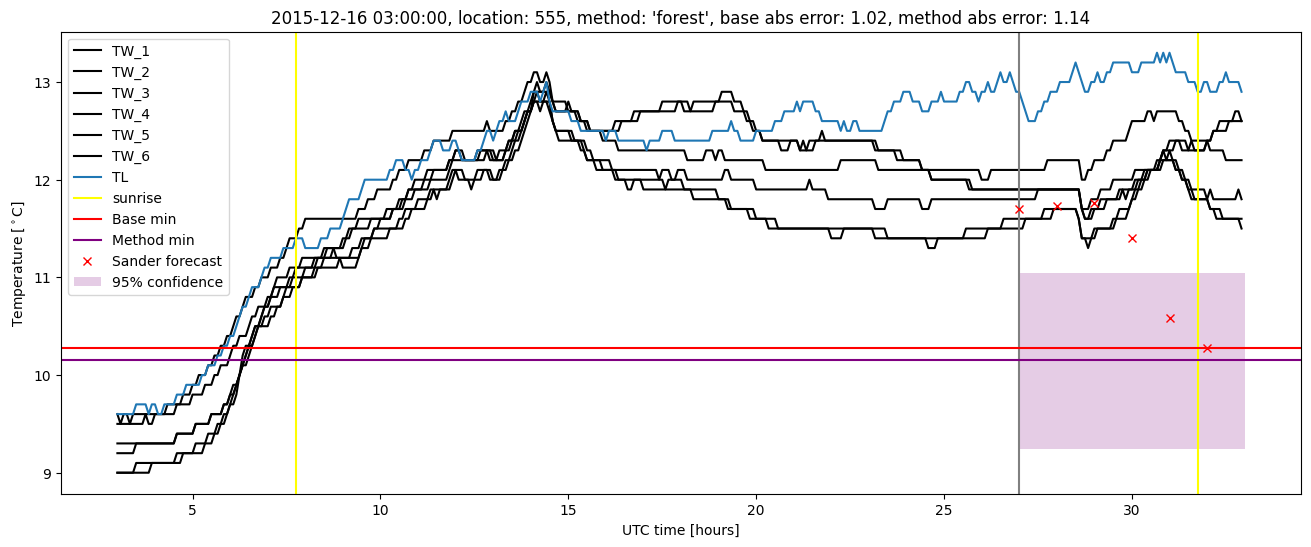
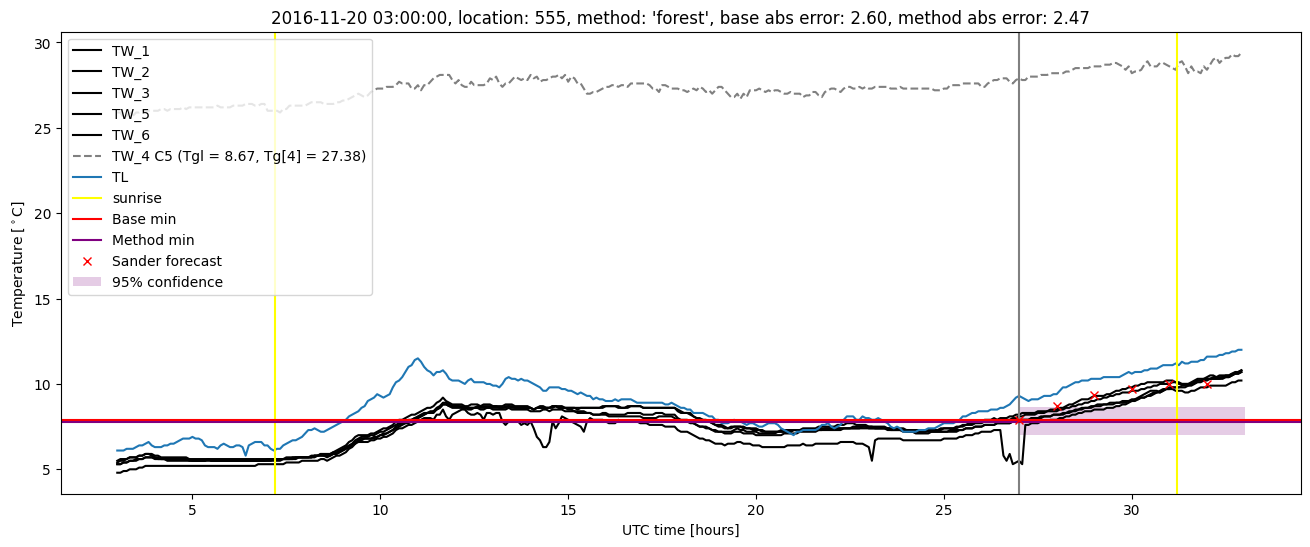
Random forest plots

Extended logistic regression results
| names |
period |
power |
significance |
meanSquareError |
absError |
maxError |
CRPS |
IGN |
| baseline |
winter 2016 |
0.989 |
0.000e+00 |
0.366 |
0.472 |
1.644 |
NaN |
NaN |
| elr |
winter 2016 |
0.995 |
0.000e+00 |
0.345 |
0.458 |
1.983 |
0.540 |
4.026 |
| baseline |
winter 2017 |
0.968 |
0.077 |
0.526 |
0.522 |
2.599 |
NaN |
NaN |
| elr |
winter 2017 |
0.968 |
0.115 |
0.491 |
0.515 |
2.152 |
0.515 |
4.085 |
| baseline |
winter 2018 |
0.986 |
0.056 |
0.338 |
0.442 |
1.599 |
NaN |
NaN |
| elr |
winter 2018 |
0.978 |
0.167 |
0.299 |
0.410 |
2.003 |
0.517 |
3.331 |
| baseline |
winter 2019 |
0.993 |
0.000e+00 |
0.293 |
0.377 |
2.525 |
NaN |
NaN |
| elr |
winter 2019 |
0.986 |
0.111 |
0.307 |
0.408 |
2.289 |
0.508 |
3.074 |
| baseline |
all |
0.985 |
0.044 |
0.380 |
0.455 |
2.599 |
NaN |
NaN |
| elr |
all |
0.983 |
0.103 |
0.359 |
0.448 |
2.289 |
0.522 |
3.660 |
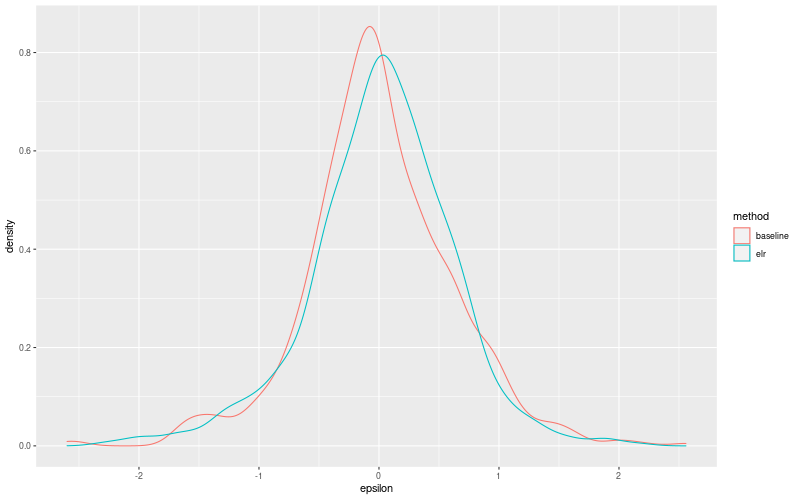
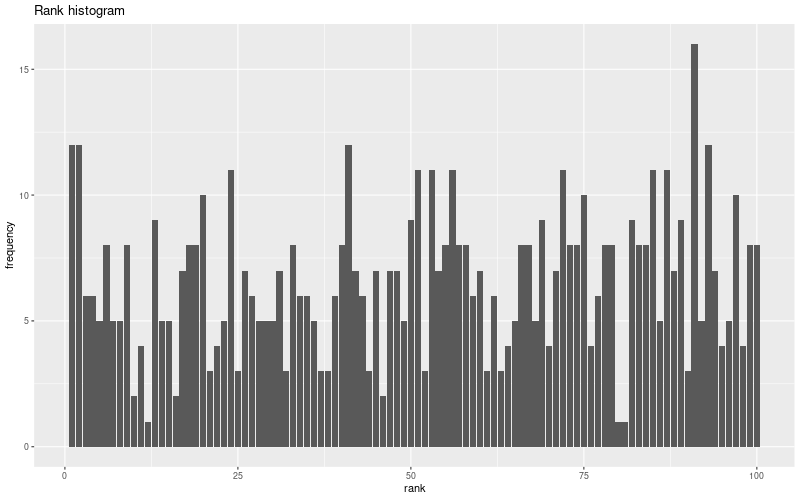
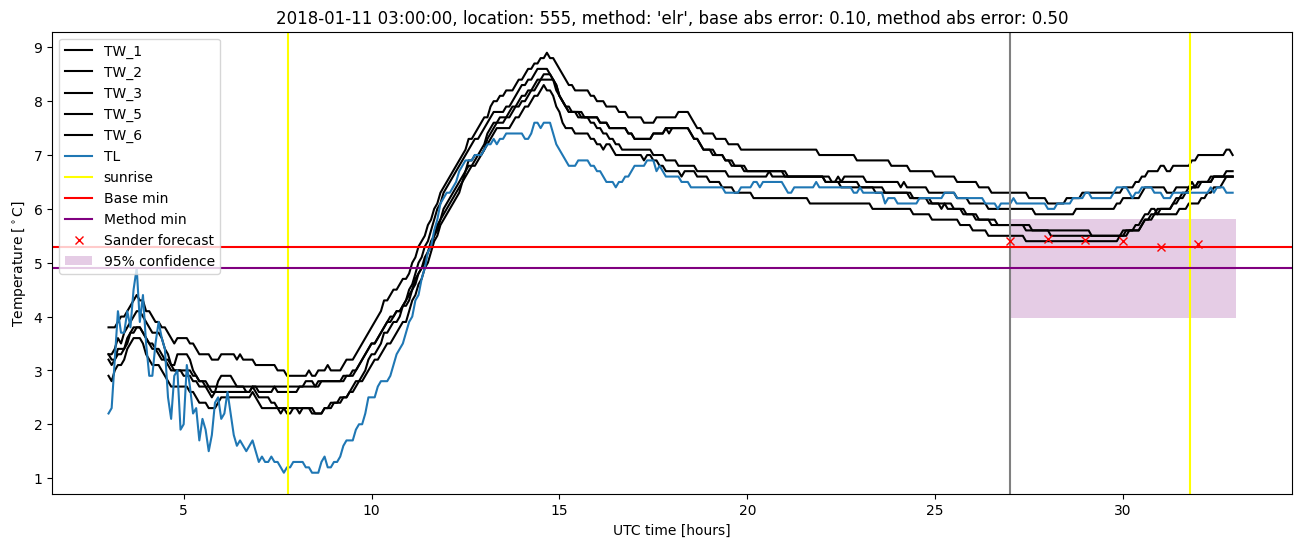
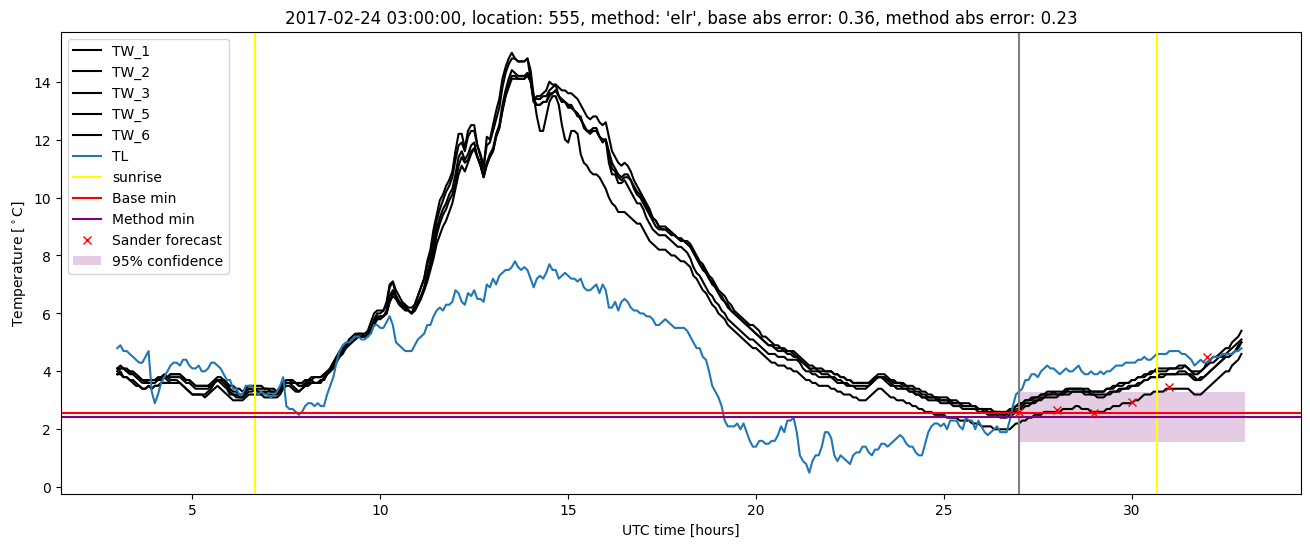
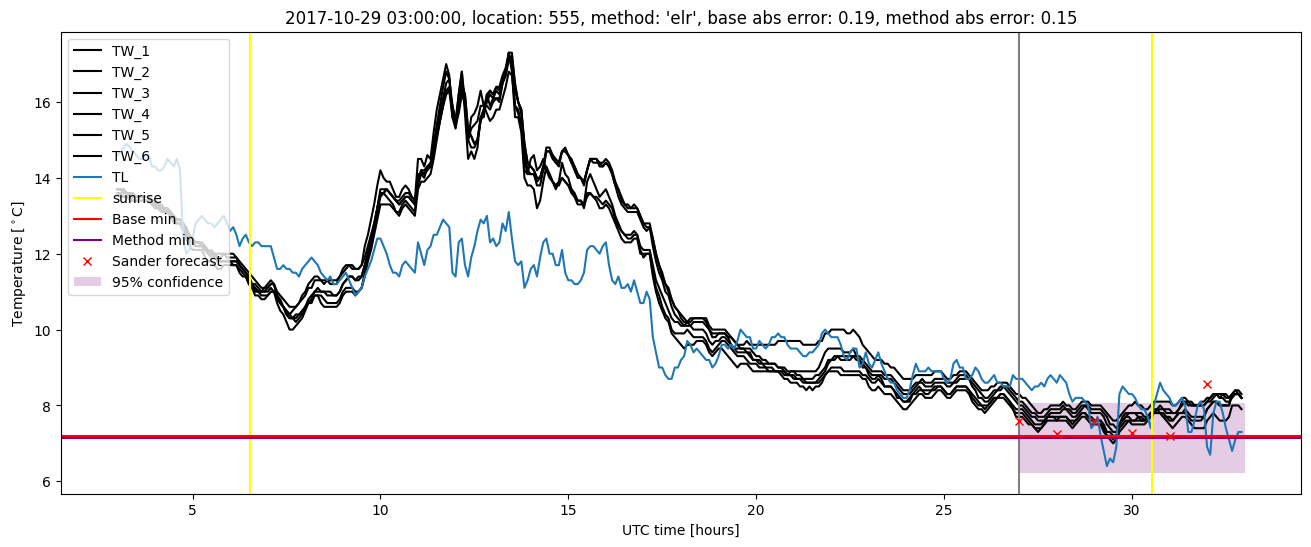
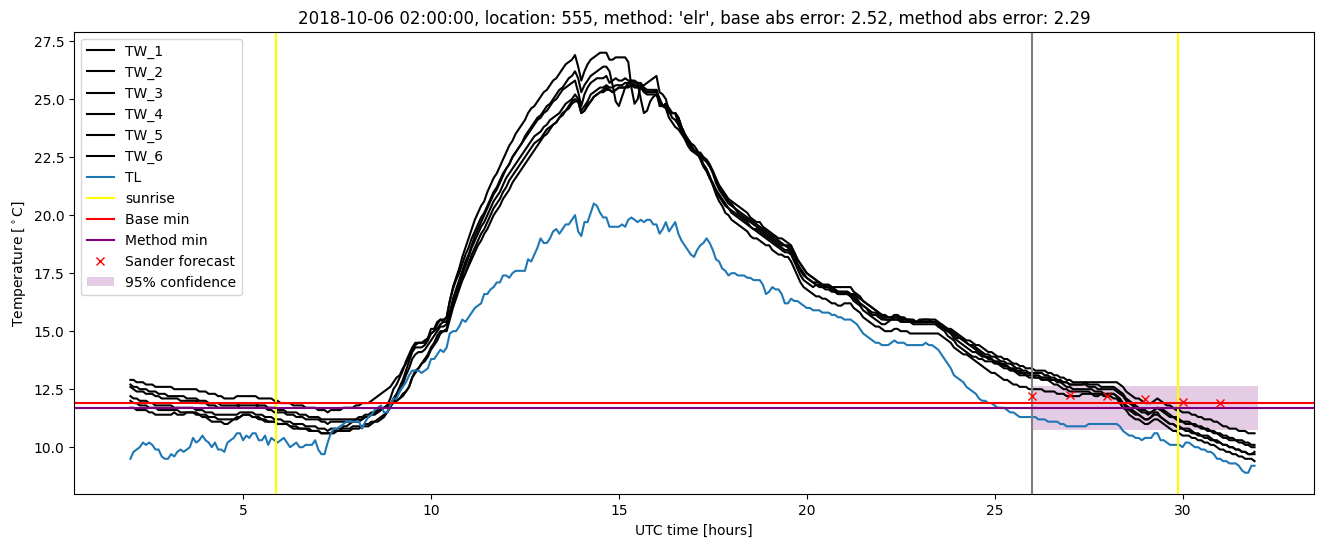
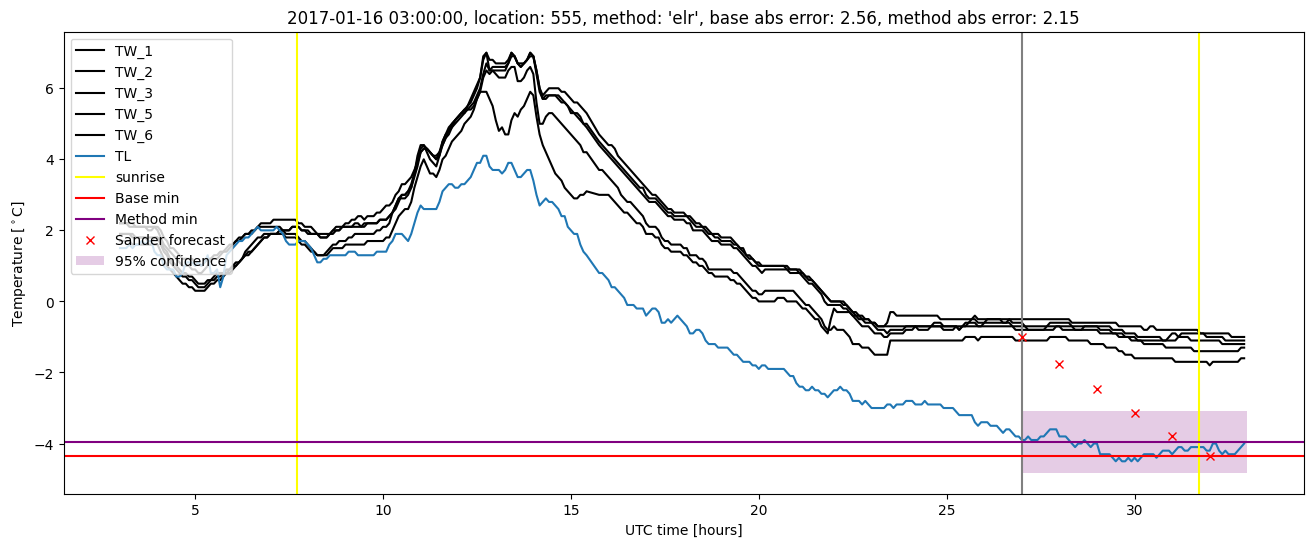
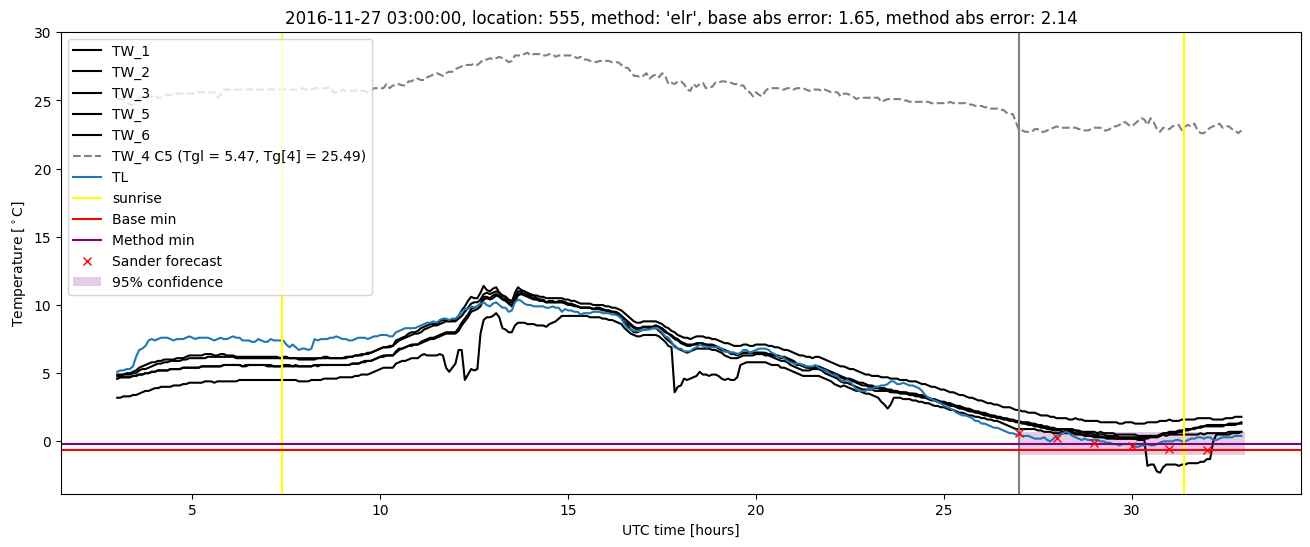
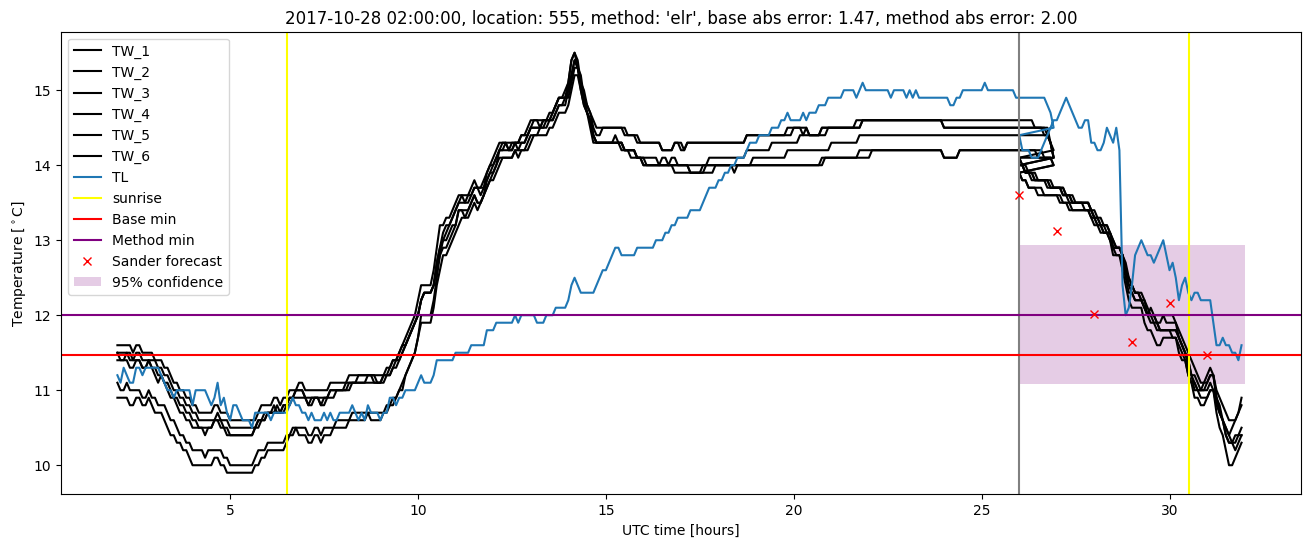
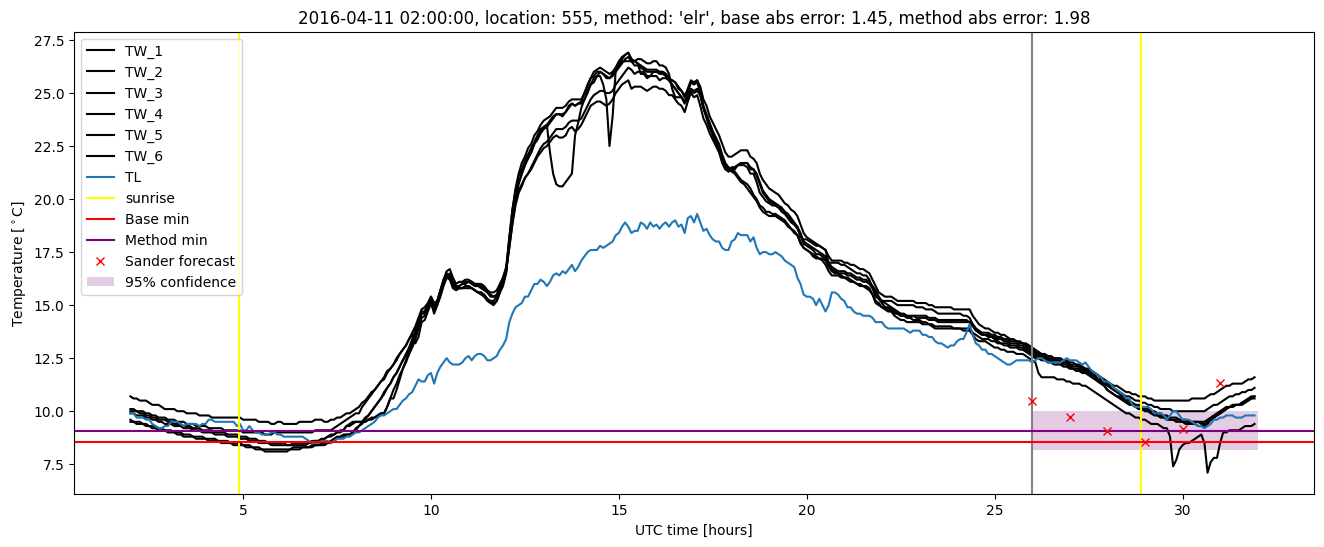
Extended logistic regression plots