GMS location: 554
Random forest results
| names |
period |
power |
significance |
meanSquareError |
absError |
maxError |
CRPS |
IGN |
| baseline |
winter 2016 |
0.989 |
0.000e+00 |
0.325 |
0.430 |
1.954 |
NaN |
NaN |
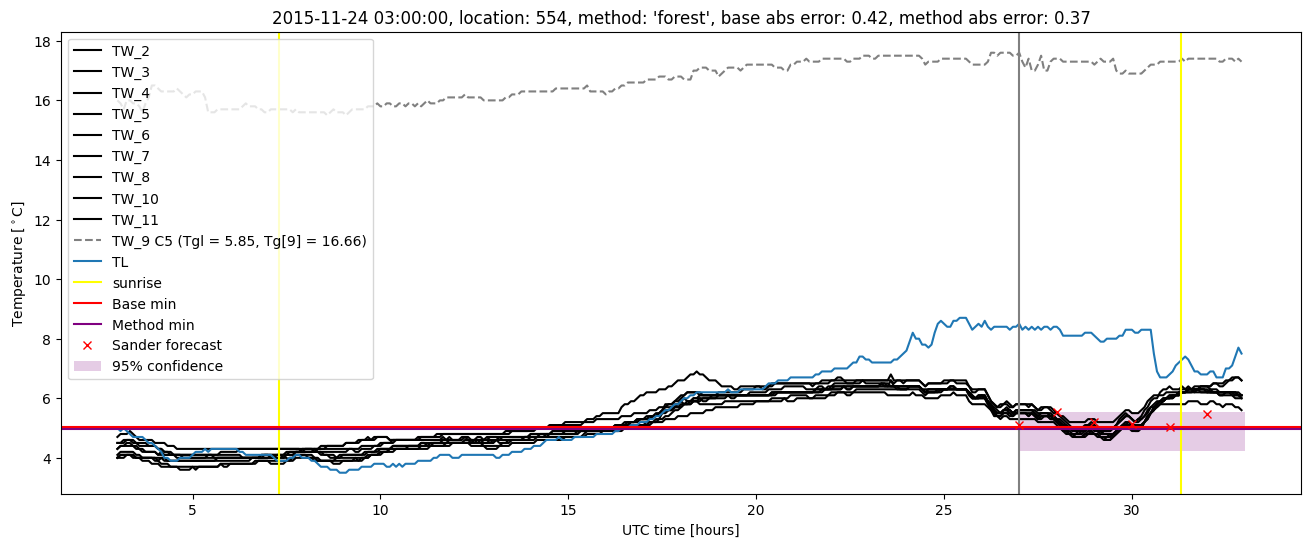
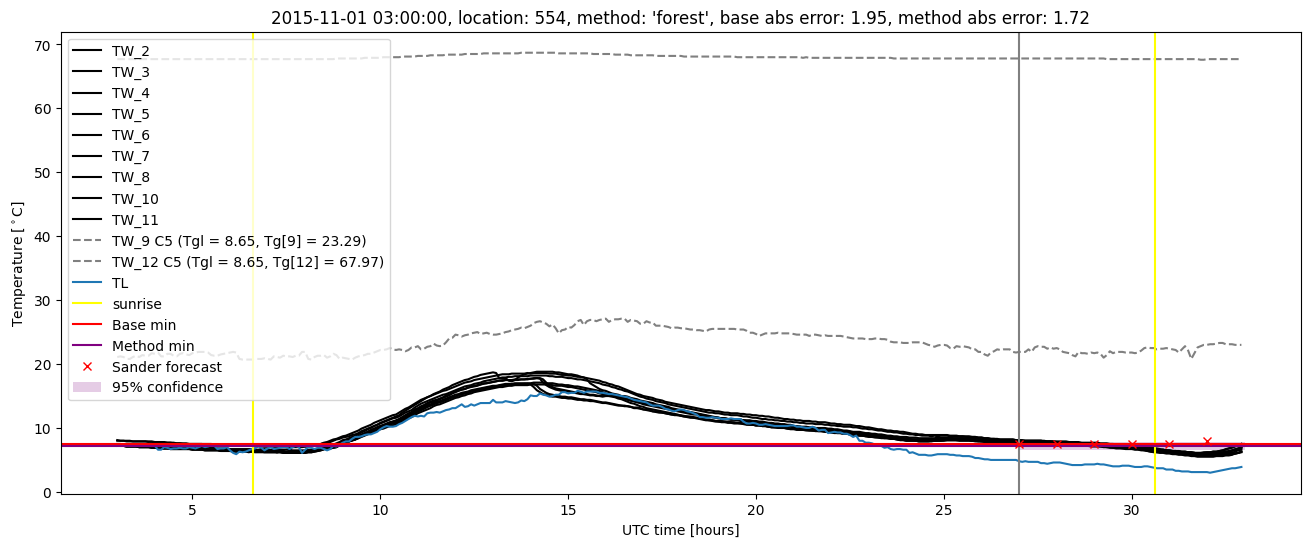
| forest |
winter 2016 |
0.989 |
0.000e+00 |
0.264 |
0.386 |
1.722 |
0.473 |
5.293 |
| baseline |
winter 2017 |
0.976 |
0.000e+00 |
0.325 |
0.421 |
2.085 |
NaN |
NaN |
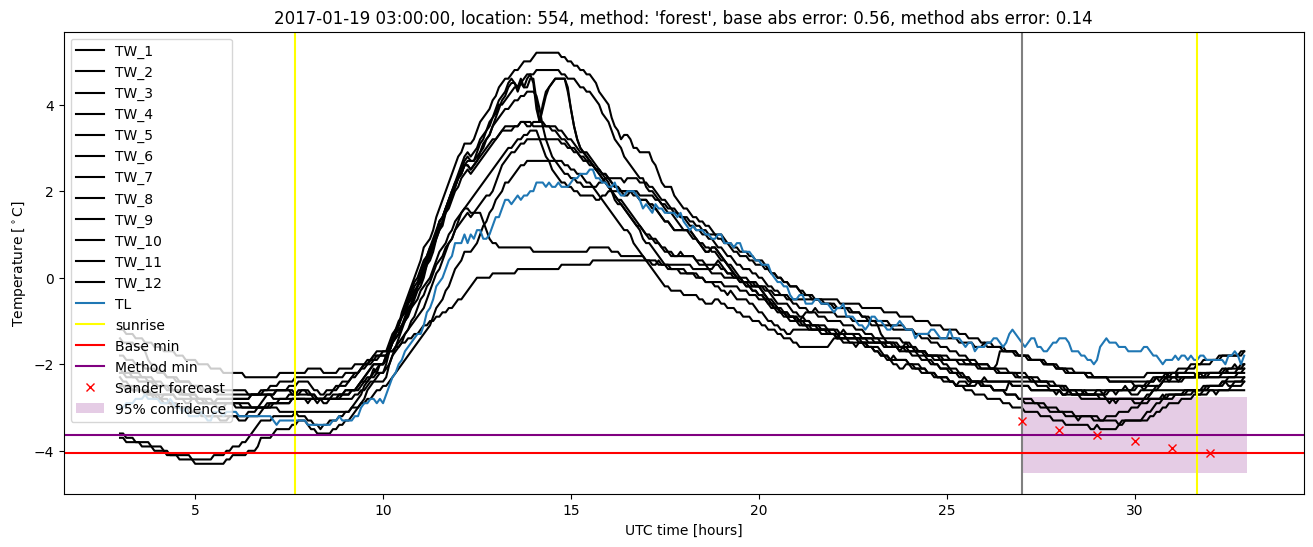
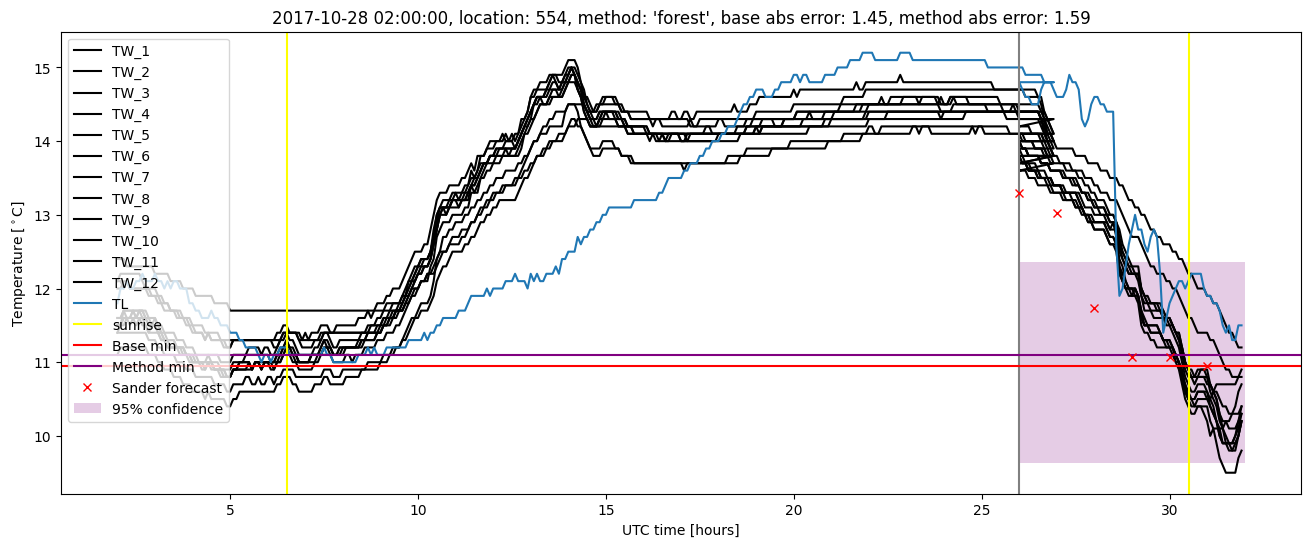
| forest |
winter 2017 |
0.984 |
0.000e+00 |
0.218 |
0.340 |
1.587 |
0.483 |
4.491 |
| baseline |
winter 2018 |
0.994 |
0.000e+00 |
0.284 |
0.410 |
2.054 |
NaN |
NaN |
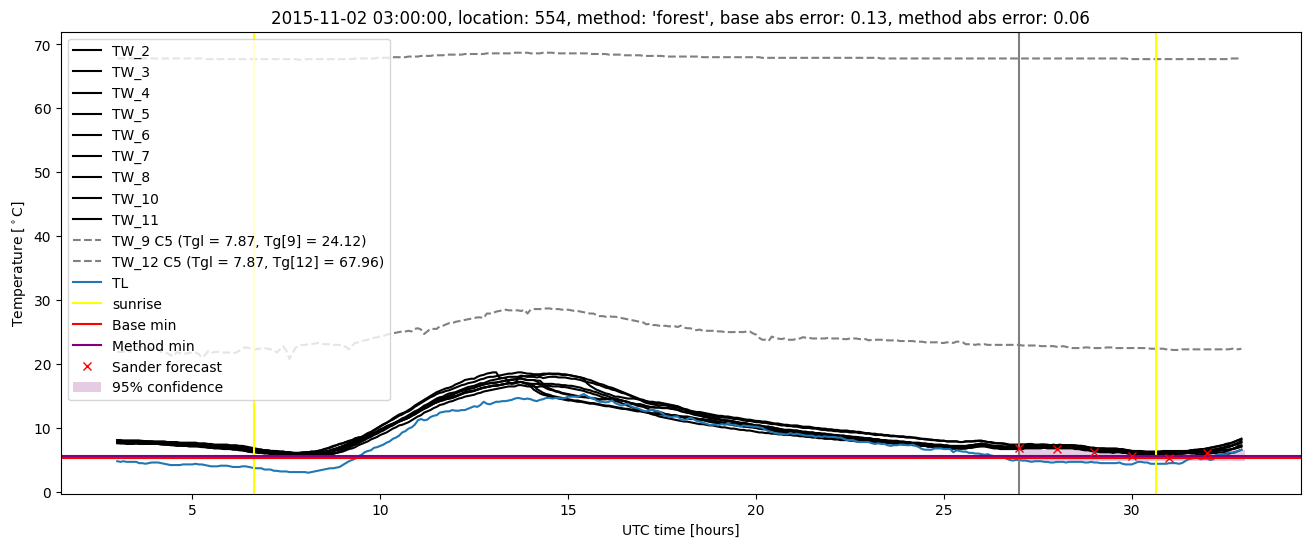
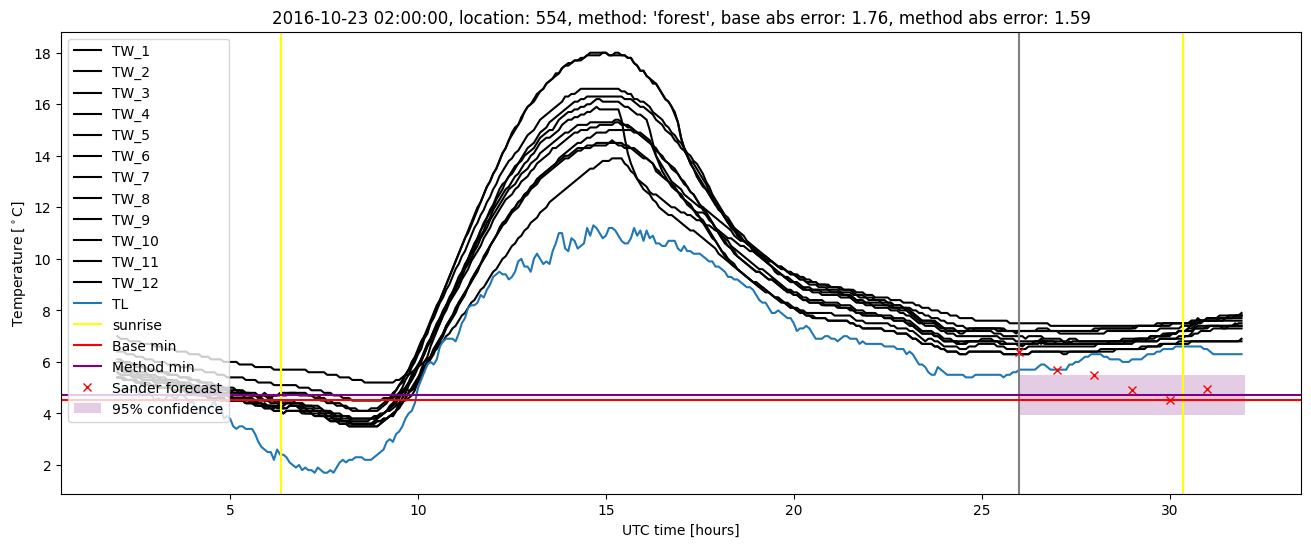
| forest |
winter 2018 |
1.000 |
0.000e+00 |
0.218 |
0.344 |
2.205 |
0.473 |
4.067 |
| baseline |
winter 2019 |
0.994 |
0.000e+00 |
0.263 |
0.382 |
1.626 |
NaN |
NaN |
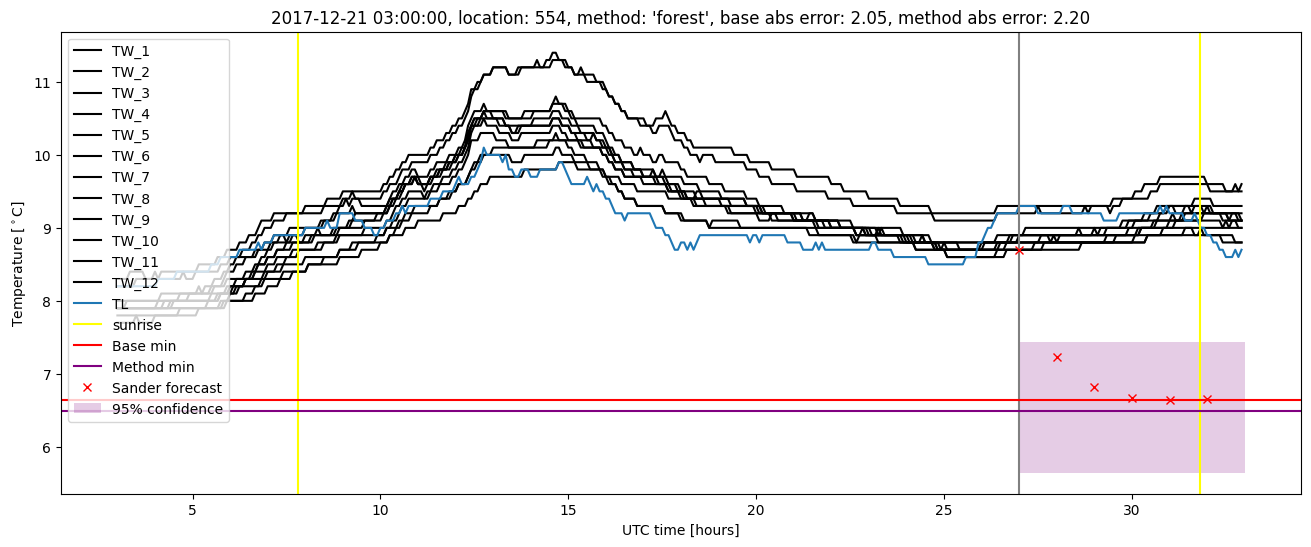
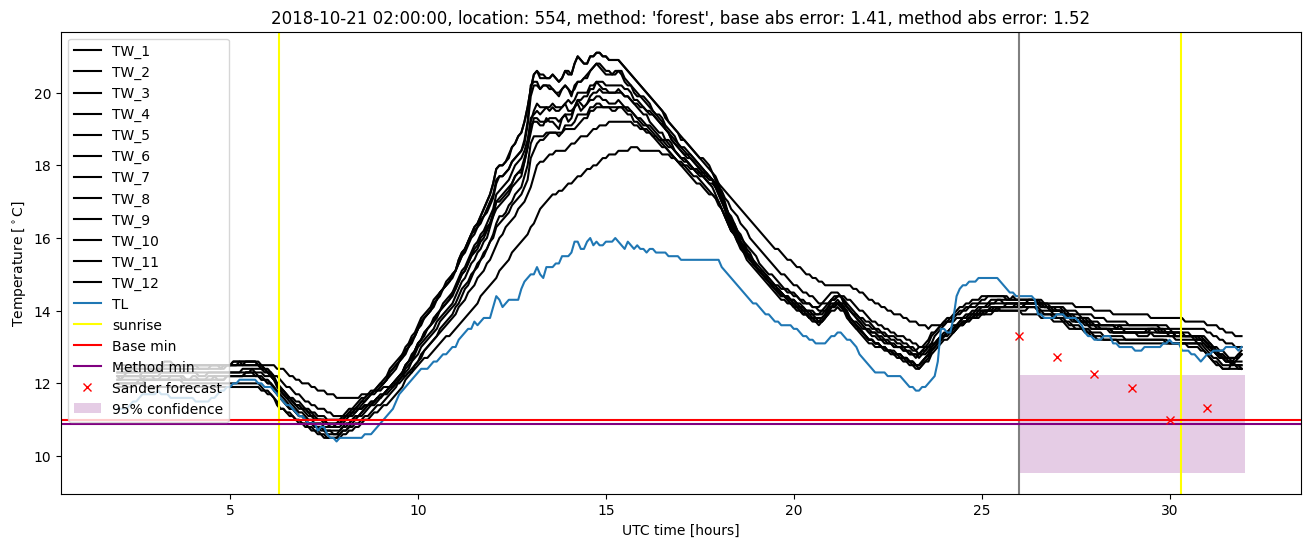
| forest |
winter 2019 |
0.994 |
0.083 |
0.227 |
0.352 |
1.523 |
0.474 |
4.418 |
| baseline |
all |
0.989 |
0.000e+00 |
0.299 |
0.411 |
2.085 |
NaN |
NaN |
| forest |
all |
0.992 |
0.014 |
0.233 |
0.356 |
2.205 |
0.475 |
4.589 |
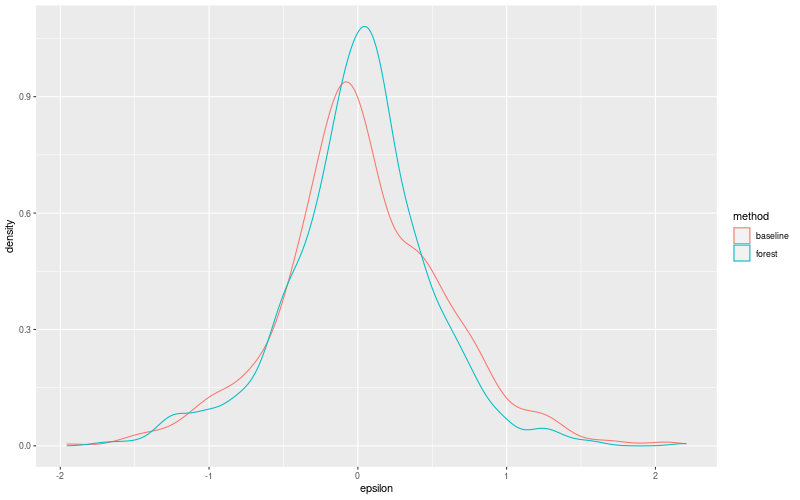
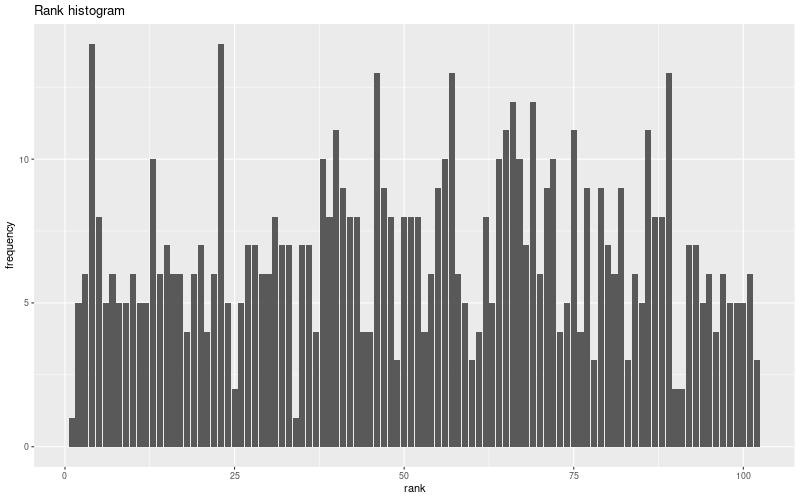
Random forest plots
Extended logistic regression results
| names |
period |
power |
significance |
meanSquareError |
absError |
maxError |
CRPS |
IGN |
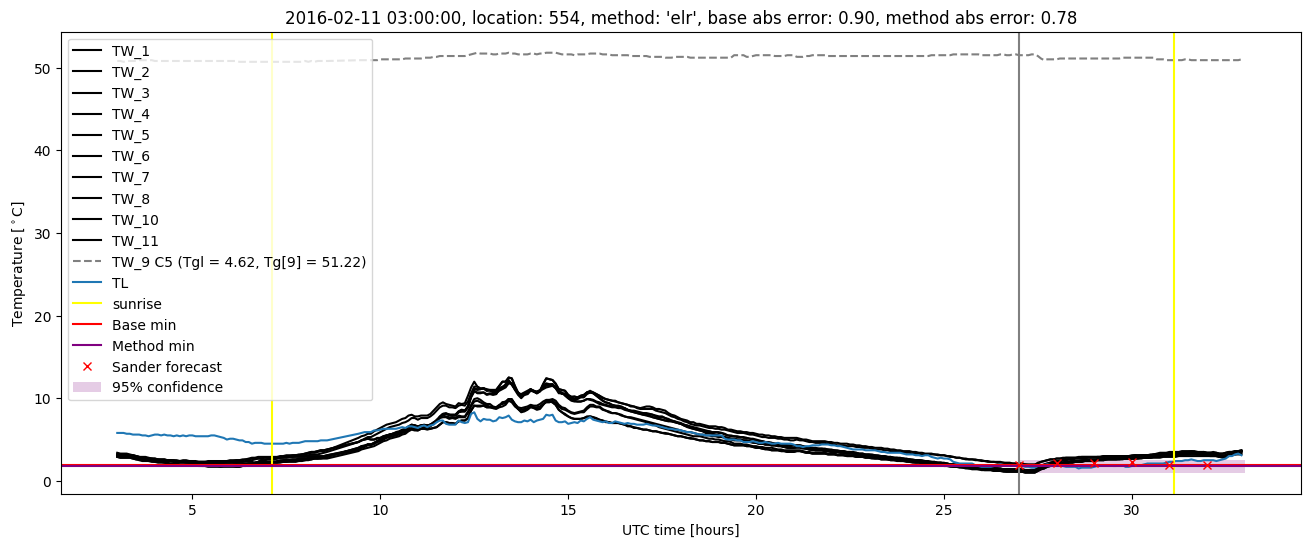
| baseline |
winter 2016 |
0.989 |
0.000e+00 |
0.325 |
0.430 |
1.954 |
NaN |
NaN |
| elr |
winter 2016 |
0.989 |
0.000e+00 |
0.280 |
0.399 |
1.790 |
0.542 |
6.207 |
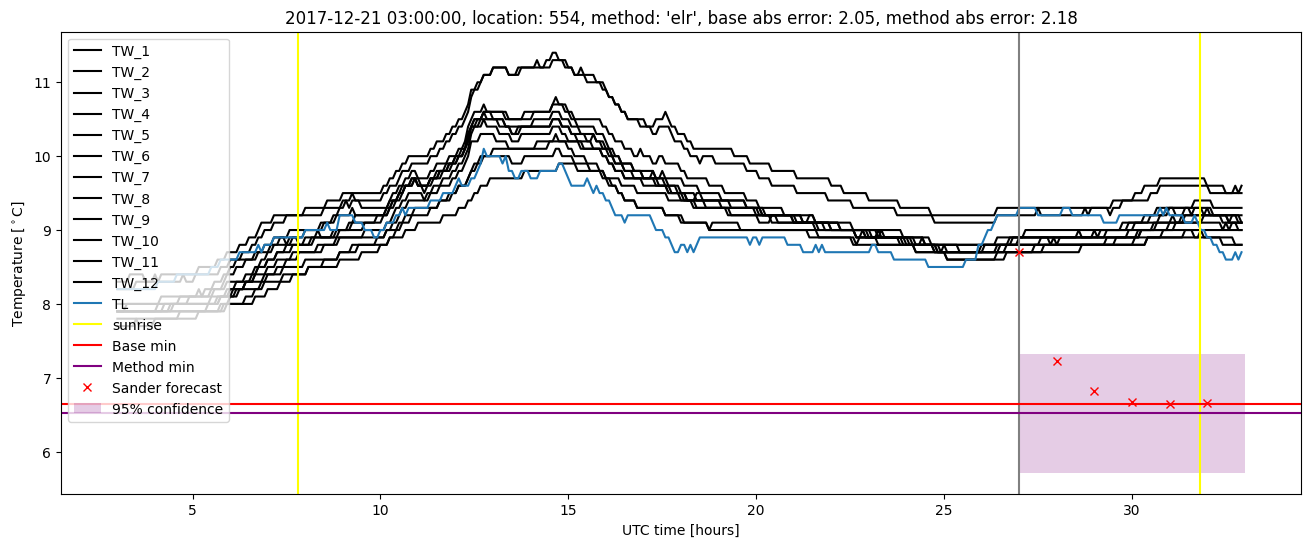
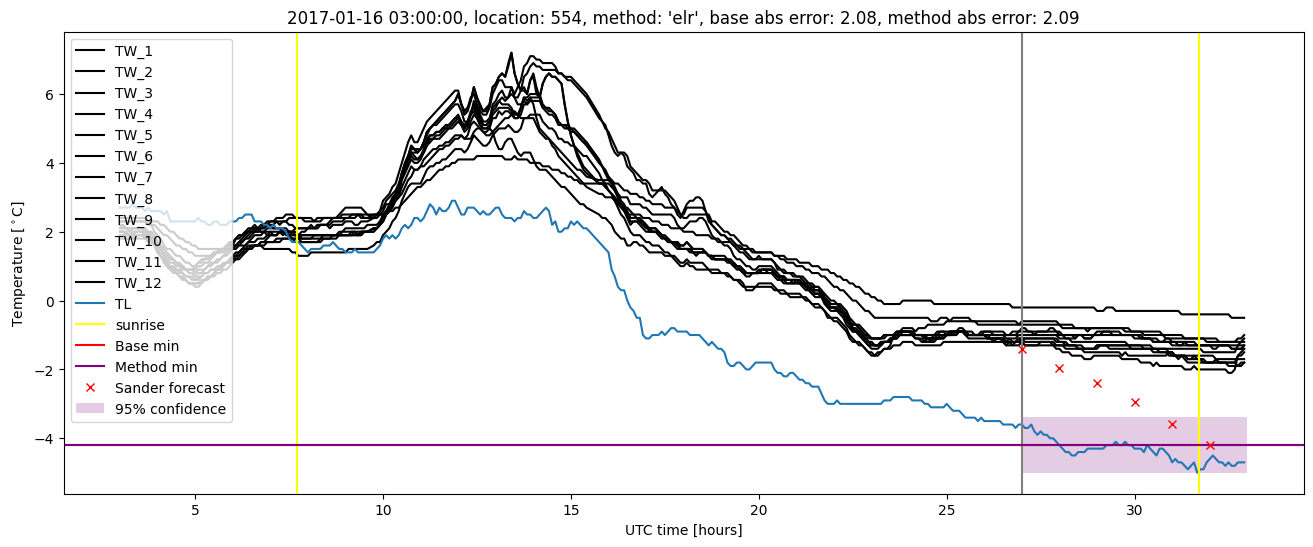
| baseline |
winter 2017 |
0.976 |
0.000e+00 |
0.325 |
0.421 |
2.085 |
NaN |
NaN |
| elr |
winter 2017 |
0.984 |
0.000e+00 |
0.298 |
0.386 |
2.090 |
0.534 |
5.832 |
| baseline |
winter 2018 |
0.994 |
0.000e+00 |
0.284 |
0.410 |
2.054 |
NaN |
NaN |
| elr |
winter 2018 |
0.987 |
0.000e+00 |
0.232 |
0.345 |
2.179 |
0.524 |
5.500 |
| baseline |
winter 2019 |
0.994 |
0.000e+00 |
0.263 |
0.382 |
1.626 |
NaN |
NaN |
| elr |
winter 2019 |
1.000 |
0.083 |
0.264 |
0.383 |
1.803 |
0.501 |
4.528 |
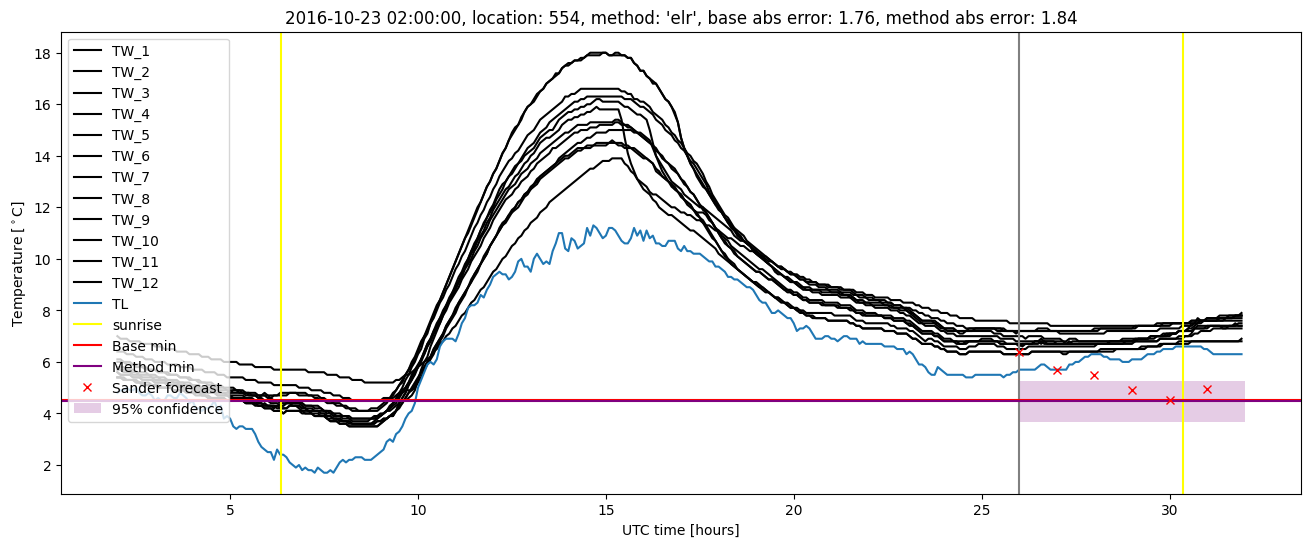
| baseline |
all |
0.989 |
0.000e+00 |
0.299 |
0.411 |
2.085 |
NaN |
NaN |
| elr |
all |
0.990 |
0.014 |
0.268 |
0.378 |
2.179 |
0.526 |
5.539 |
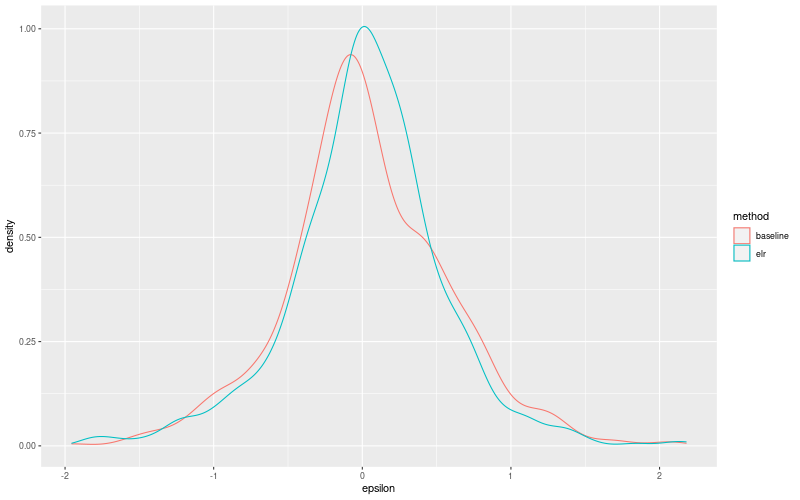
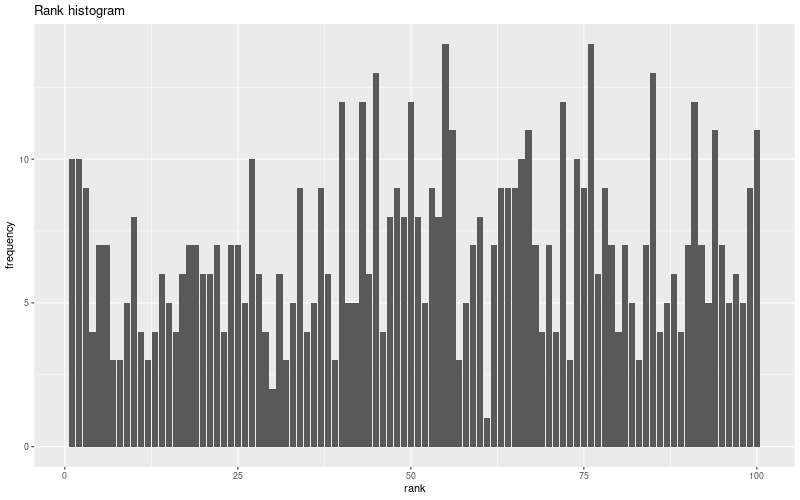
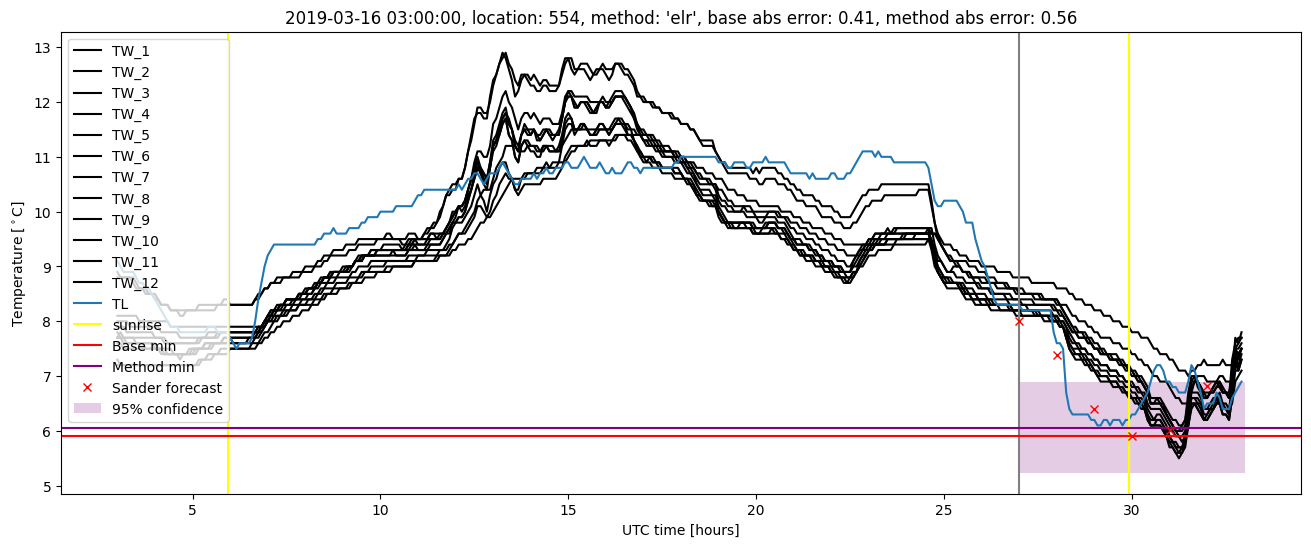
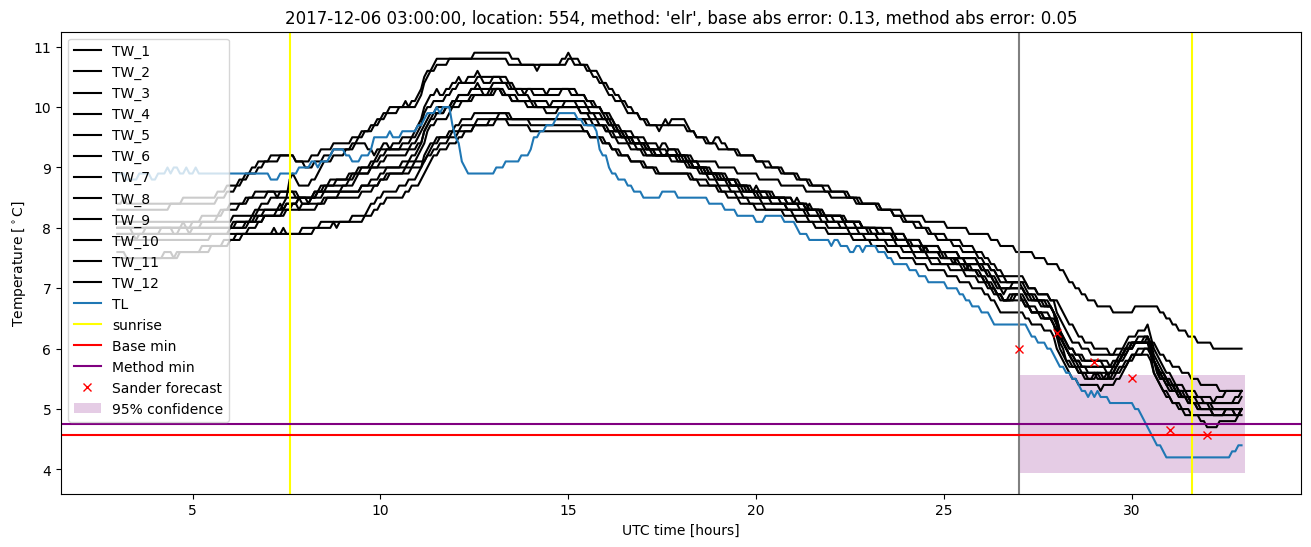
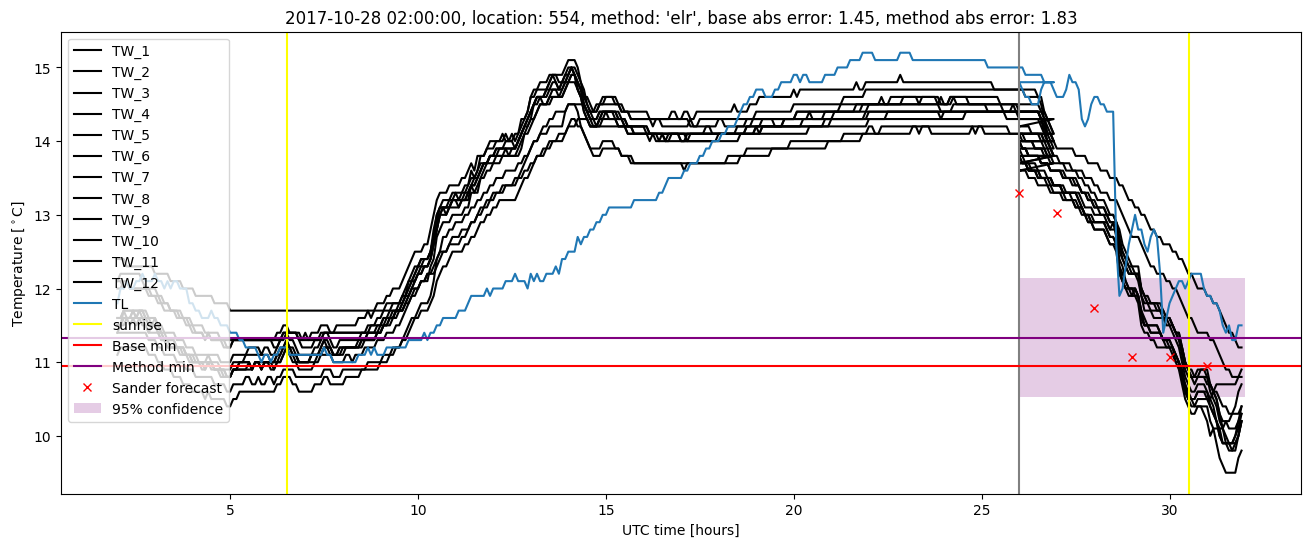
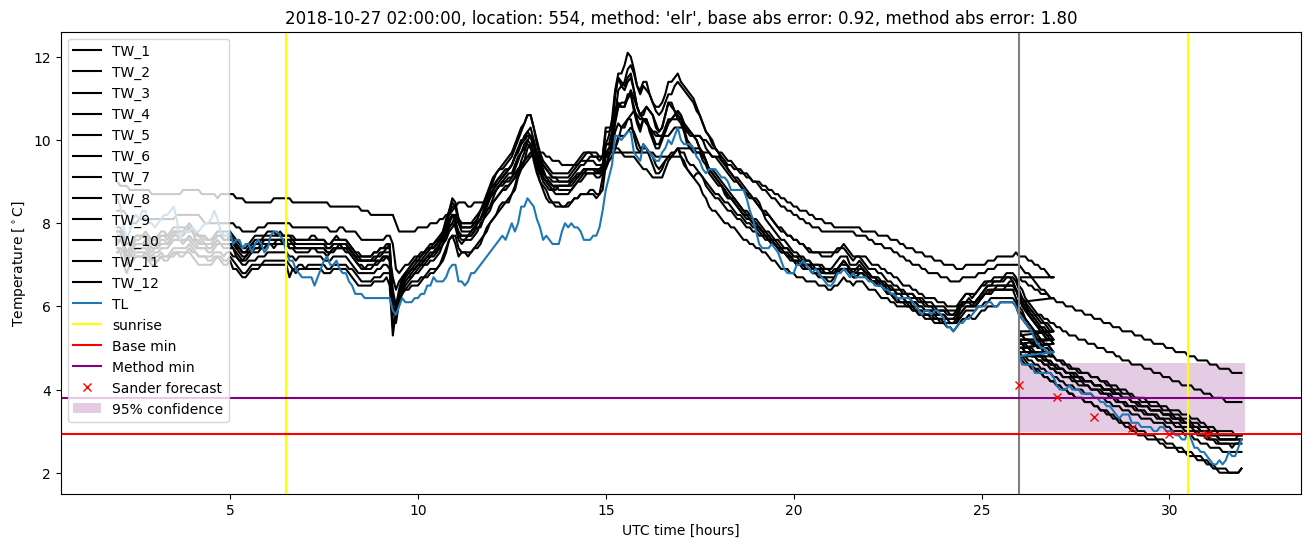
Extended logistic regression plots