GMS location: 553
Random forest results
| names |
period |
power |
significance |
meanSquareError |
absError |
maxError |
CRPS |
IGN |
| baseline |
winter 2016 |
0.995 |
0.000e+00 |
0.340 |
0.441 |
1.893 |
NaN |
NaN |
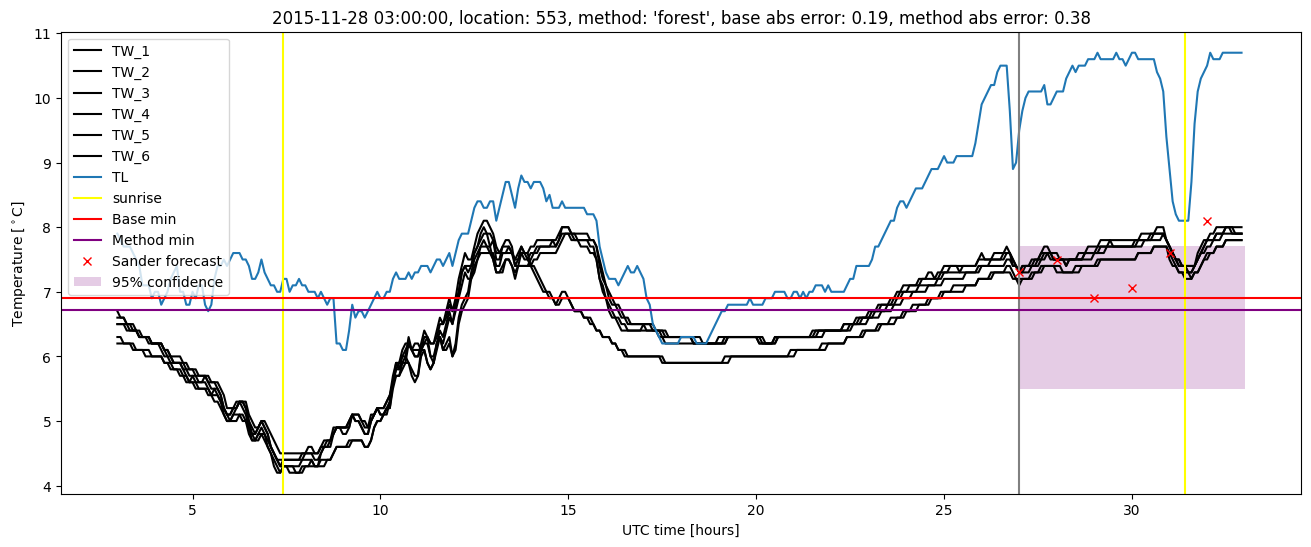
| forest |
winter 2016 |
0.995 |
0.056 |
0.272 |
0.404 |
1.920 |
0.474 |
2.100 |
| baseline |
winter 2017 |
0.972 |
0.000e+00 |
0.405 |
0.472 |
2.151 |
NaN |
NaN |
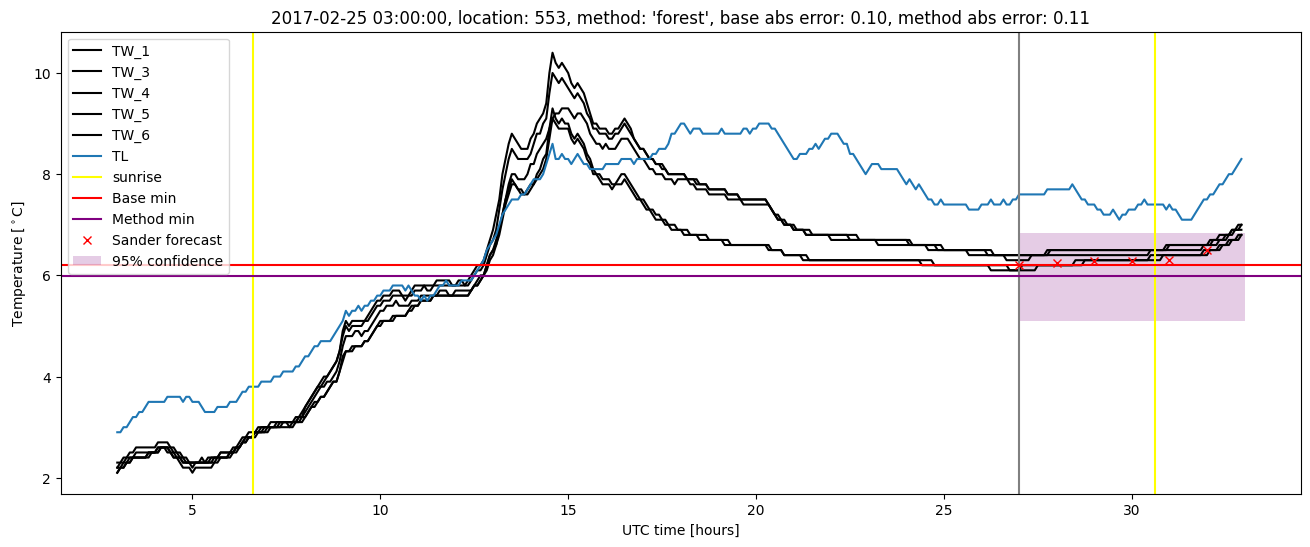
| forest |
winter 2017 |
0.972 |
0.000e+00 |
0.294 |
0.407 |
1.807 |
0.463 |
1.907 |
| baseline |
winter 2018 |
0.980 |
0.111 |
0.387 |
0.451 |
3.783 |
NaN |
NaN |
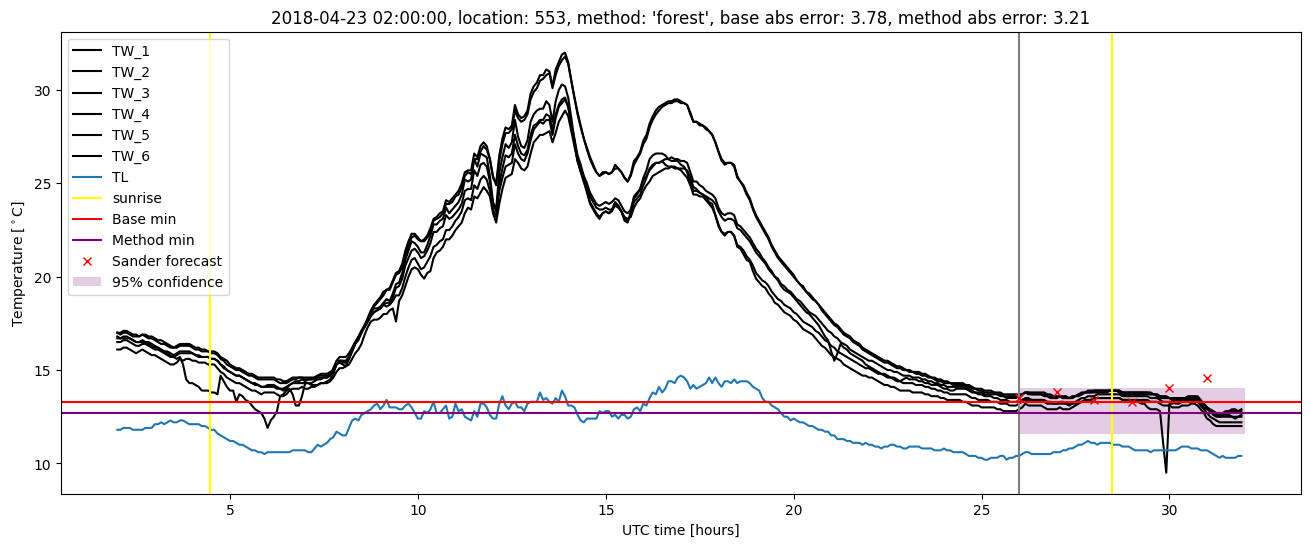
| forest |
winter 2018 |
0.993 |
0.074 |
0.304 |
0.389 |
3.212 |
0.473 |
1.817 |
| baseline |
winter 2019 |
0.986 |
0.133 |
0.598 |
0.546 |
3.028 |
NaN |
NaN |
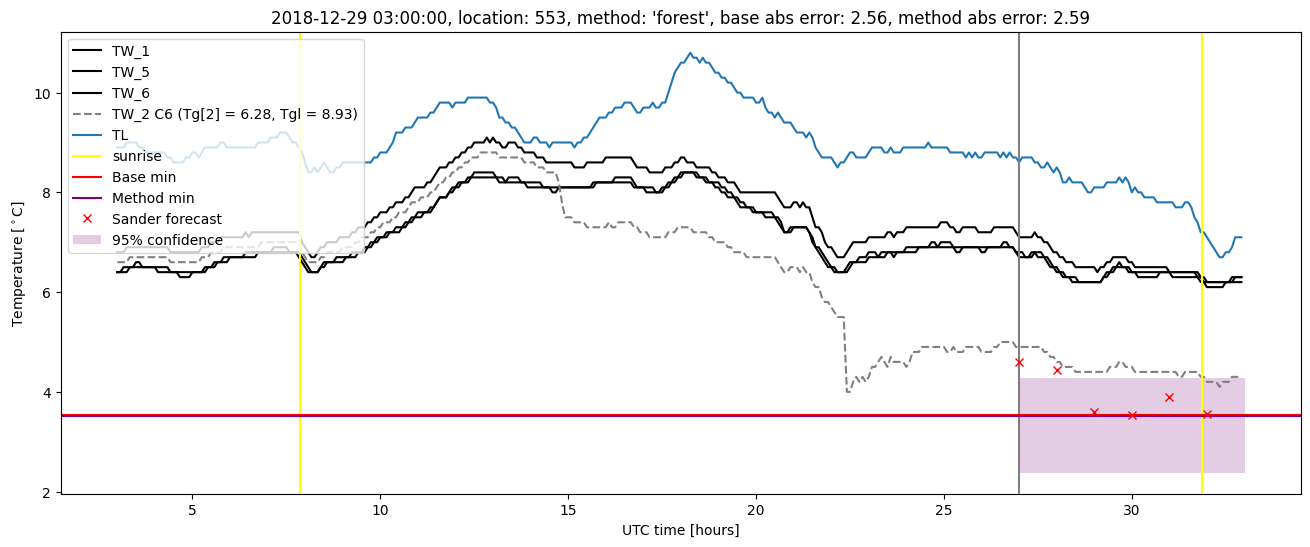
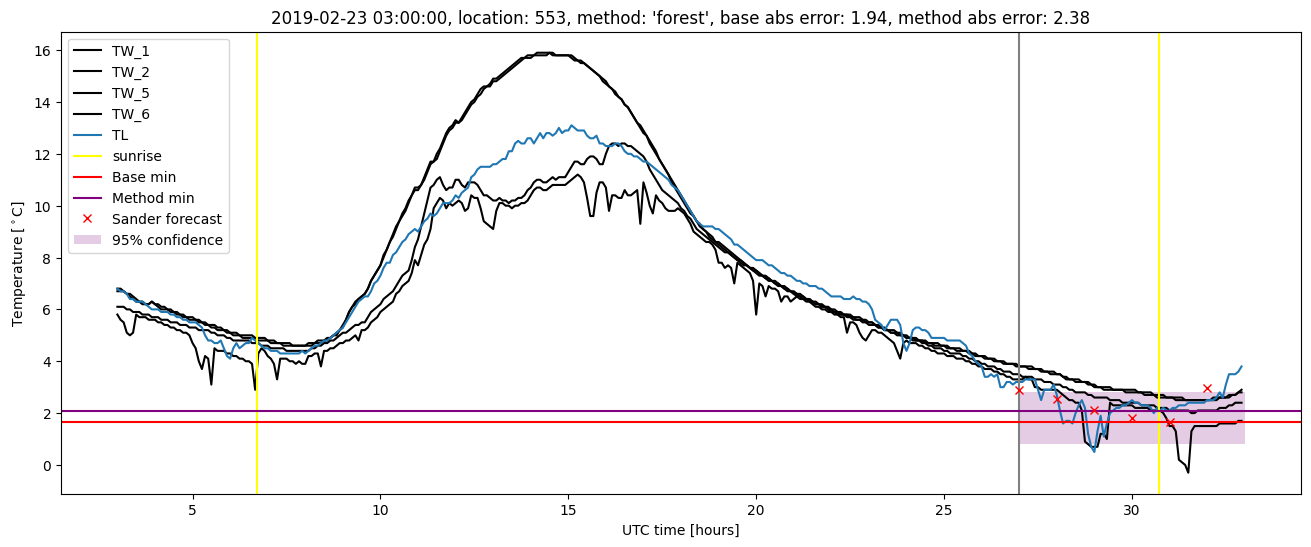
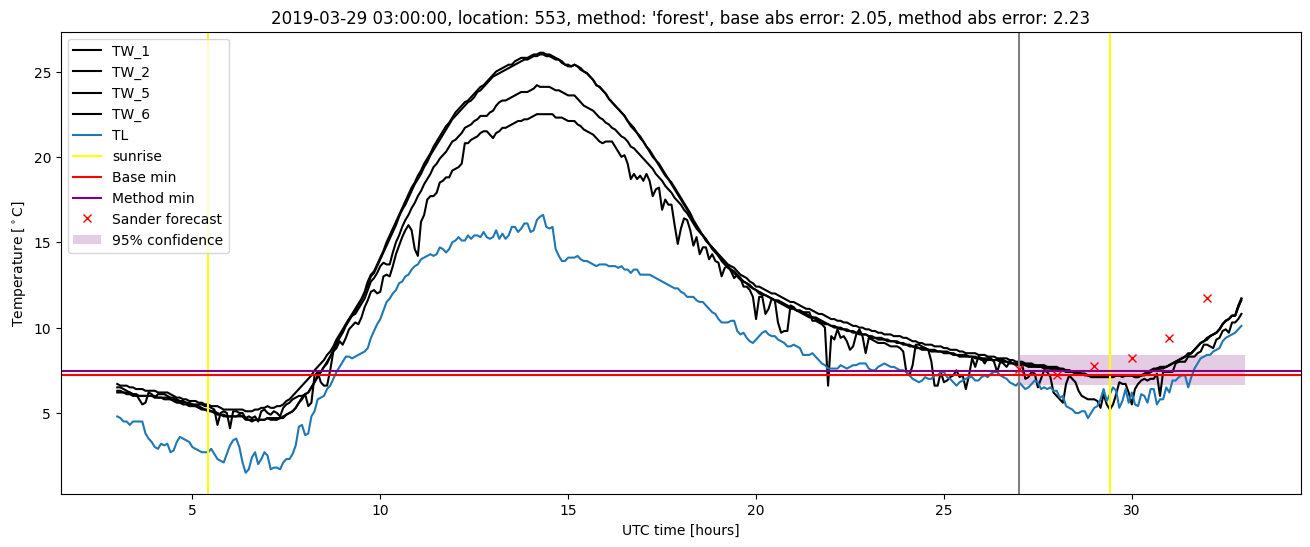
| forest |
winter 2019 |
0.993 |
0.200 |
0.569 |
0.542 |
3.038 |
0.478 |
3.224 |
| baseline |
all |
0.985 |
0.058 |
0.425 |
0.474 |
3.783 |
NaN |
NaN |
| forest |
all |
0.990 |
0.069 |
0.355 |
0.433 |
3.212 |
0.473 |
2.250 |
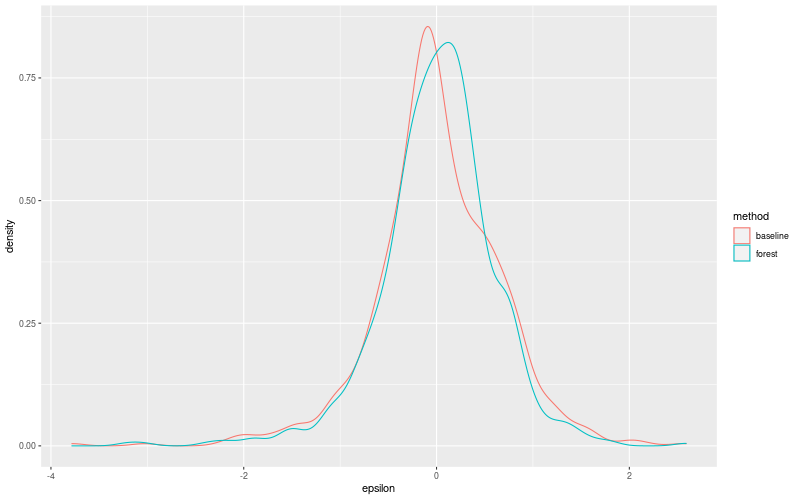
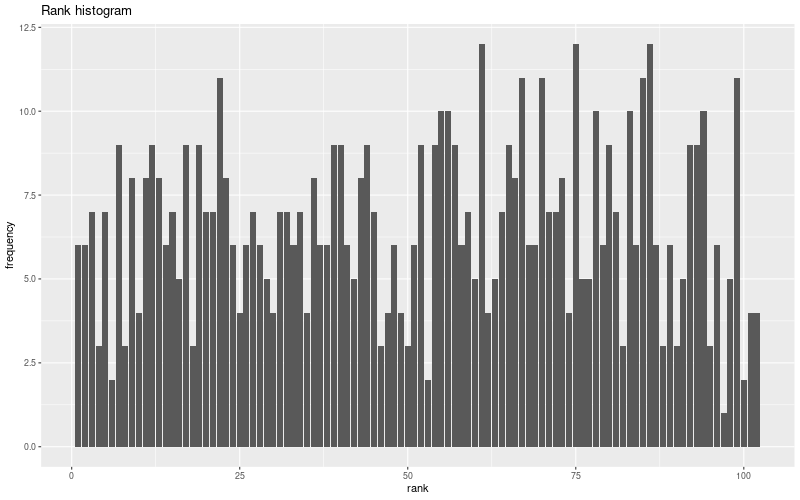
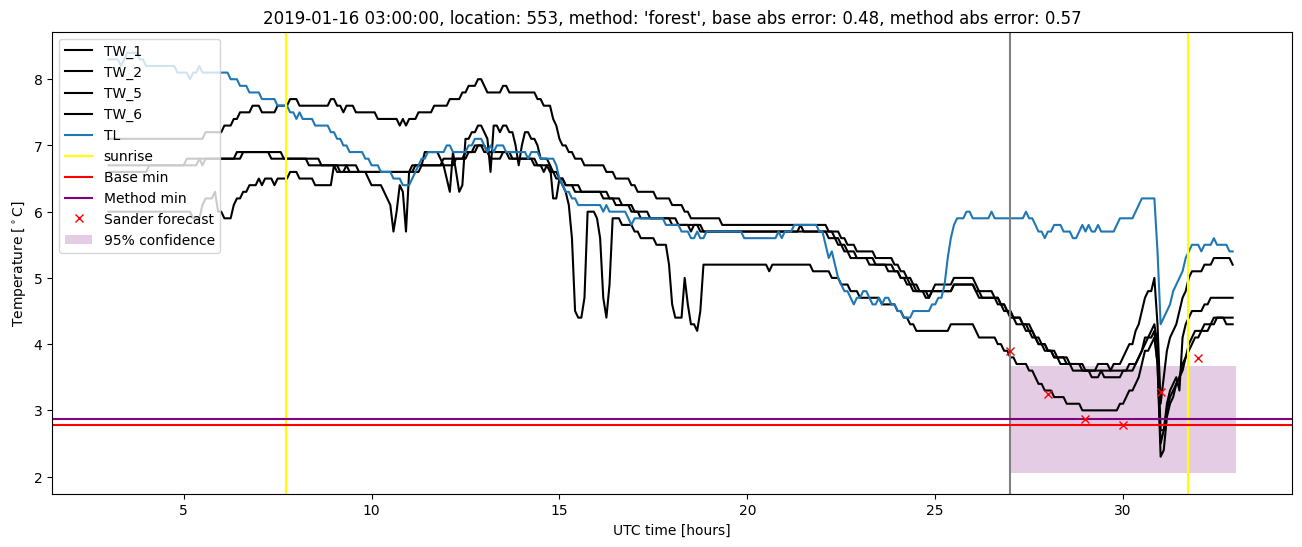
Random forest plots

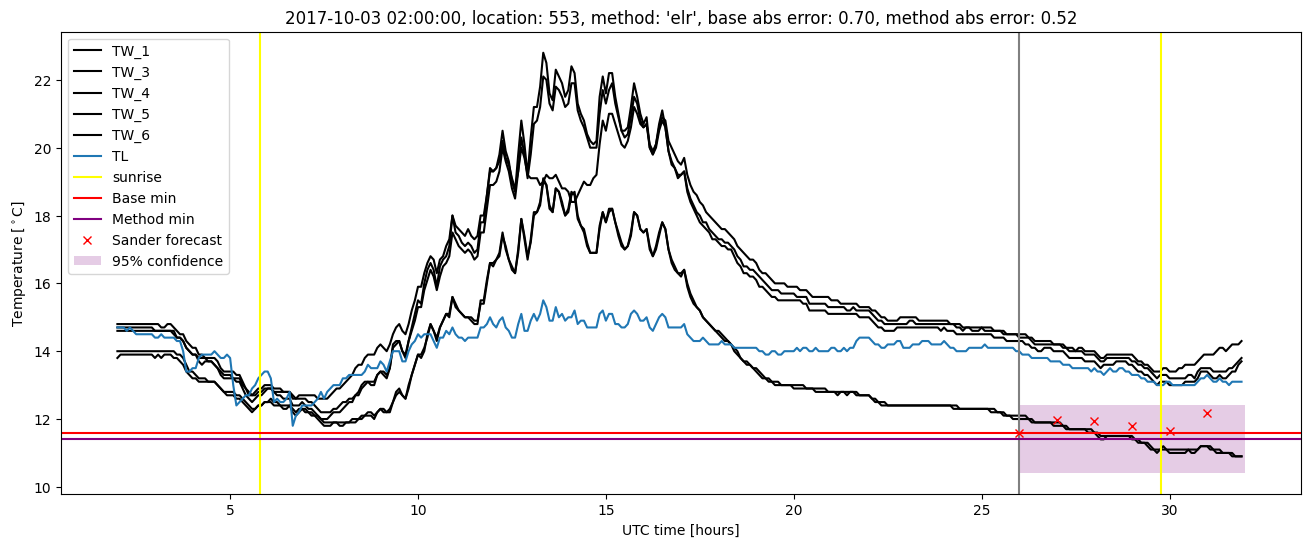
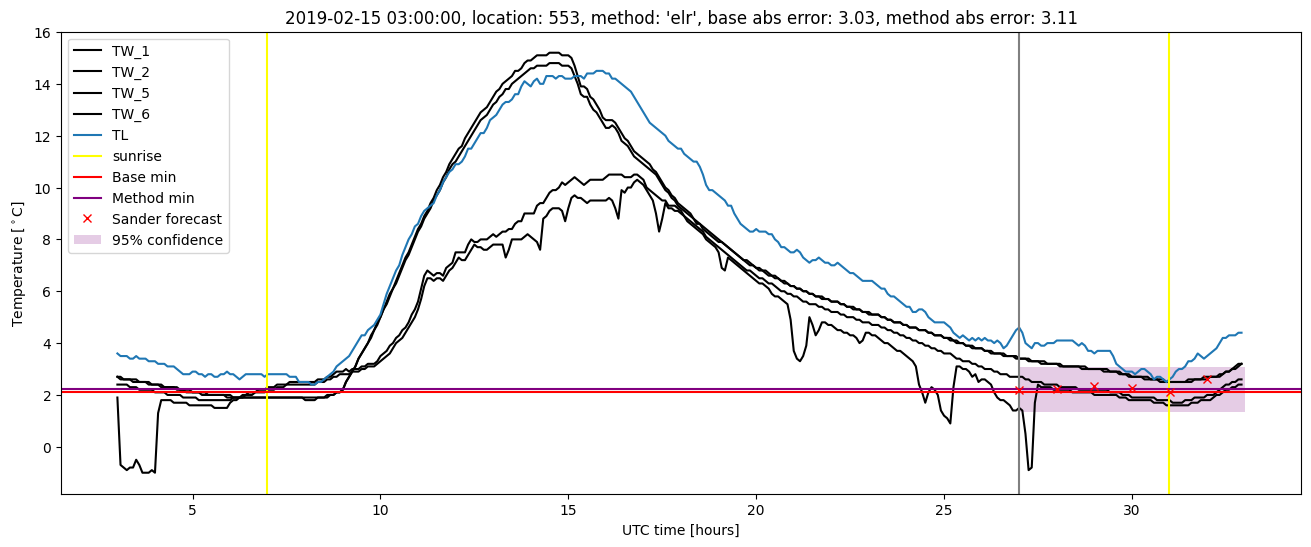
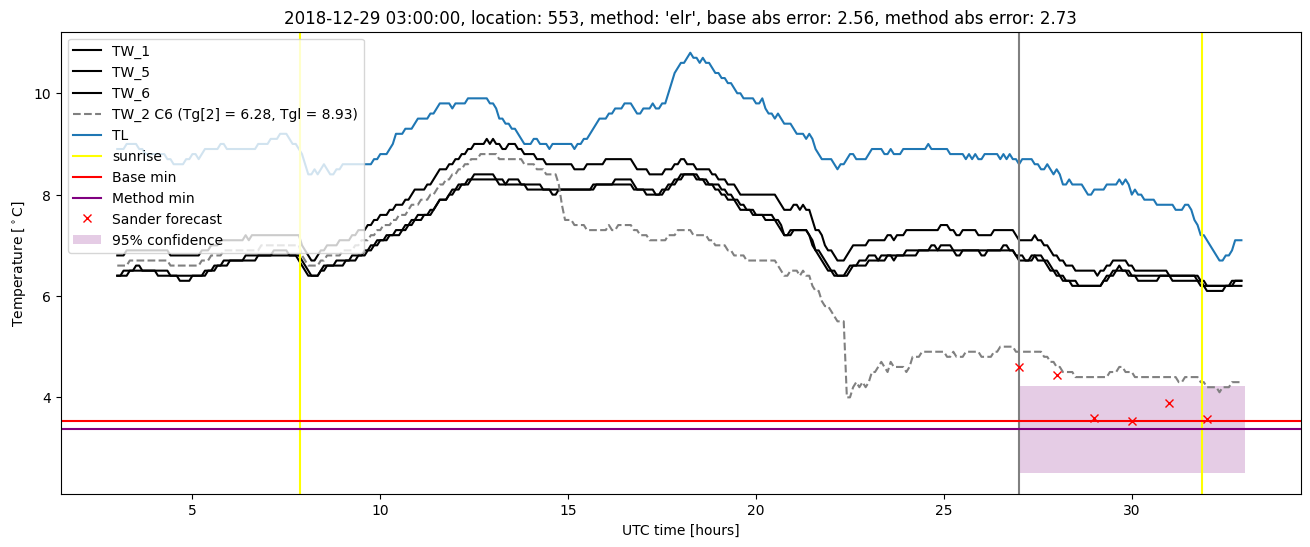
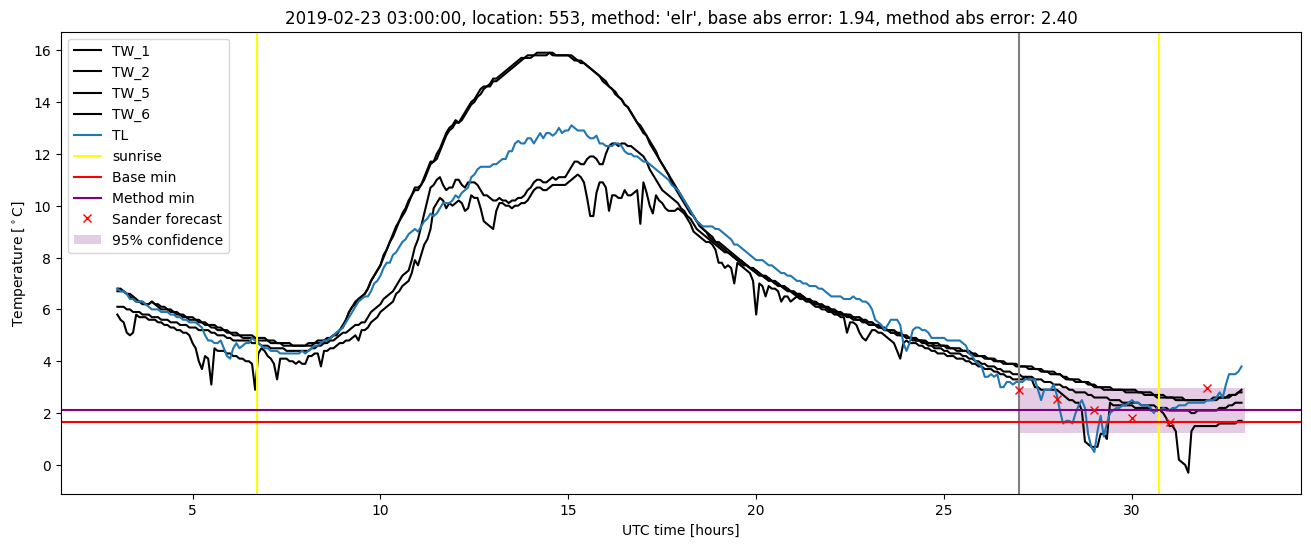
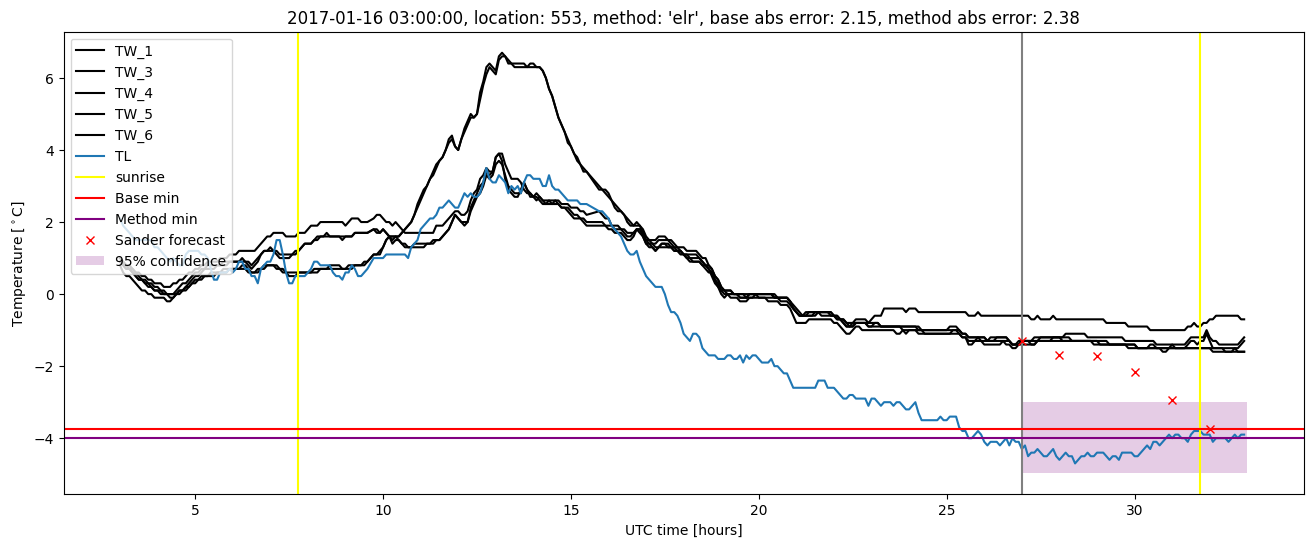
Extended logistic regression results
| names |
period |
power |
significance |
meanSquareError |
absError |
maxError |
CRPS |
IGN |
| baseline |
winter 2016 |
0.995 |
0.000e+00 |
0.340 |
0.441 |
1.893 |
NaN |
NaN |
| elr |
winter 2016 |
0.995 |
0.000e+00 |
0.337 |
0.462 |
1.629 |
0.567 |
3.172 |
| baseline |
winter 2017 |
0.972 |
0.000e+00 |
0.405 |
0.472 |
2.151 |
NaN |
NaN |
| elr |
winter 2017 |
0.972 |
0.000e+00 |
0.357 |
0.441 |
2.381 |
0.521 |
2.897 |
| baseline |
winter 2018 |
0.980 |
0.111 |
0.387 |
0.451 |
3.783 |
NaN |
NaN |
| elr |
winter 2018 |
0.993 |
0.074 |
0.325 |
0.404 |
3.307 |
0.522 |
2.646 |
| baseline |
winter 2019 |
0.986 |
0.133 |
0.598 |
0.546 |
3.028 |
NaN |
NaN |
| elr |
winter 2019 |
0.993 |
0.200 |
0.595 |
0.548 |
3.111 |
0.581 |
5.261 |
| baseline |
all |
0.985 |
0.058 |
0.425 |
0.474 |
3.783 |
NaN |
NaN |
| elr |
all |
0.990 |
0.058 |
0.398 |
0.463 |
3.307 |
0.549 |
3.467 |
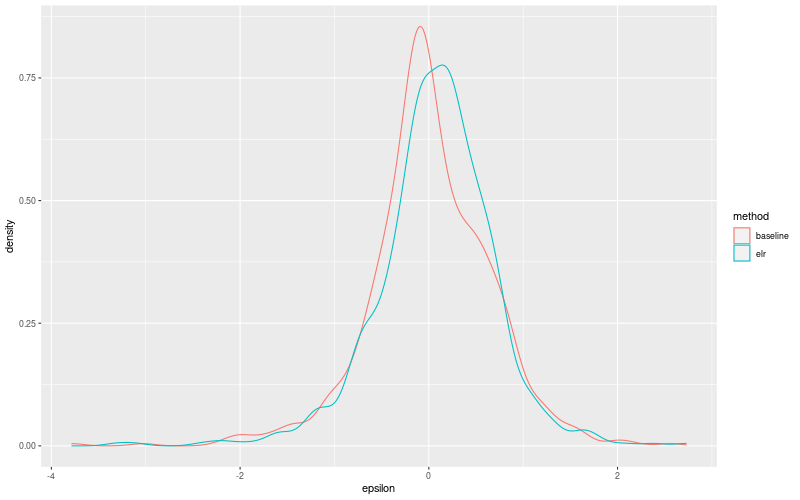
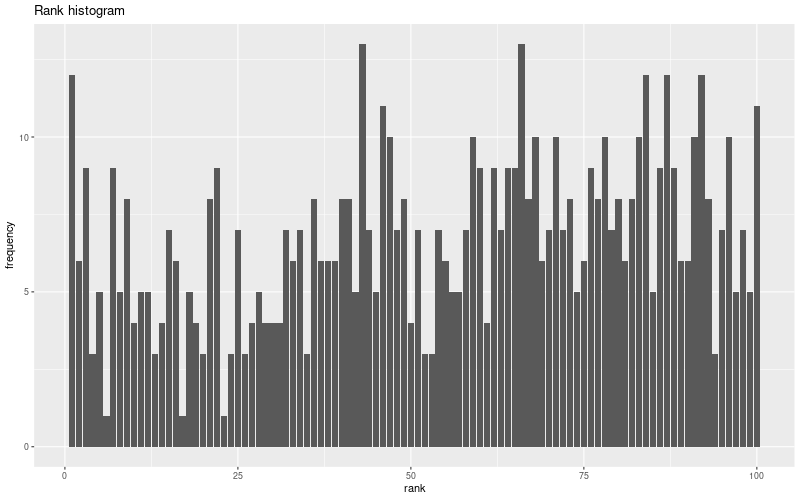
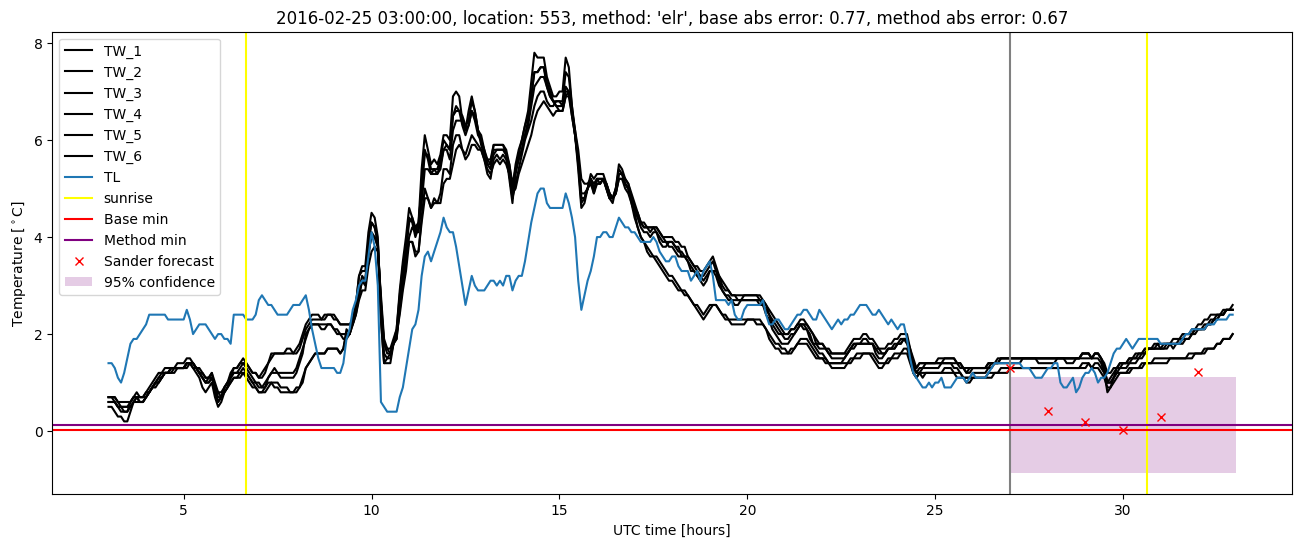
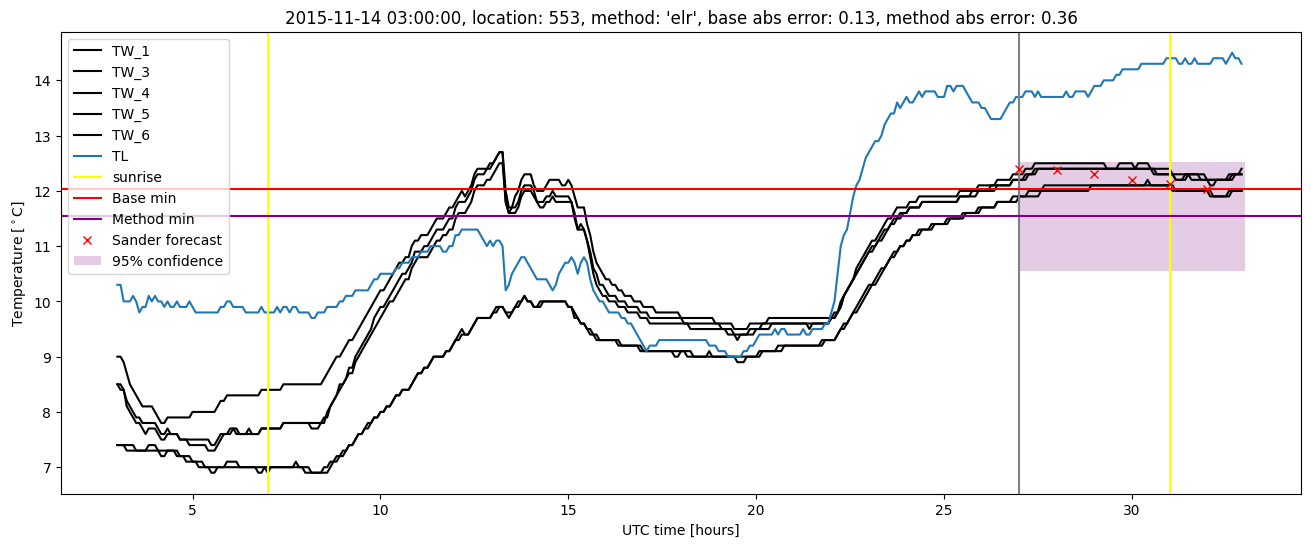
Extended logistic regression plots