GMS location: 552
Random forest results
| names |
period |
power |
significance |
meanSquareError |
absError |
maxError |
CRPS |
IGN |
| baseline |
winter 2016 |
0.994 |
0.000e+00 |
0.335 |
0.423 |
2.599 |
NaN |
NaN |
| forest |
winter 2016 |
1.000 |
0.056 |
0.262 |
0.376 |
2.518 |
0.447 |
3.912 |
| baseline |
winter 2017 |
0.967 |
0.000e+00 |
0.382 |
0.456 |
2.251 |
NaN |
NaN |
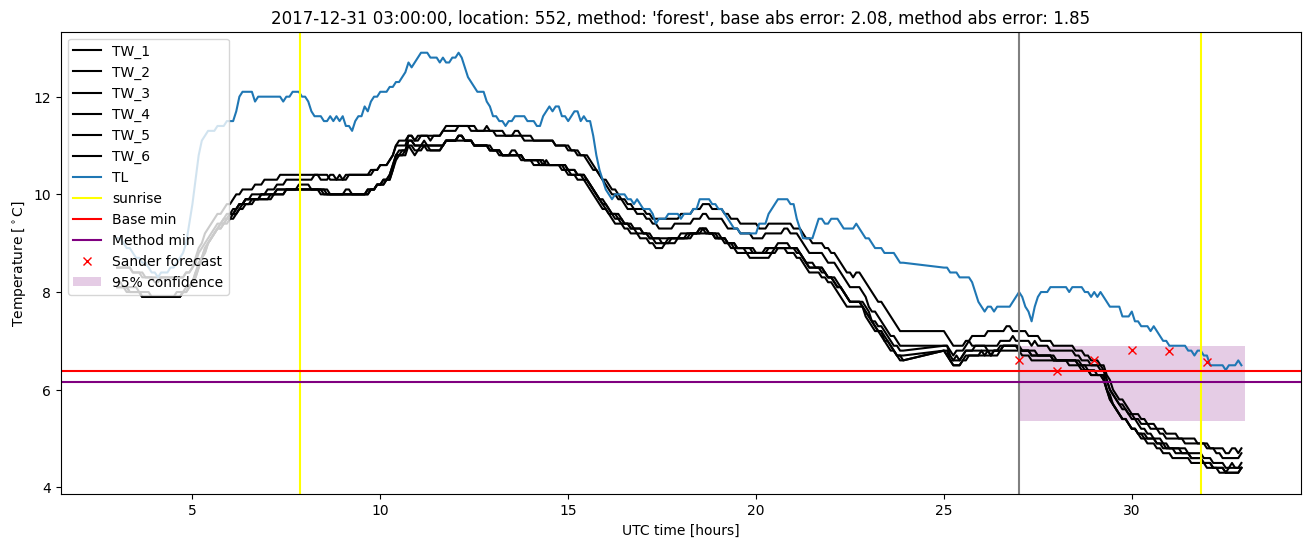
| forest |
winter 2017 |
0.959 |
0.031 |
0.262 |
0.387 |
1.847 |
0.460 |
4.019 |
| baseline |
winter 2018 |
0.986 |
0.095 |
0.306 |
0.417 |
2.077 |
NaN |
NaN |
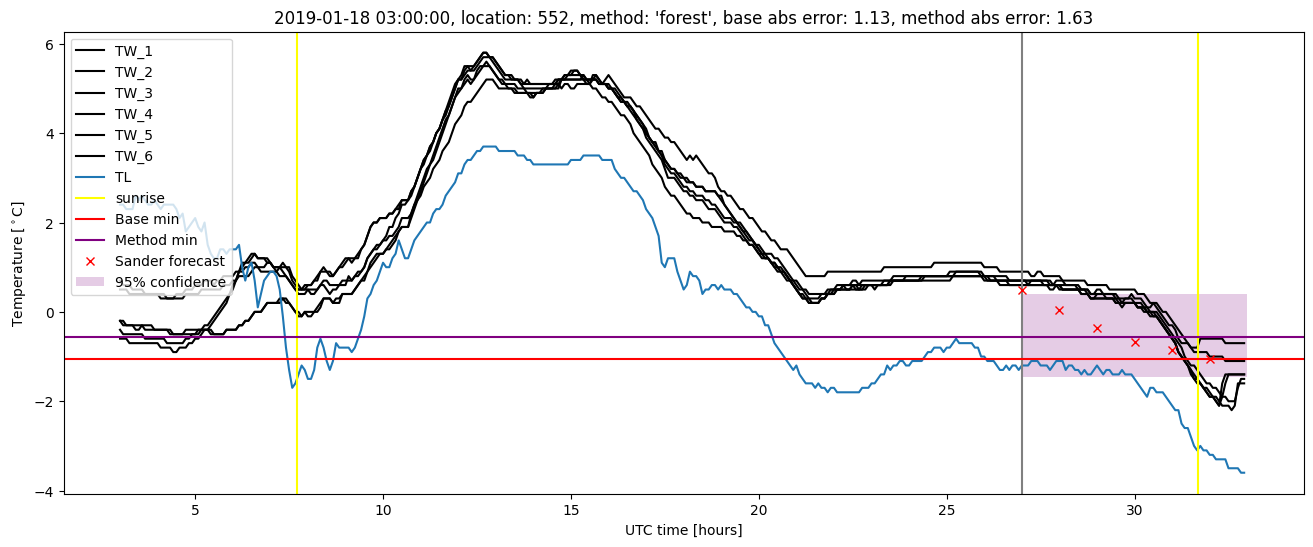
| forest |
winter 2018 |
0.993 |
0.095 |
0.251 |
0.377 |
1.850 |
0.462 |
3.104 |
| baseline |
winter 2019 |
0.985 |
0.111 |
0.305 |
0.420 |
1.662 |
NaN |
NaN |
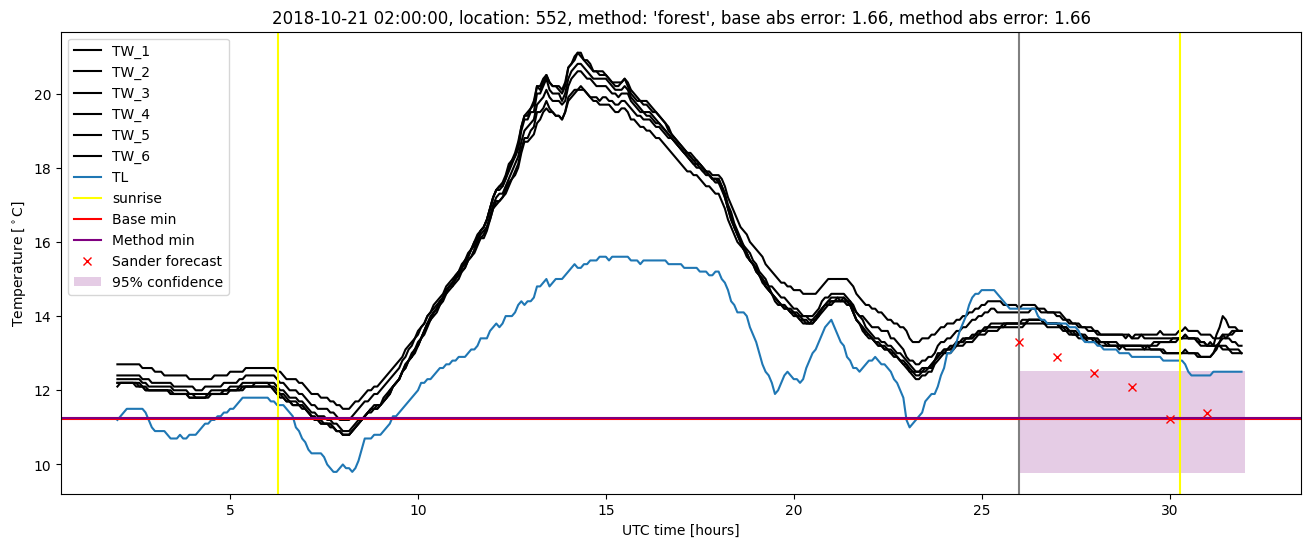
| forest |
winter 2019 |
0.993 |
0.111 |
0.301 |
0.416 |
1.656 |
0.449 |
3.265 |
| baseline |
all |
0.985 |
0.037 |
0.332 |
0.429 |
2.599 |
NaN |
NaN |
| forest |
all |
0.988 |
0.062 |
0.268 |
0.387 |
2.518 |
0.454 |
3.593 |
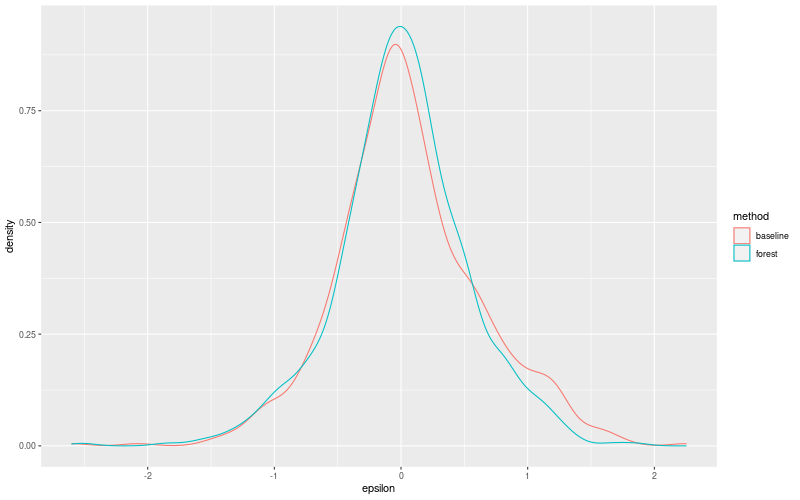
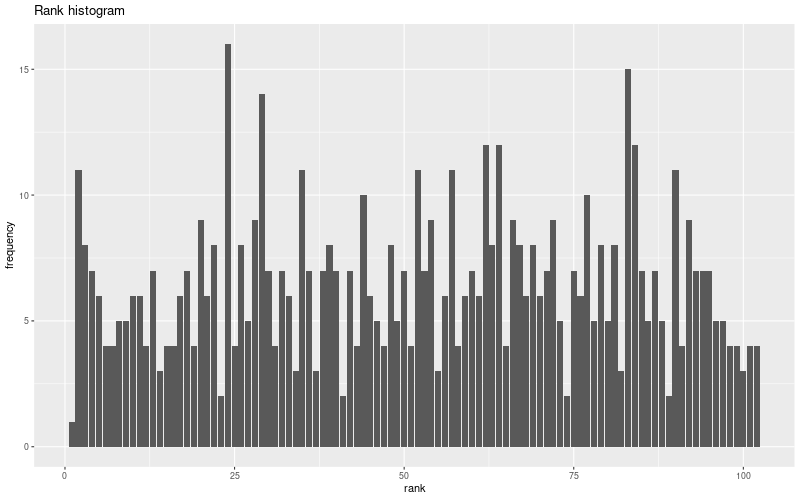
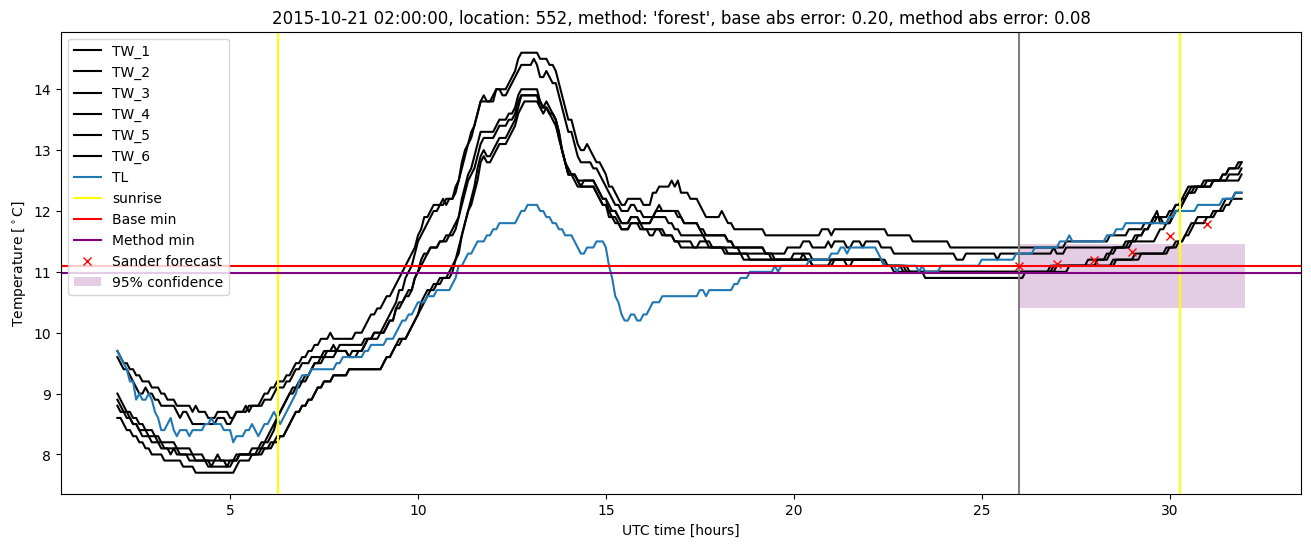
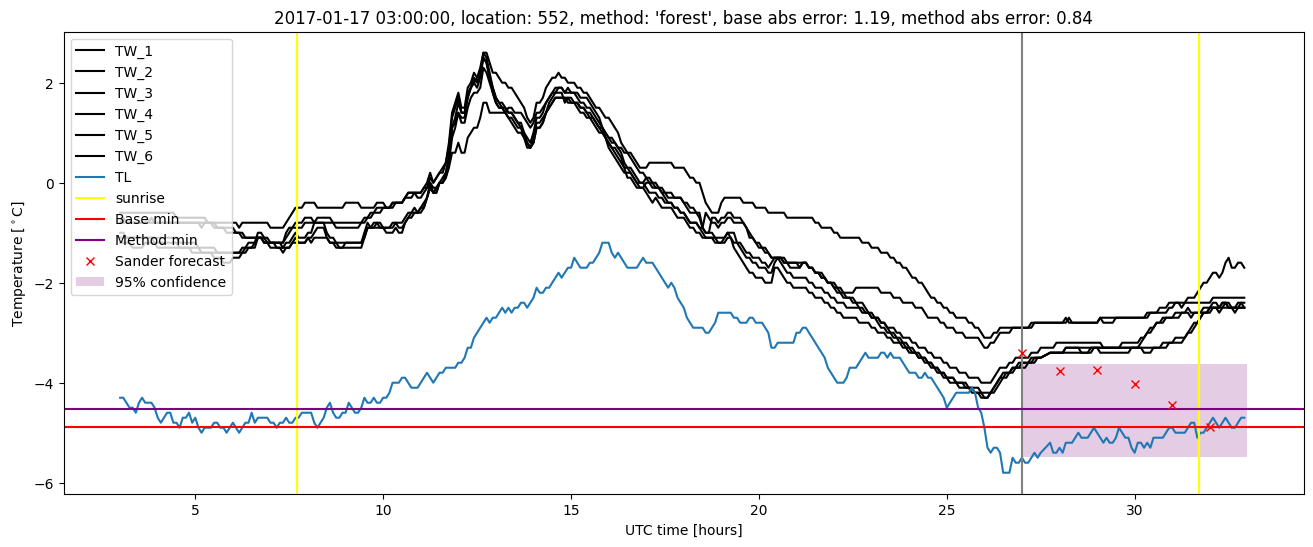
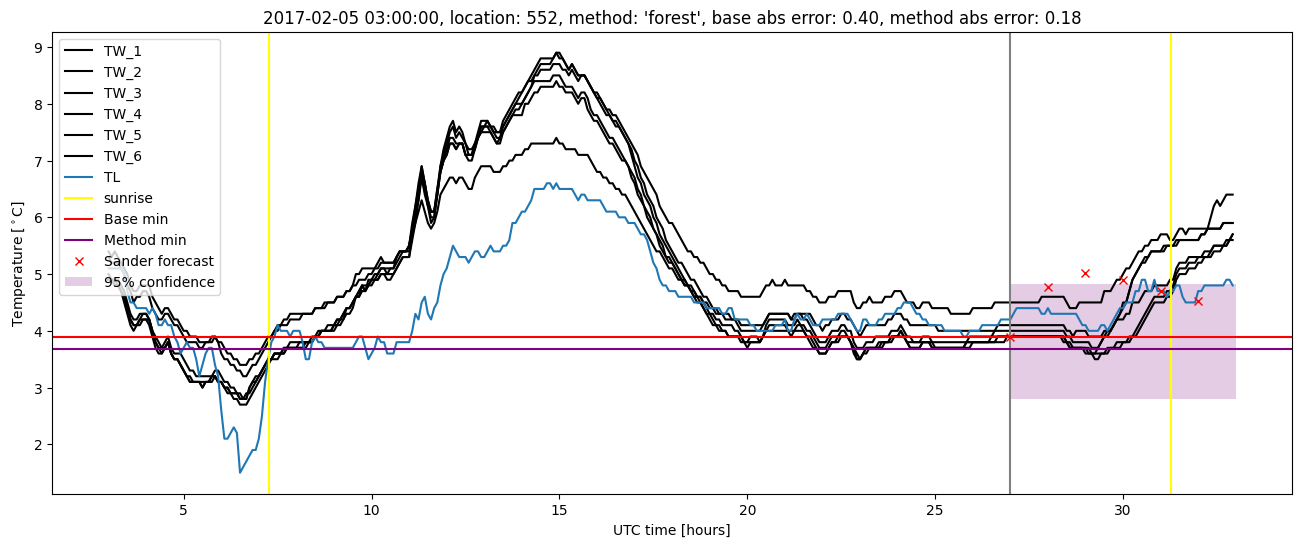
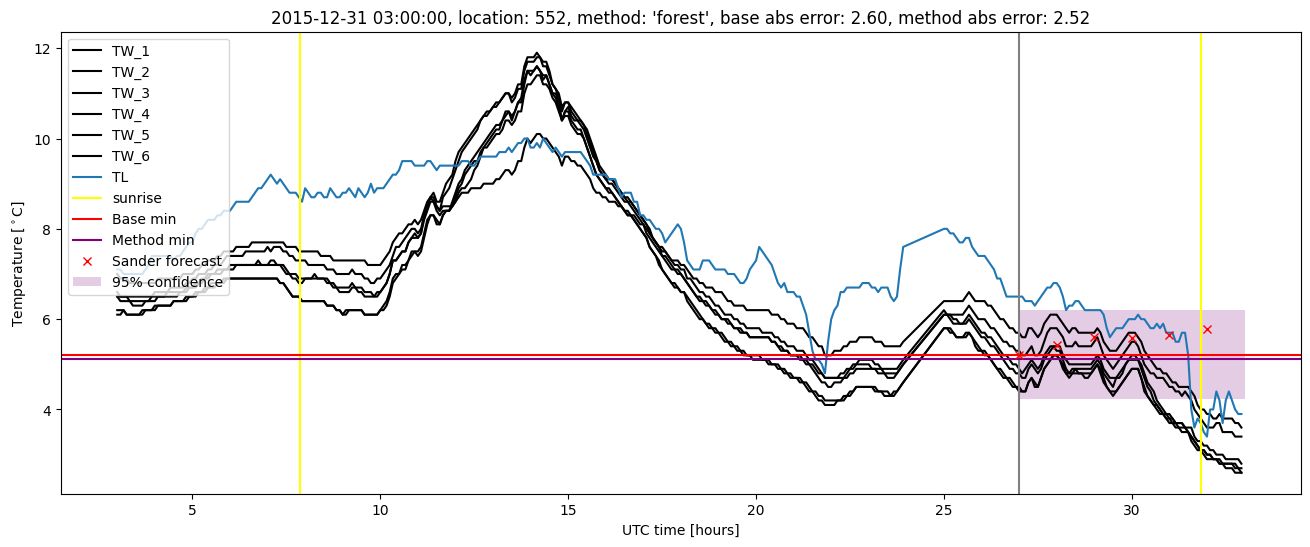
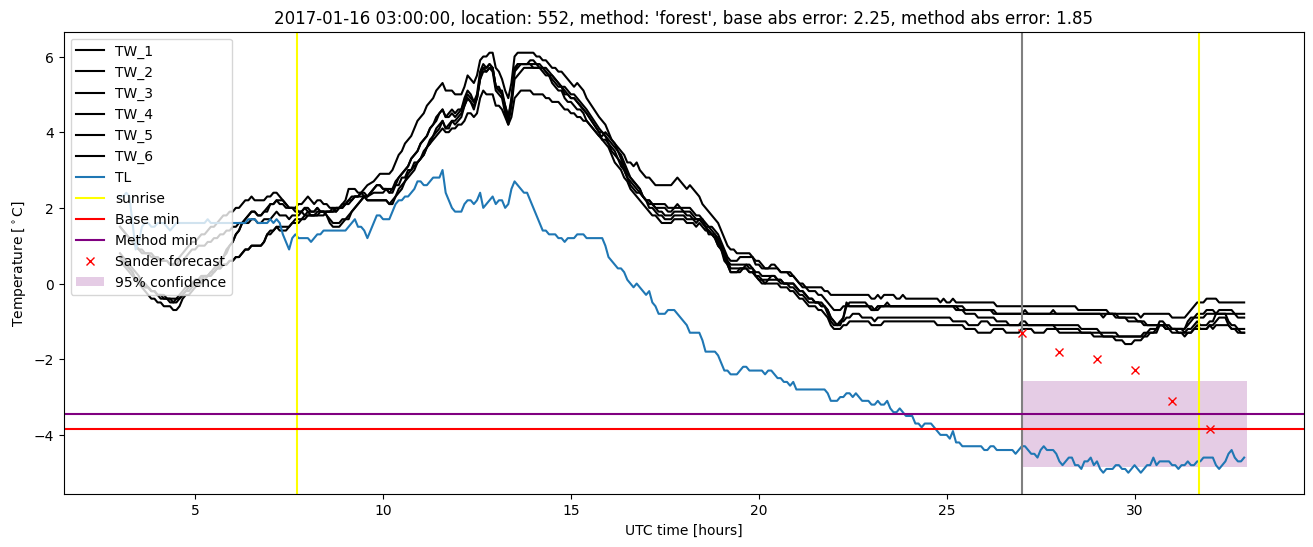
Random forest plots
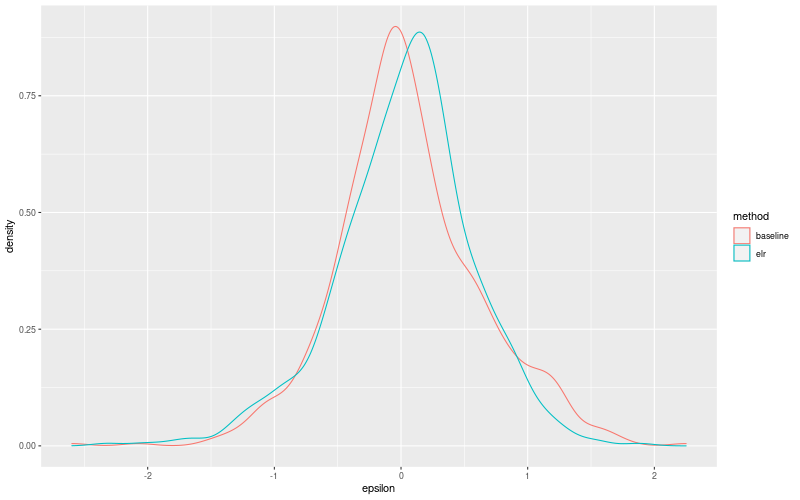
Extended logistic regression results
| names |
period |
power |
significance |
meanSquareError |
absError |
maxError |
CRPS |
IGN |
| baseline |
winter 2016 |
0.994 |
0.000e+00 |
0.335 |
0.423 |
2.599 |
NaN |
NaN |
| elr |
winter 2016 |
1.000 |
0.056 |
0.282 |
0.412 |
2.326 |
0.519 |
4.602 |
| baseline |
winter 2017 |
0.967 |
0.000e+00 |
0.382 |
0.456 |
2.251 |
NaN |
NaN |
| elr |
winter 2017 |
0.967 |
0.000e+00 |
0.297 |
0.418 |
1.879 |
0.522 |
3.979 |
| baseline |
winter 2018 |
0.986 |
0.095 |
0.306 |
0.417 |
2.077 |
NaN |
NaN |
| elr |
winter 2018 |
0.993 |
0.048 |
0.255 |
0.374 |
2.046 |
0.514 |
3.646 |
| baseline |
winter 2019 |
0.985 |
0.111 |
0.305 |
0.420 |
1.662 |
NaN |
NaN |
| elr |
winter 2019 |
0.993 |
0.111 |
0.355 |
0.458 |
1.841 |
0.510 |
4.106 |
| baseline |
all |
0.985 |
0.037 |
0.332 |
0.429 |
2.599 |
NaN |
NaN |
| elr |
all |
0.990 |
0.037 |
0.294 |
0.414 |
2.326 |
0.516 |
4.109 |
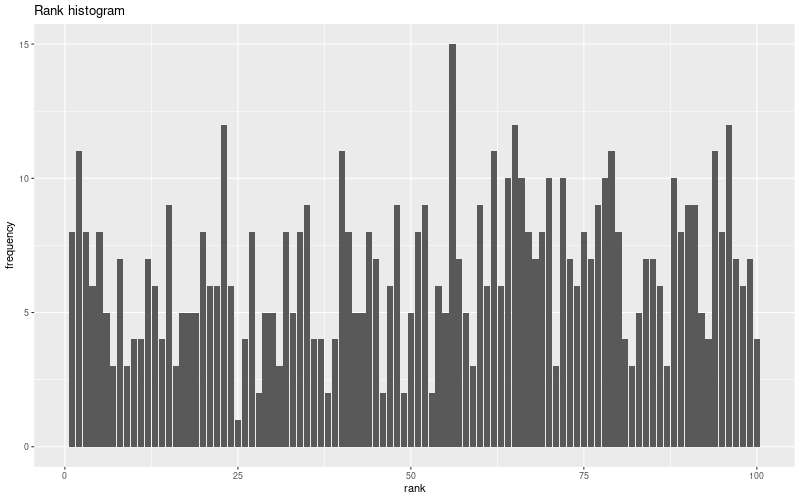
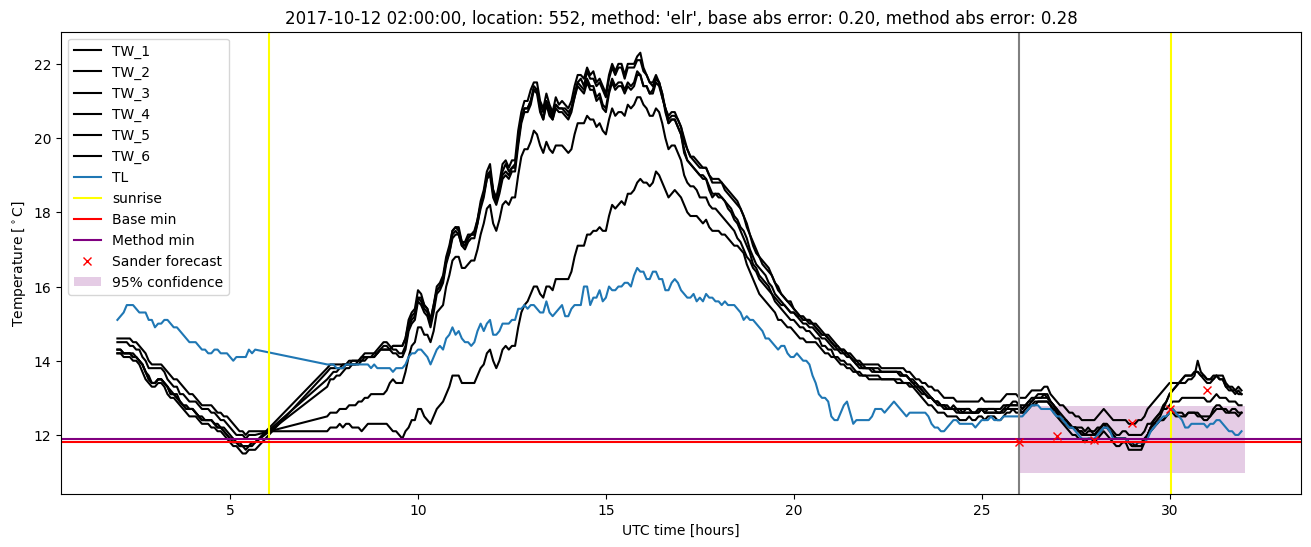
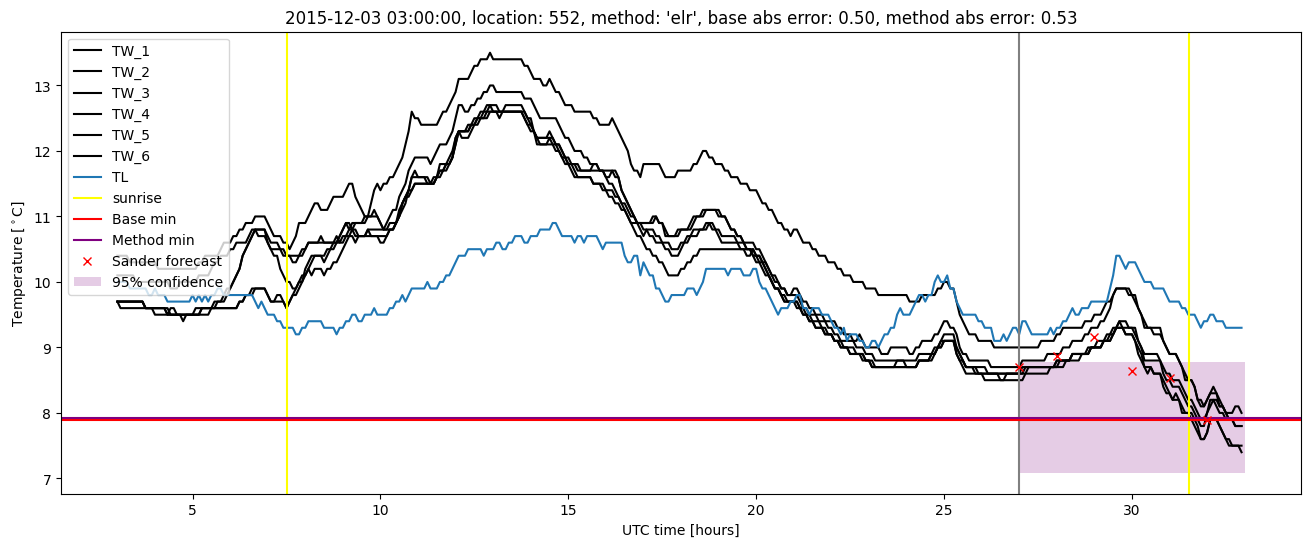
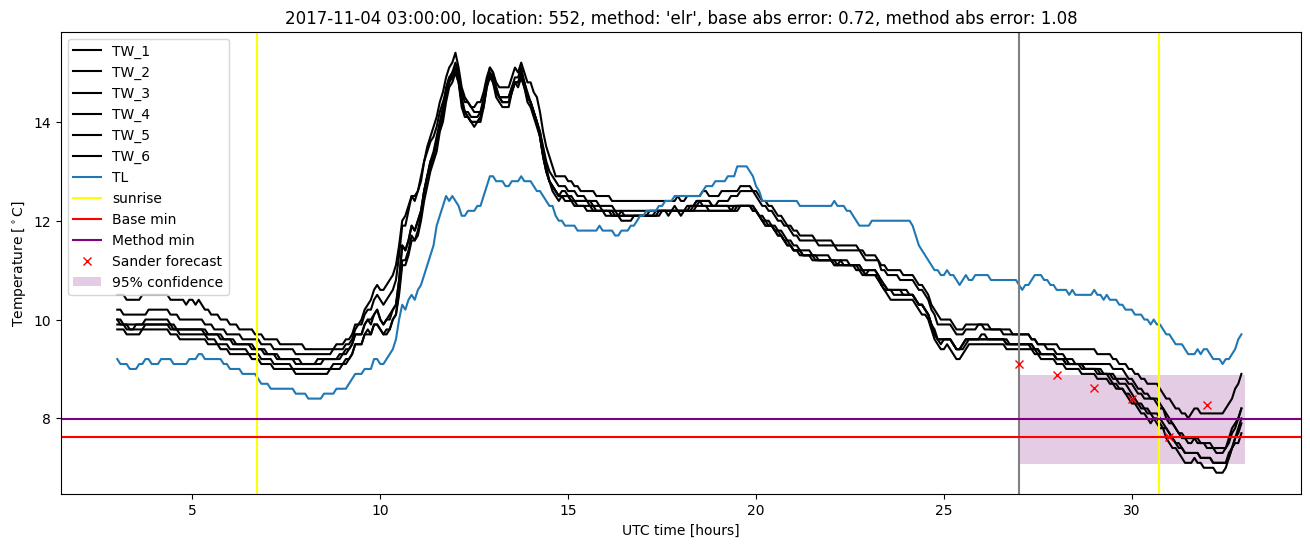
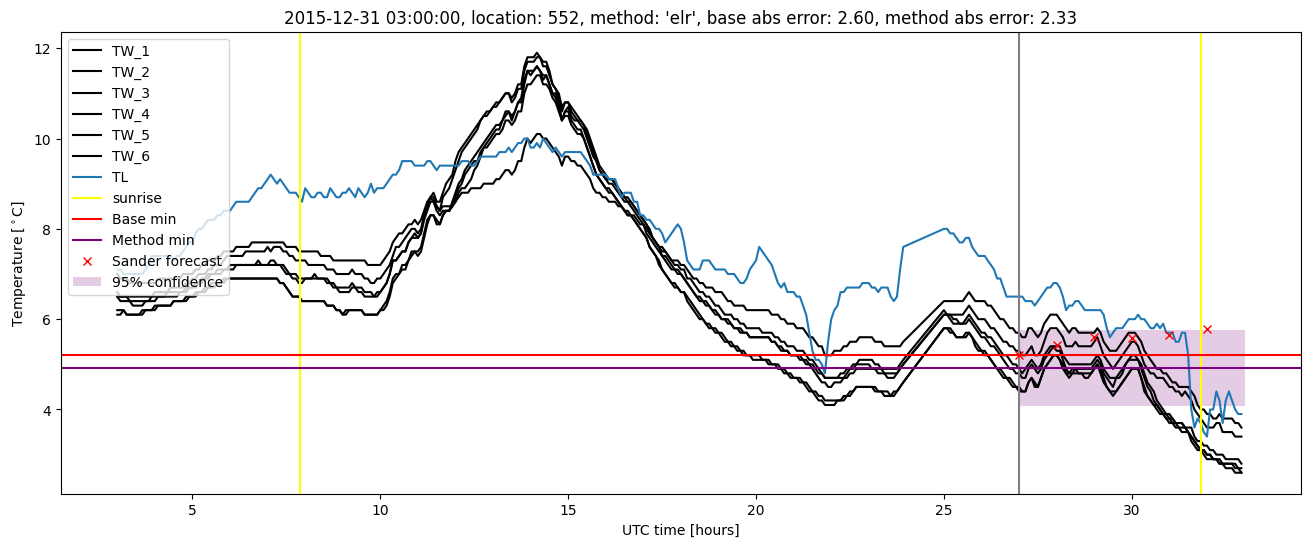
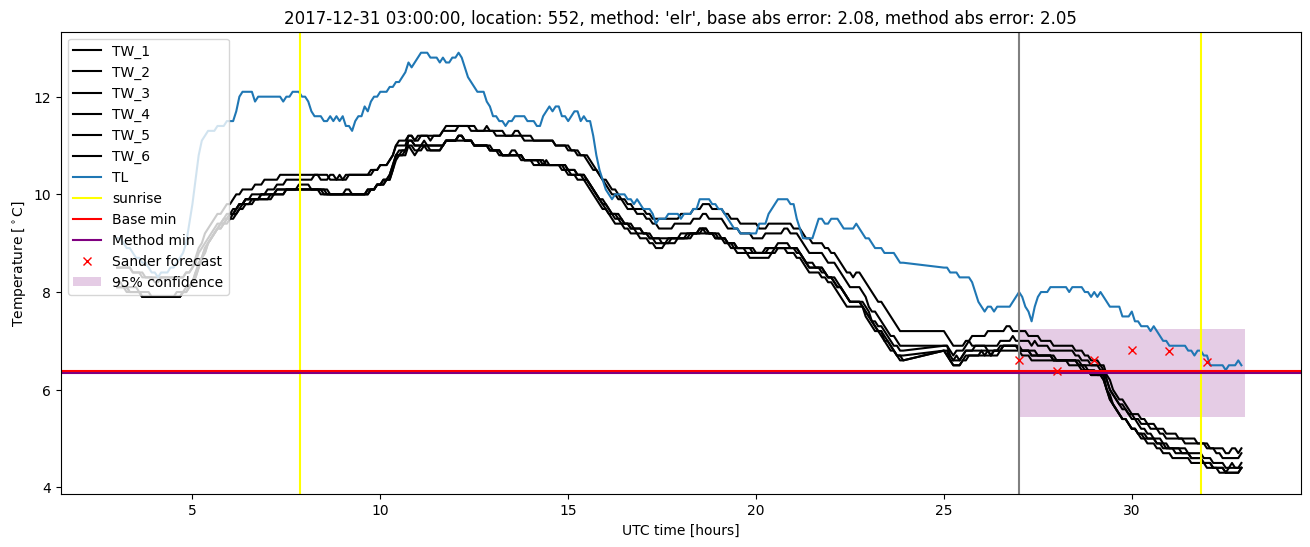
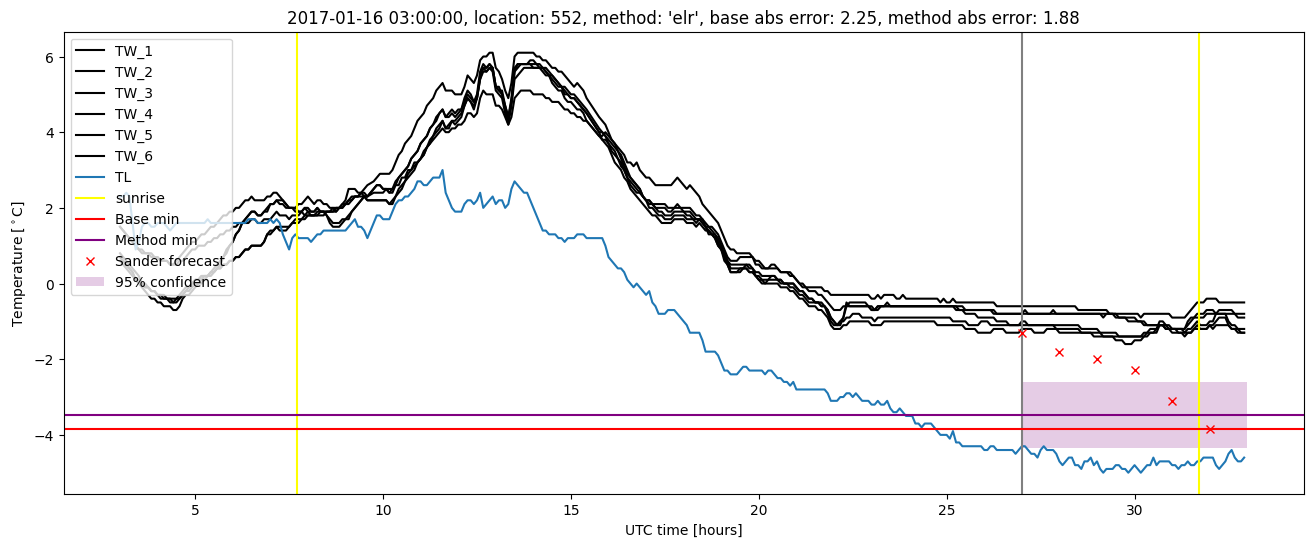
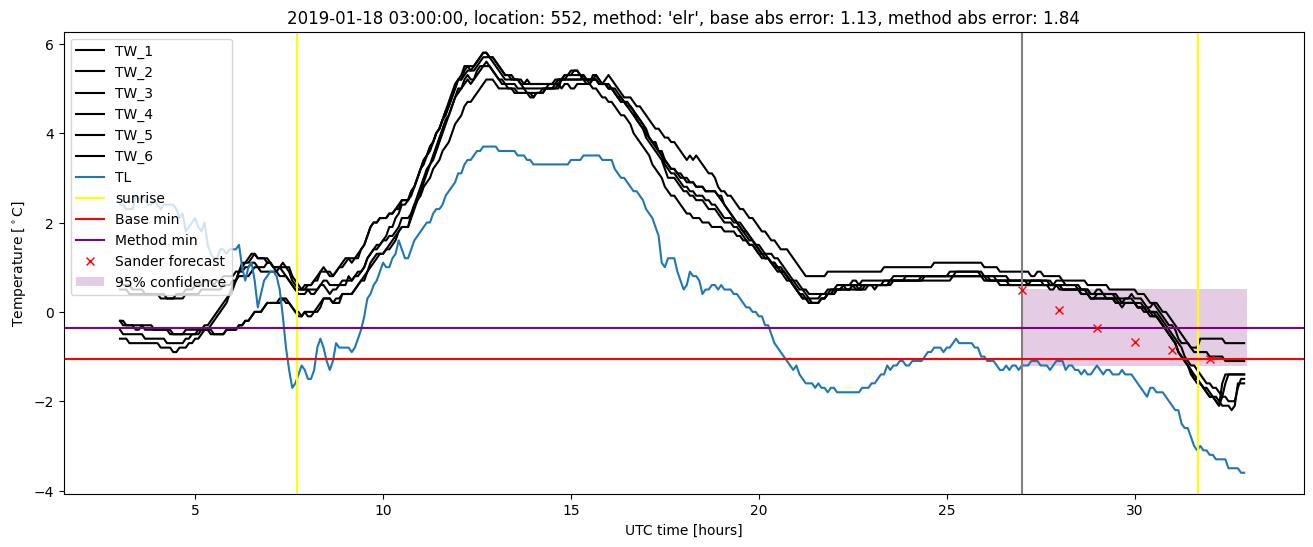
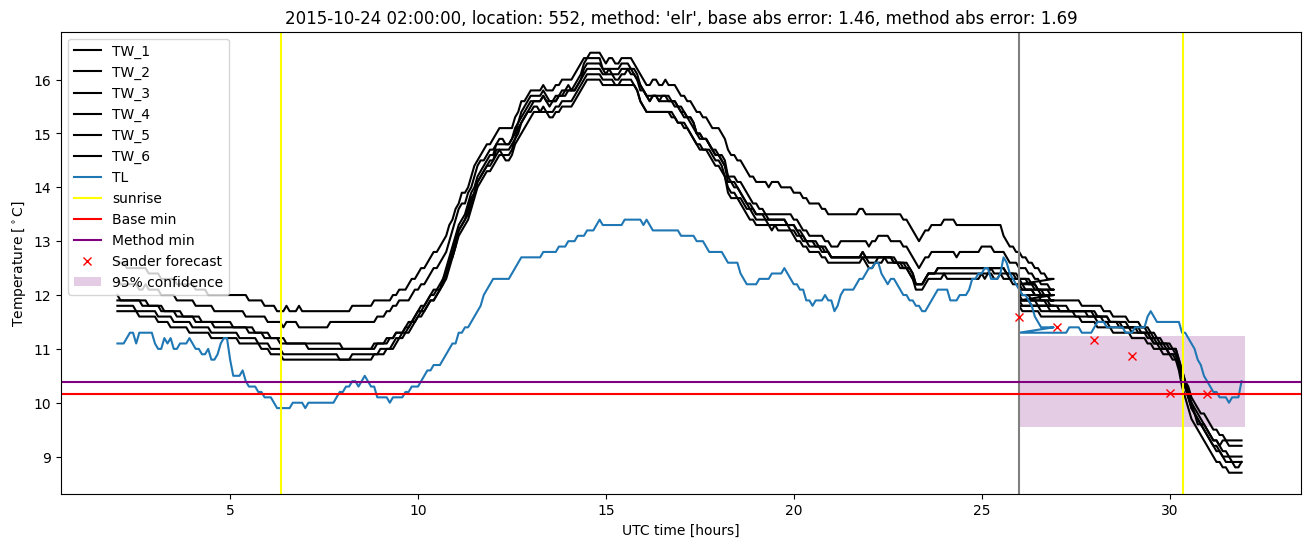
Extended logistic regression plots