GMS location: 551
Random forest results
| names |
period |
power |
significance |
meanSquareError |
absError |
maxError |
CRPS |
IGN |
| baseline |
winter 2016 |
0.995 |
0.059 |
0.353 |
0.457 |
1.985 |
NaN |
NaN |
| forest |
winter 2016 |
0.995 |
0.235 |
0.277 |
0.406 |
1.914 |
0.476 |
5.157 |
| baseline |
winter 2017 |
0.961 |
0.000e+00 |
0.357 |
0.438 |
2.119 |
NaN |
NaN |
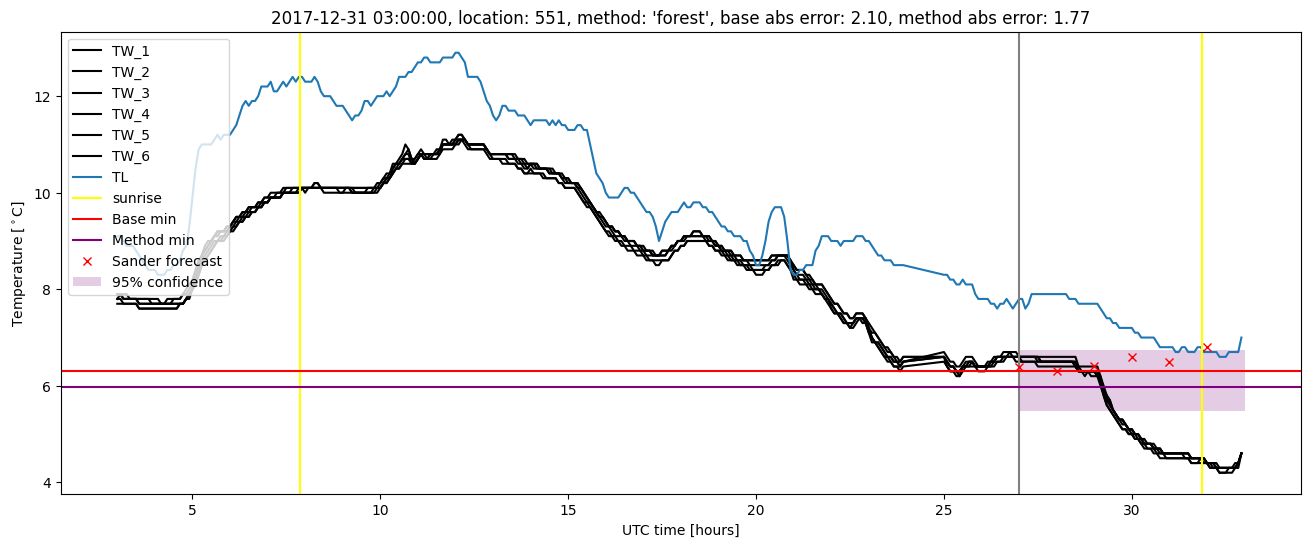
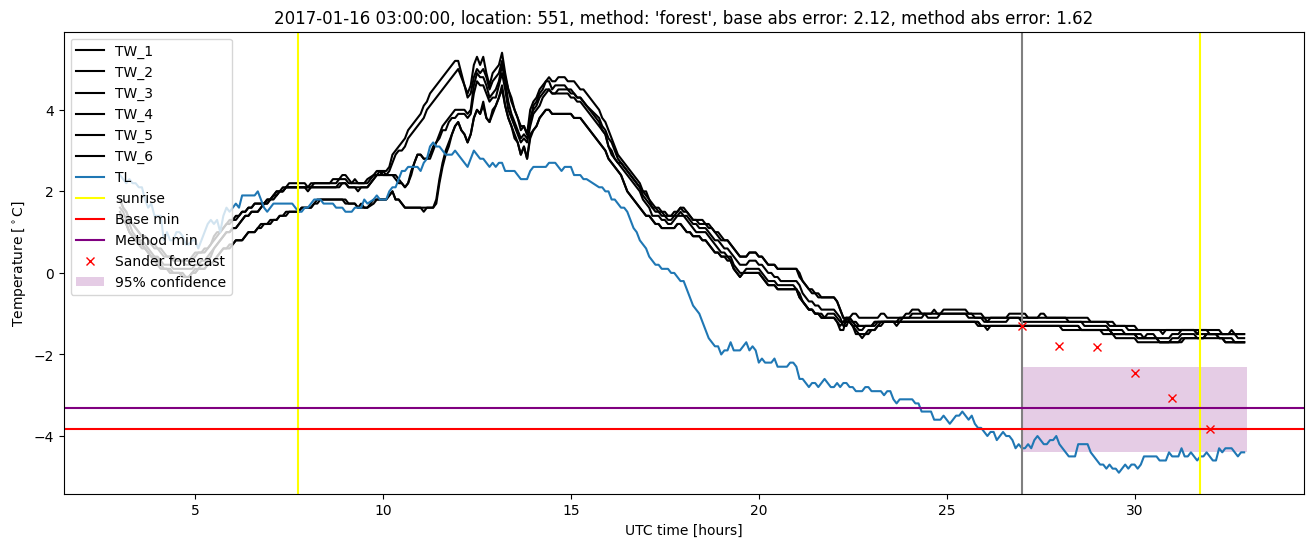
| forest |
winter 2017 |
0.984 |
0.000e+00 |
0.240 |
0.364 |
1.617 |
0.480 |
4.310 |
| baseline |
winter 2018 |
0.987 |
0.040 |
0.321 |
0.423 |
2.533 |
NaN |
NaN |
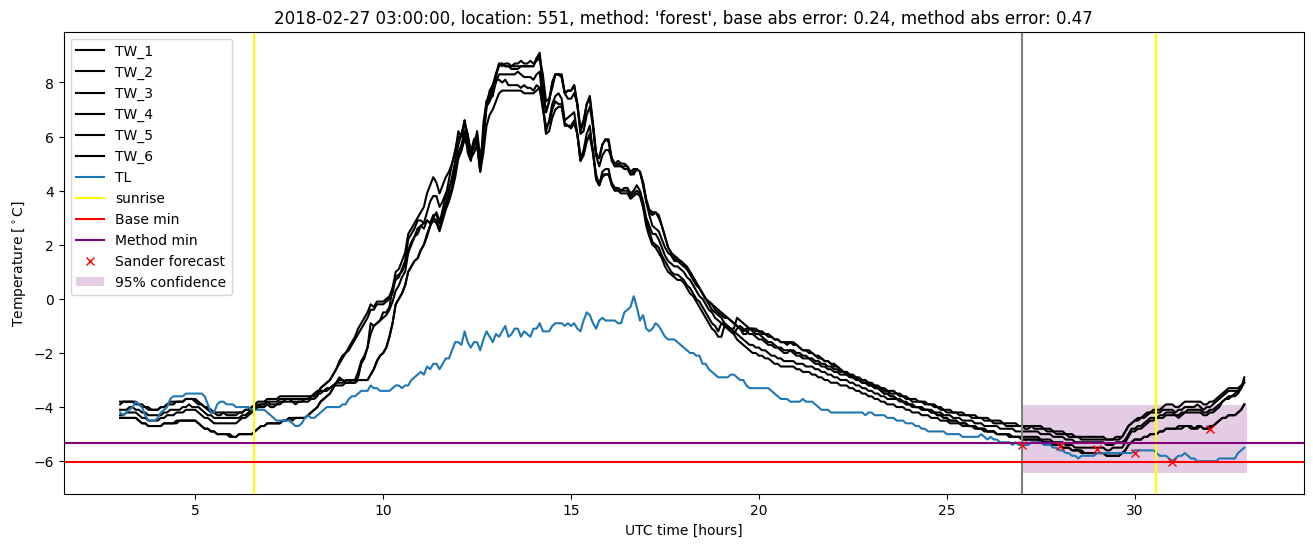
| forest |
winter 2018 |
0.987 |
0.040 |
0.248 |
0.362 |
2.685 |
0.488 |
3.508 |
| baseline |
winter 2019 |
0.986 |
0.000e+00 |
0.251 |
0.392 |
1.435 |
NaN |
NaN |
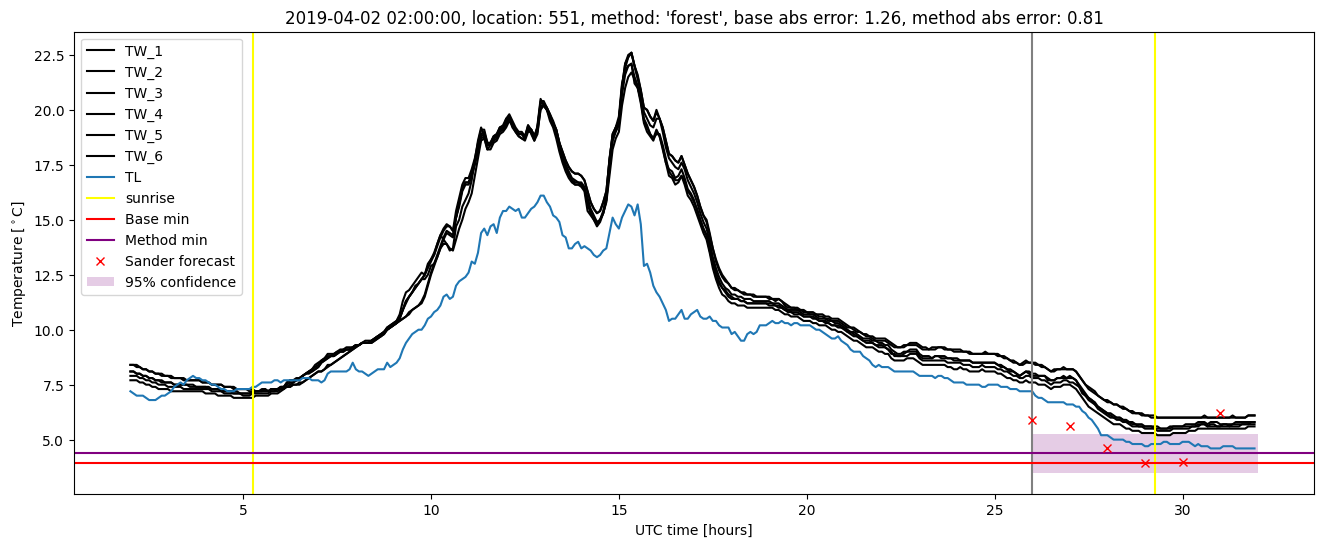
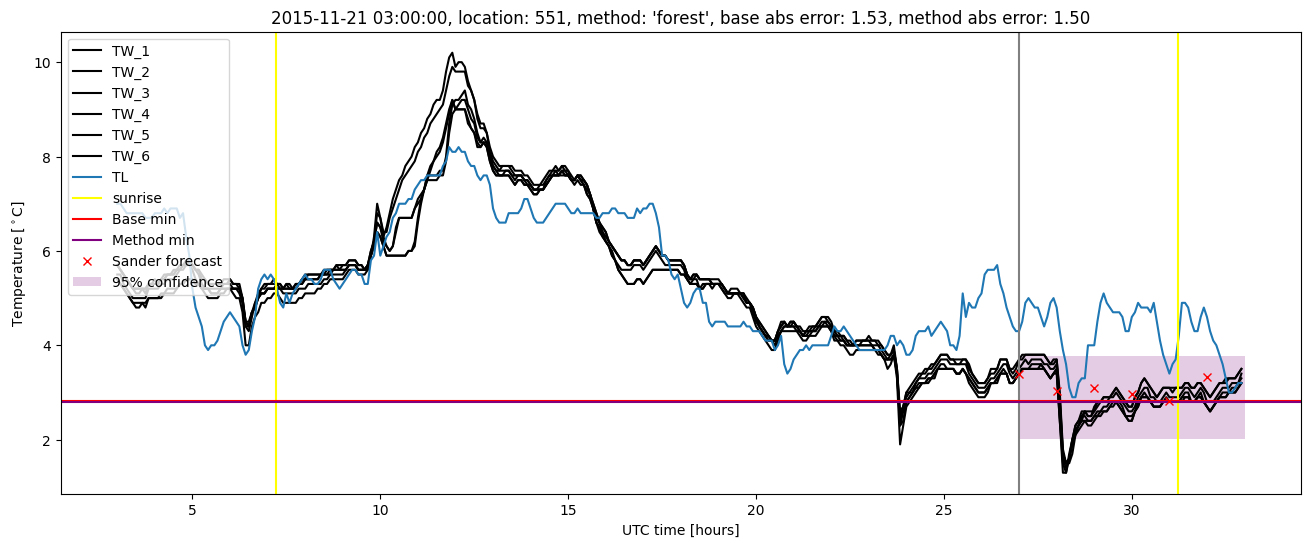
| forest |
winter 2019 |
0.993 |
0.000e+00 |
0.213 |
0.365 |
1.410 |
0.466 |
4.100 |
| baseline |
all |
0.984 |
0.026 |
0.323 |
0.430 |
2.533 |
NaN |
NaN |
| forest |
all |
0.990 |
0.065 |
0.247 |
0.376 |
2.685 |
0.478 |
4.312 |
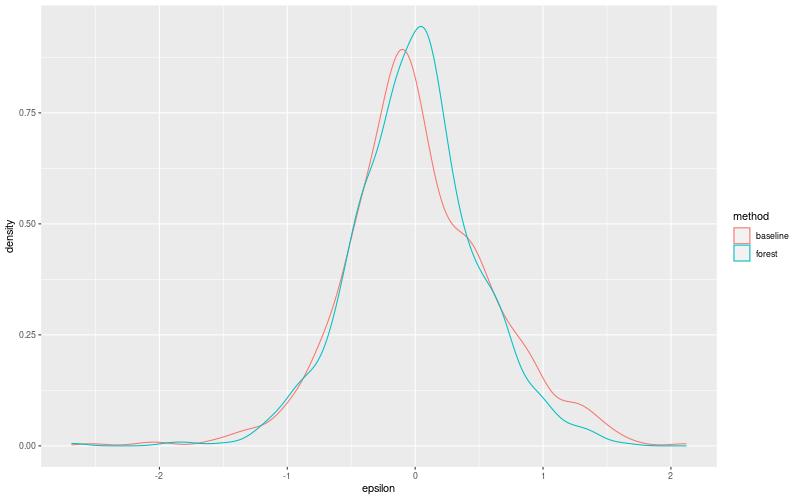
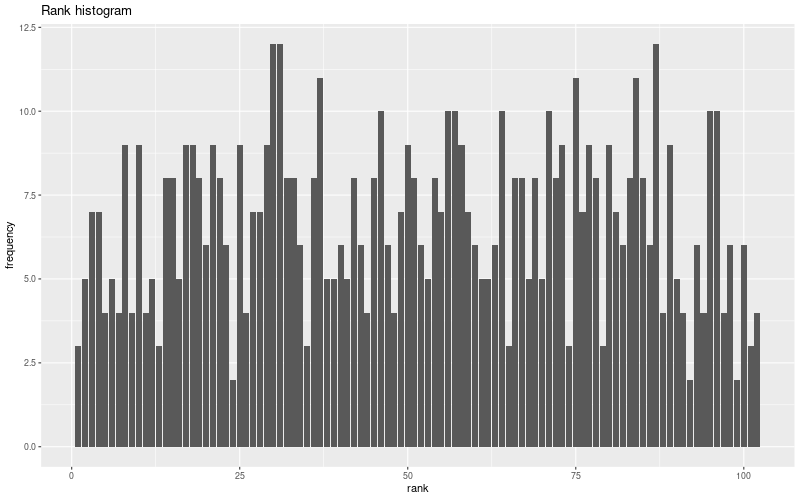
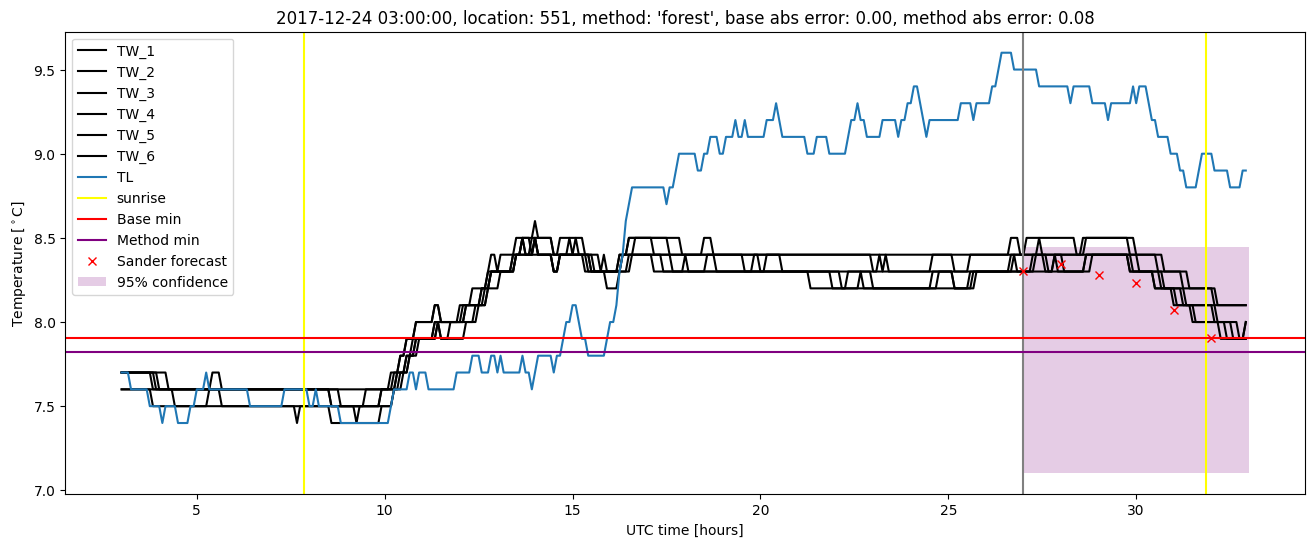
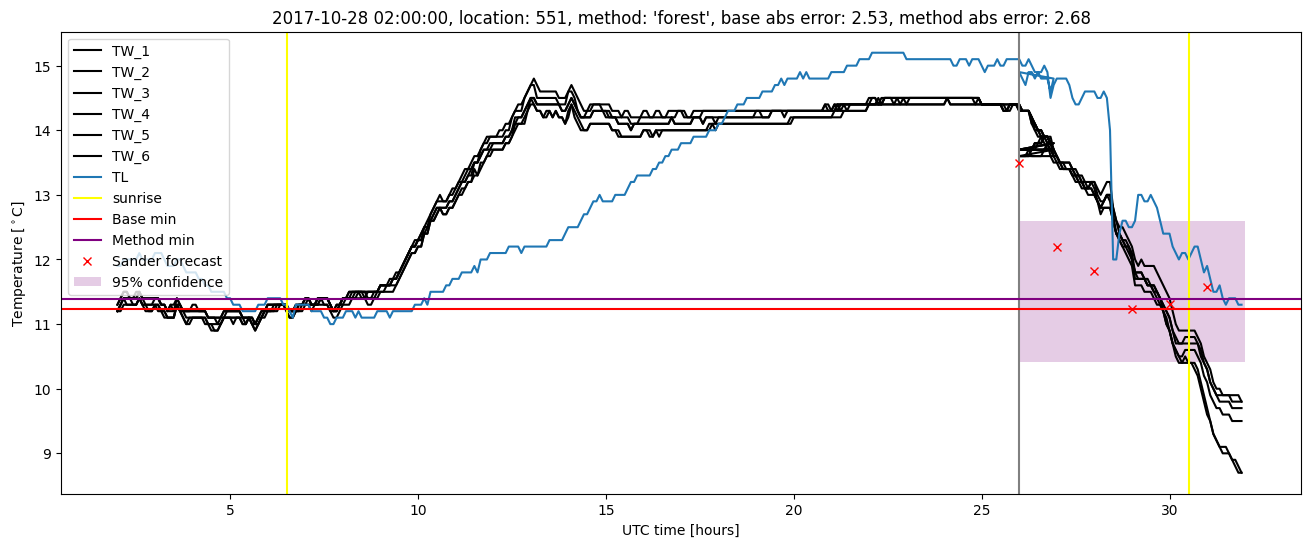
Random forest plots

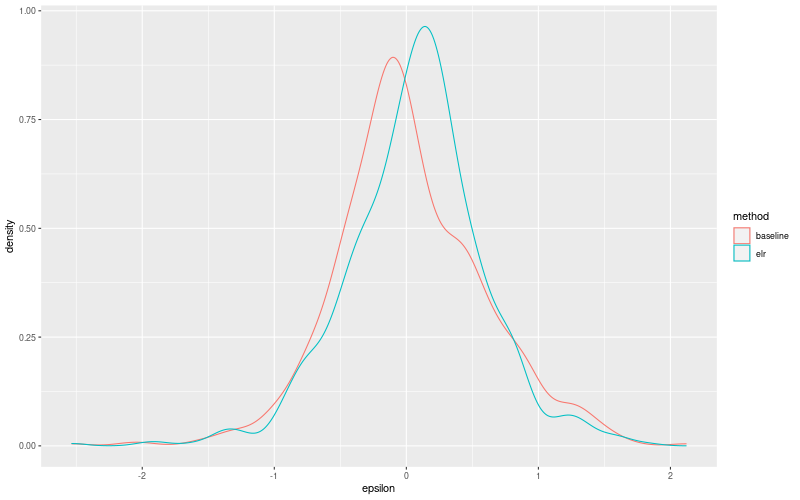
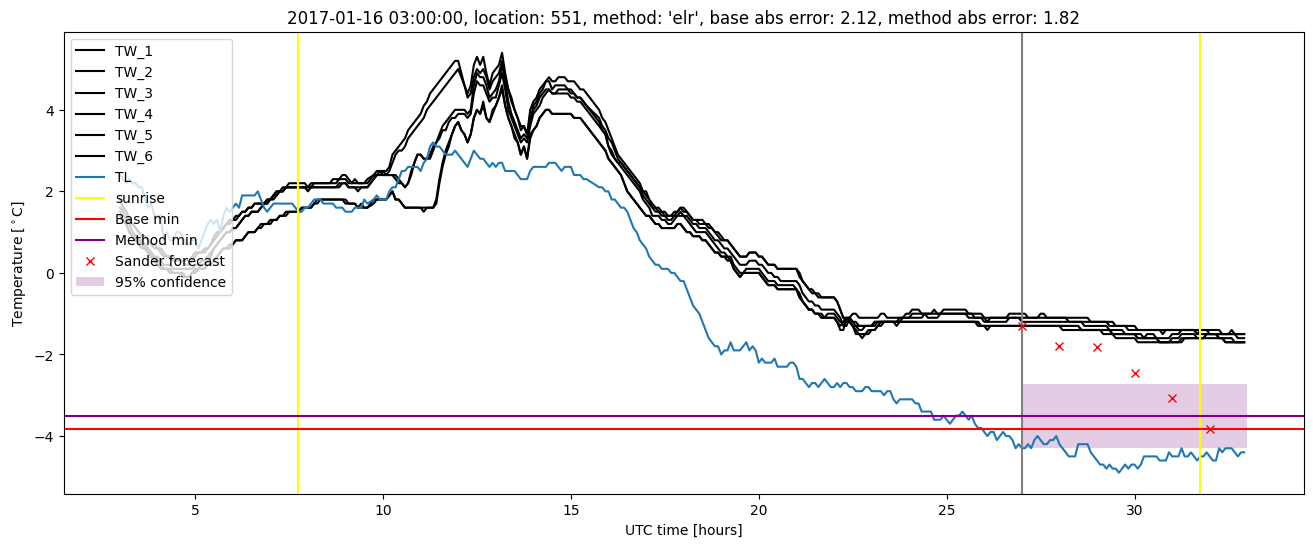
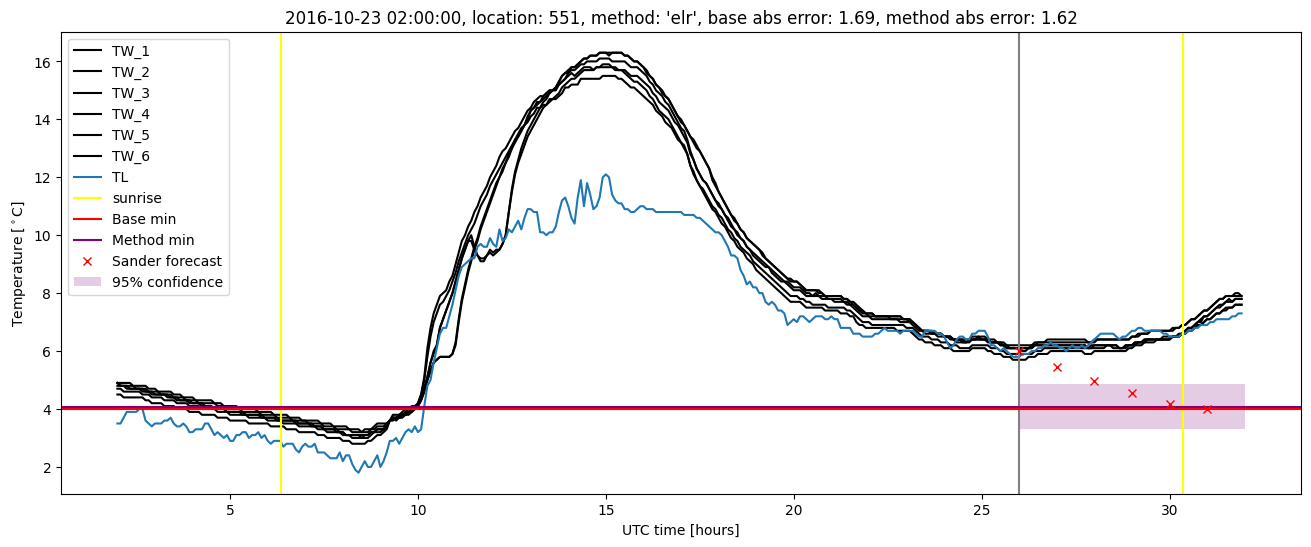
Extended logistic regression results
| names |
period |
power |
significance |
meanSquareError |
absError |
maxError |
CRPS |
IGN |
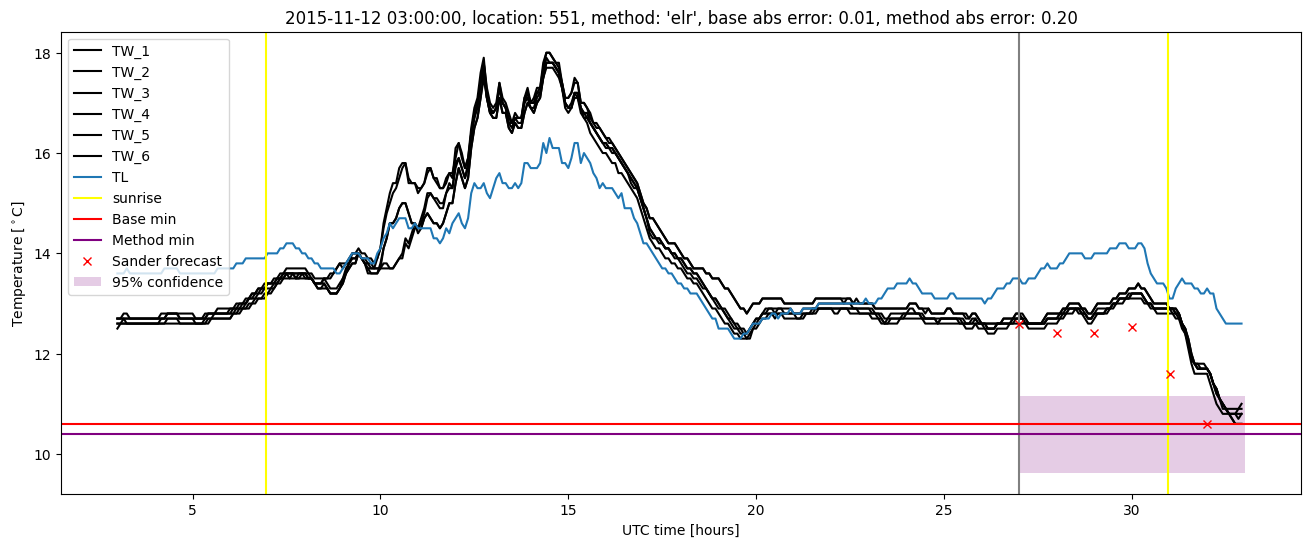
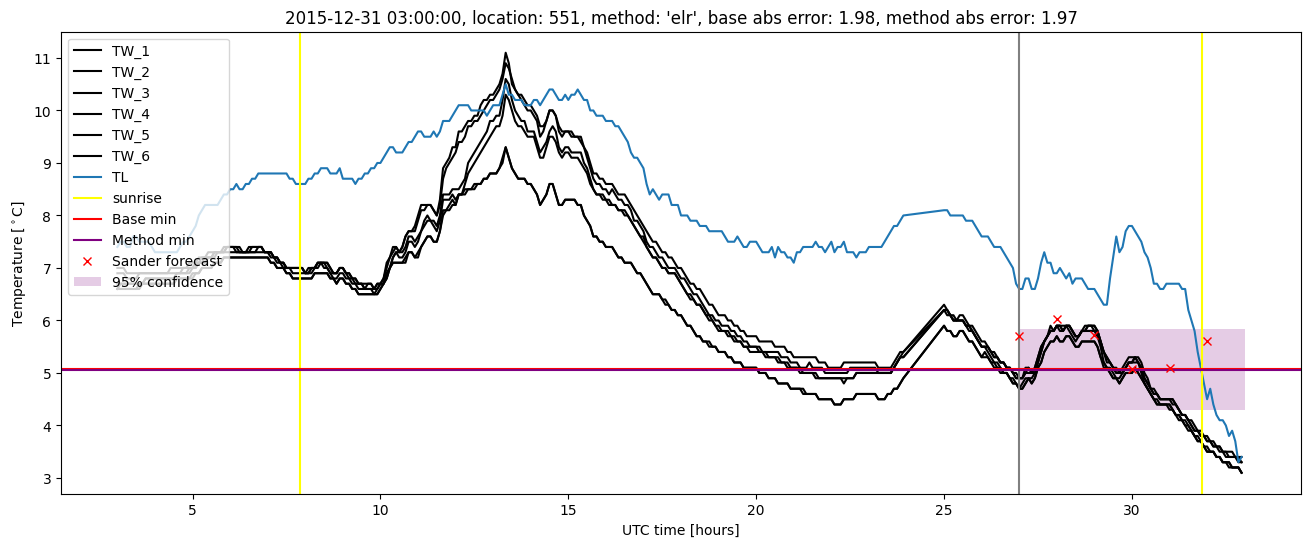
| baseline |
winter 2016 |
0.995 |
0.059 |
0.353 |
0.457 |
1.985 |
NaN |
NaN |
| elr |
winter 2016 |
0.995 |
0.118 |
0.288 |
0.404 |
1.966 |
0.565 |
7.555 |
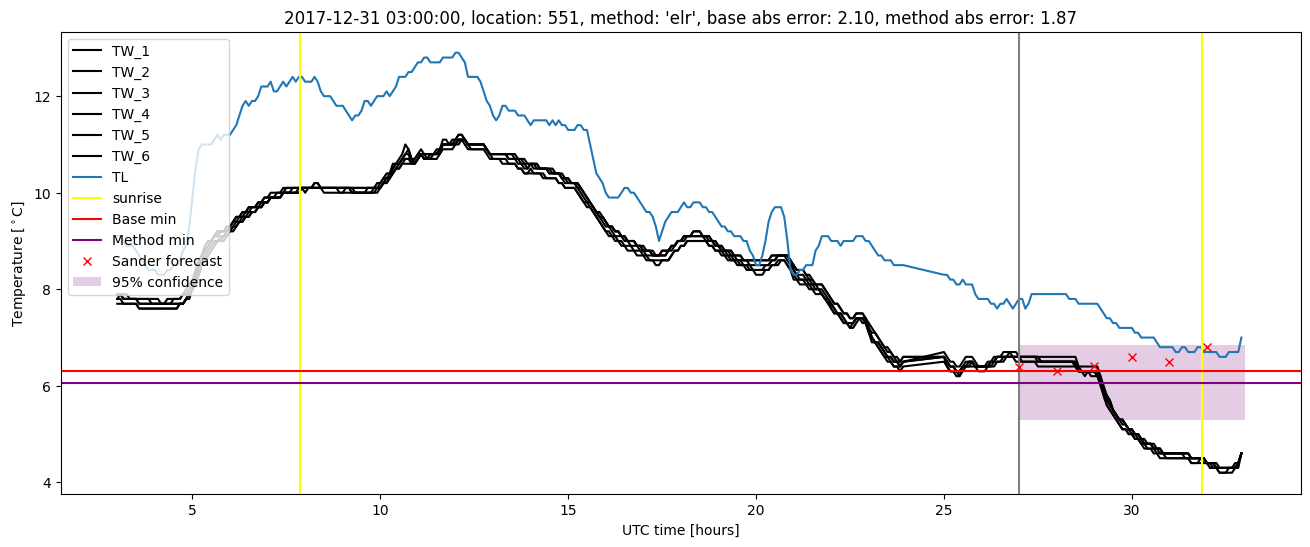
| baseline |
winter 2017 |
0.961 |
0.000e+00 |
0.357 |
0.438 |
2.119 |
NaN |
NaN |
| elr |
winter 2017 |
0.976 |
0.000e+00 |
0.301 |
0.415 |
1.819 |
0.560 |
6.822 |
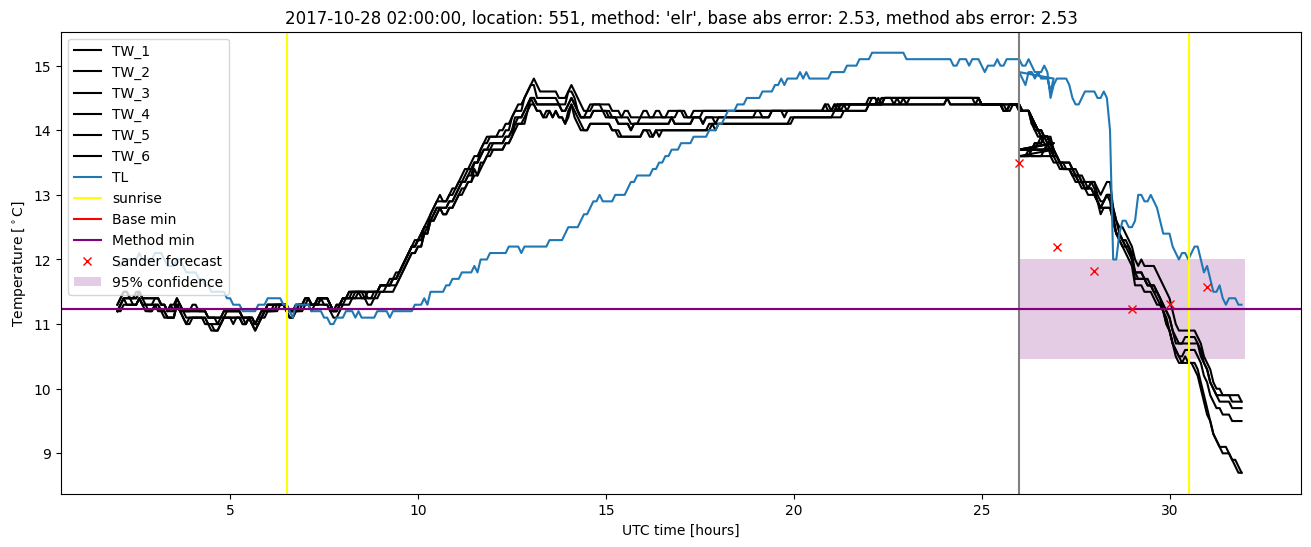
| baseline |
winter 2018 |
0.987 |
0.040 |
0.321 |
0.423 |
2.533 |
NaN |
NaN |
| elr |
winter 2018 |
0.987 |
0.040 |
0.281 |
0.394 |
2.533 |
0.557 |
6.861 |
| baseline |
winter 2019 |
0.986 |
0.000e+00 |
0.251 |
0.392 |
1.435 |
NaN |
NaN |
| elr |
winter 2019 |
0.993 |
0.000e+00 |
0.236 |
0.377 |
1.601 |
0.588 |
6.978 |
| baseline |
all |
0.984 |
0.026 |
0.323 |
0.430 |
2.533 |
NaN |
NaN |
| elr |
all |
0.989 |
0.039 |
0.278 |
0.398 |
2.533 |
0.567 |
7.087 |
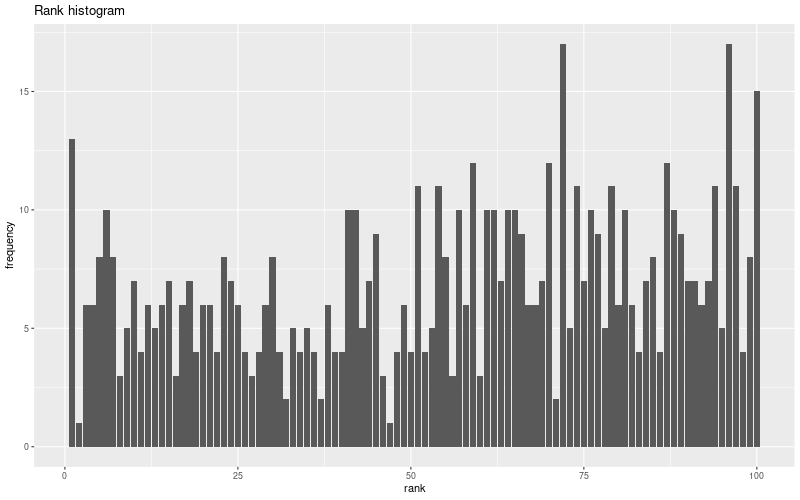
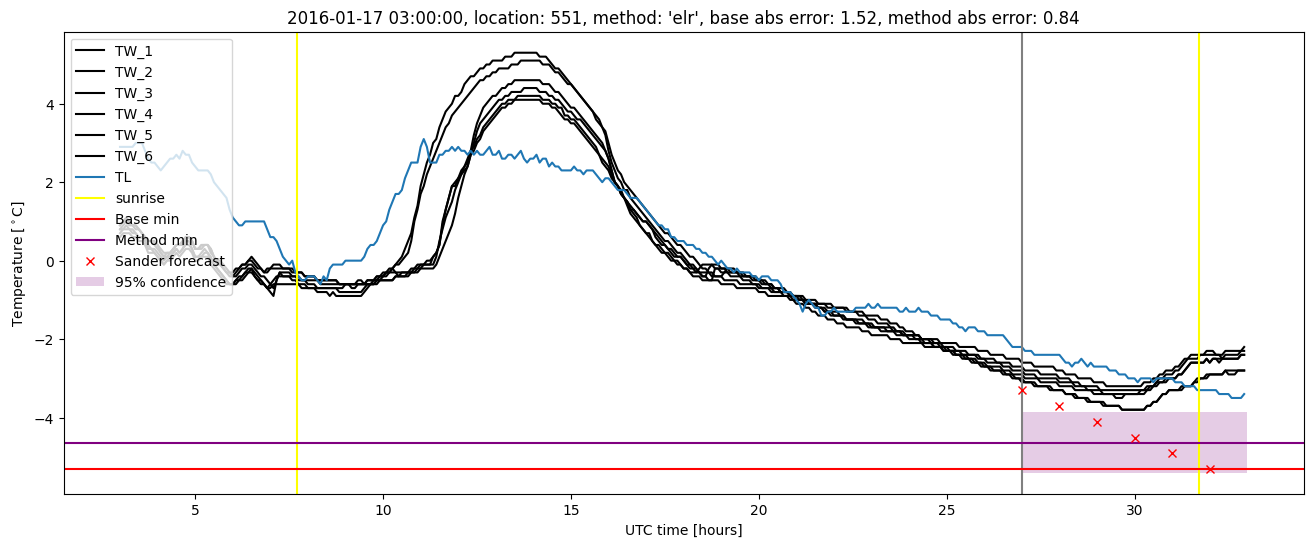
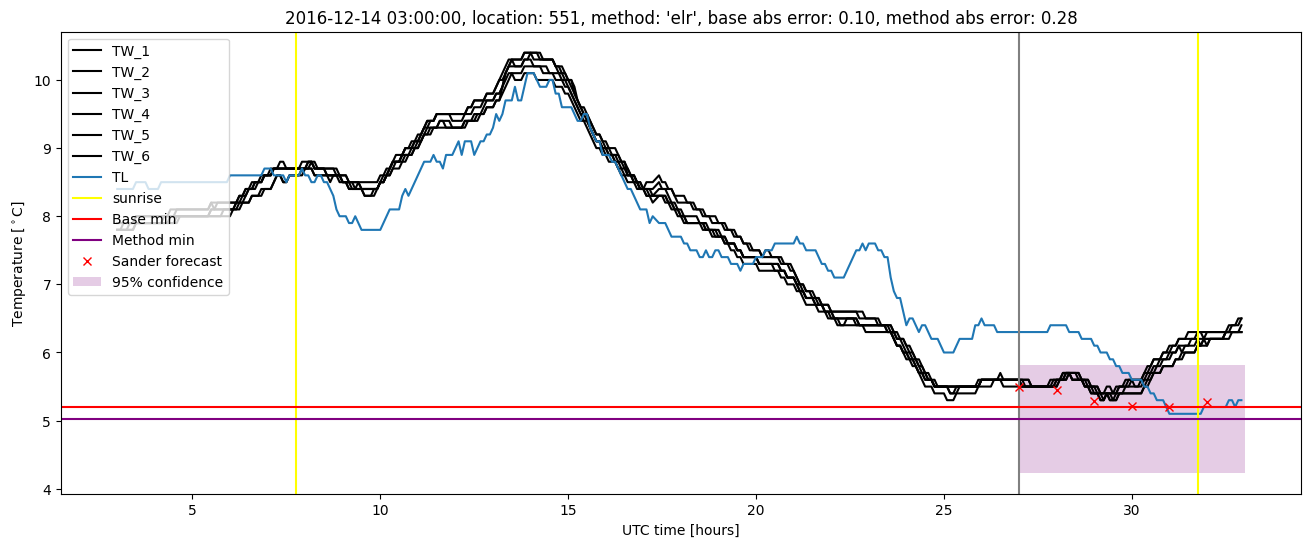
Extended logistic regression plots