GMS location: 535
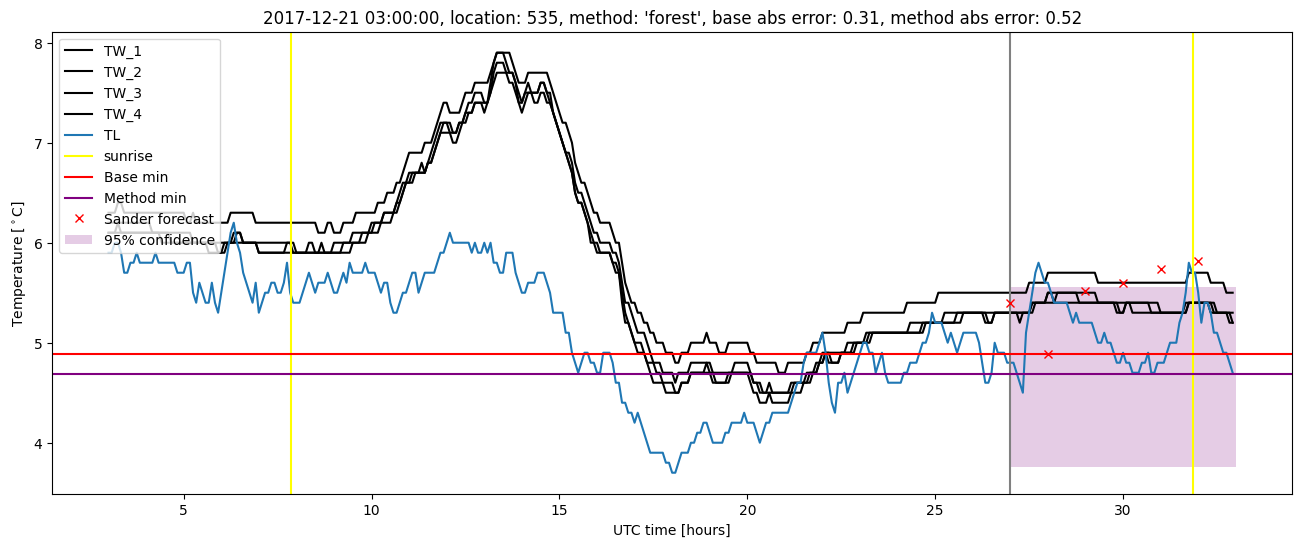
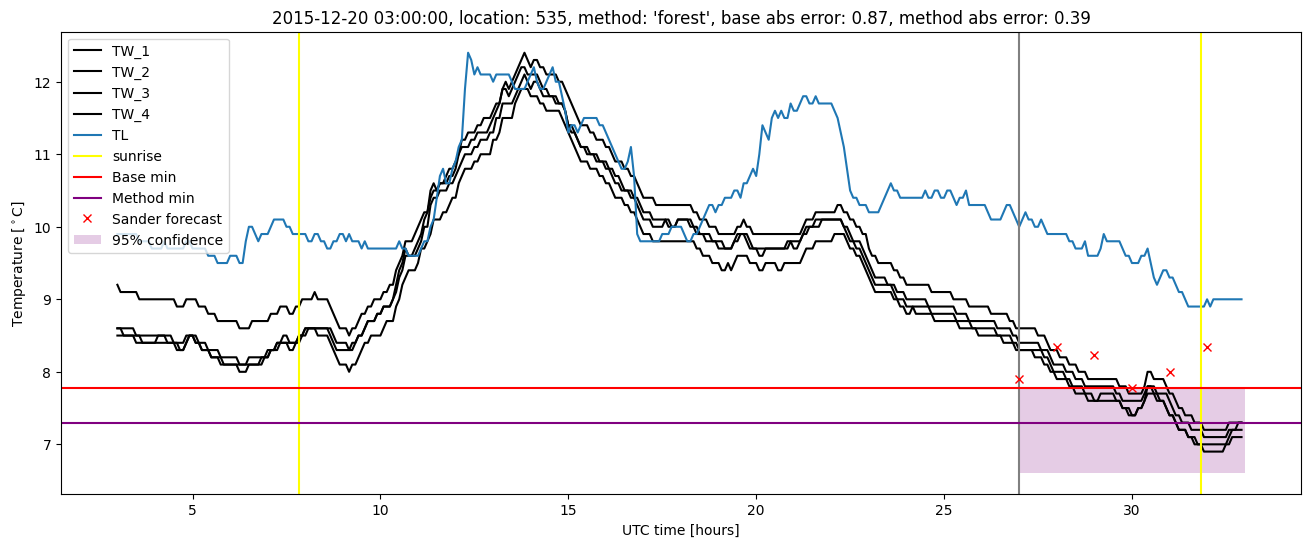
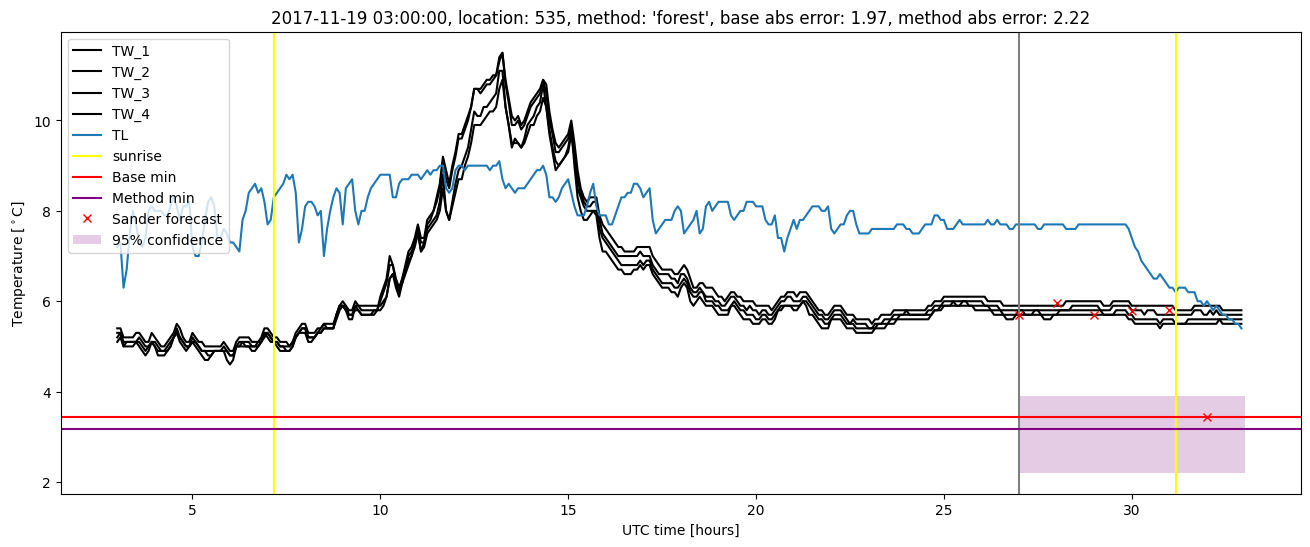
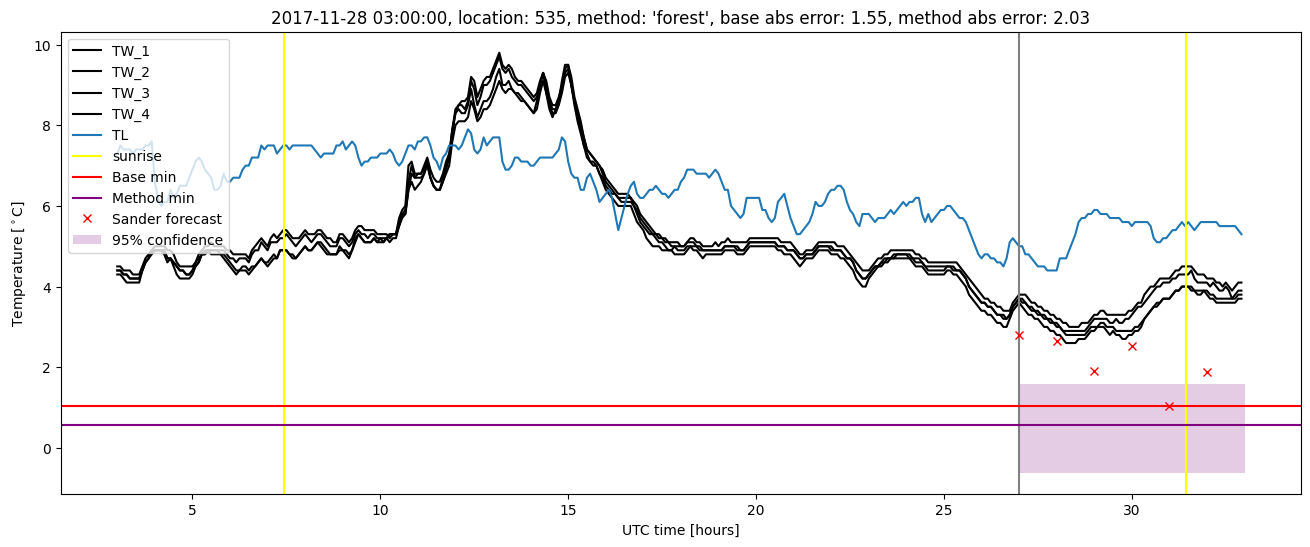
Random forest results
| names |
period |
power |
significance |
meanSquareError |
absError |
maxError |
CRPS |
IGN |
| baseline |
winter 2016 |
0.995 |
0.000e+00 |
0.375 |
0.459 |
1.902 |
NaN |
NaN |
| forest |
winter 2016 |
0.990 |
0.077 |
0.206 |
0.344 |
1.402 |
0.678 |
6.143 |
| baseline |
winter 2017 |
0.992 |
0.080 |
0.358 |
0.447 |
1.948 |
NaN |
NaN |
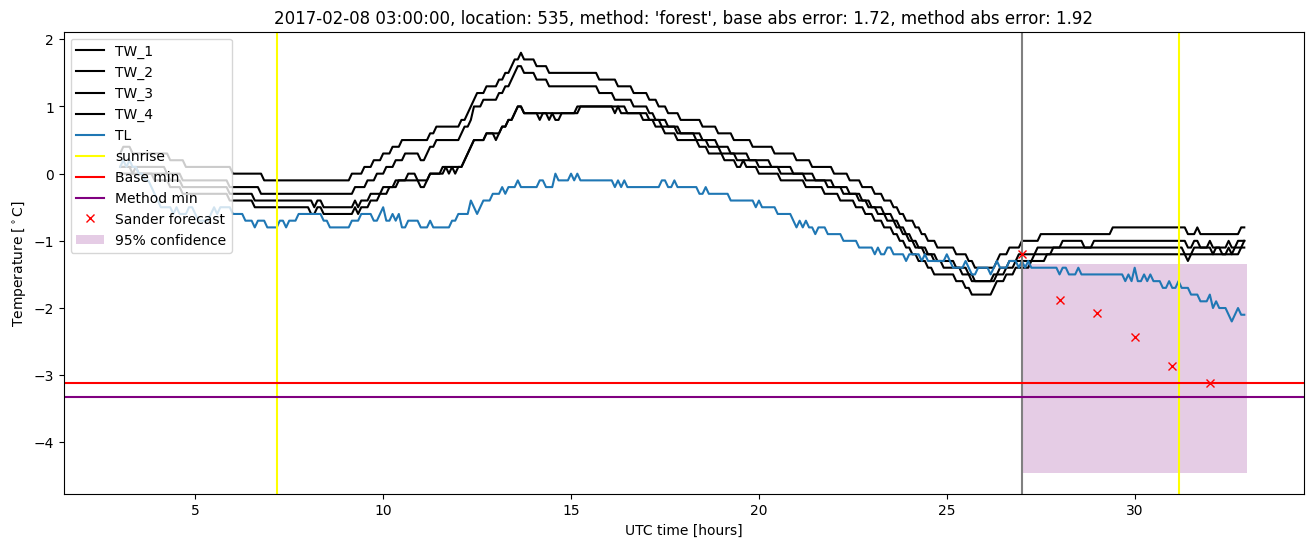
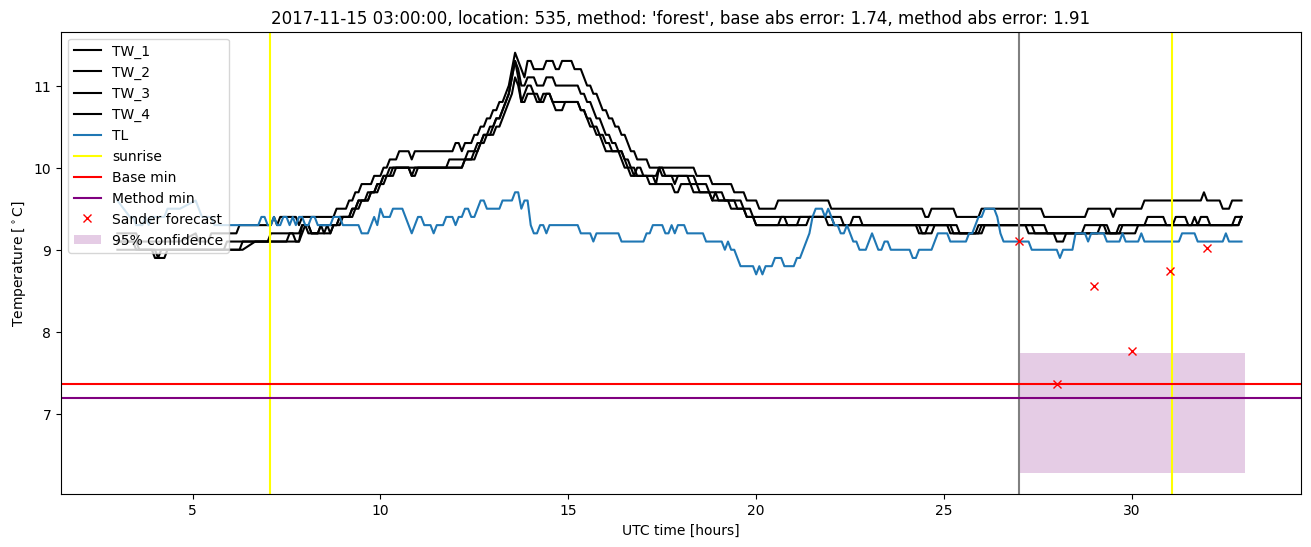
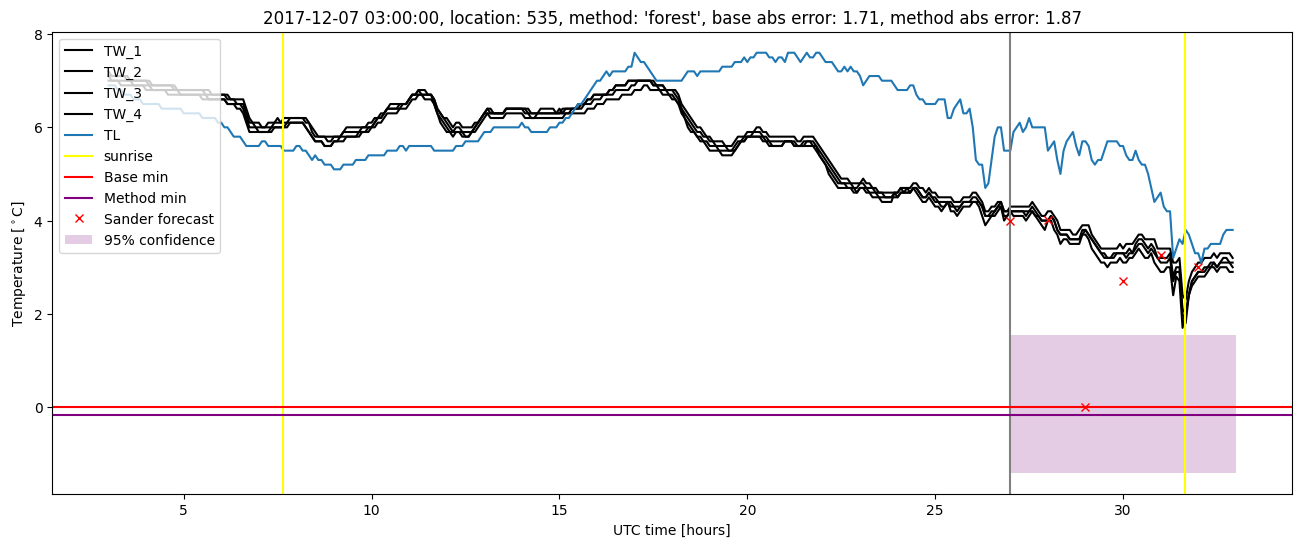
| forest |
winter 2017 |
0.992 |
0.080 |
0.295 |
0.382 |
1.919 |
0.649 |
7.641 |
| baseline |
winter 2018 |
0.993 |
0.095 |
0.423 |
0.466 |
1.971 |
NaN |
NaN |
| forest |
winter 2018 |
0.993 |
0.095 |
0.341 |
0.415 |
2.220 |
0.701 |
7.674 |
| baseline |
winter 2019 |
0.985 |
0.000e+00 |
0.283 |
0.402 |
2.149 |
NaN |
NaN |
| forest |
winter 2019 |
0.985 |
0.000e+00 |
0.164 |
0.287 |
1.659 |
0.684 |
5.892 |
| baseline |
all |
0.992 |
0.059 |
0.363 |
0.446 |
2.149 |
NaN |
NaN |
| forest |
all |
0.990 |
0.073 |
0.251 |
0.358 |
2.220 |
0.678 |
6.811 |
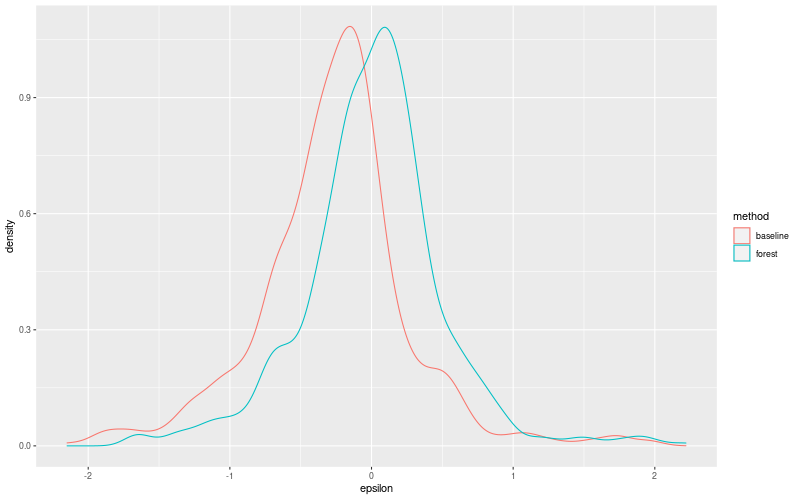
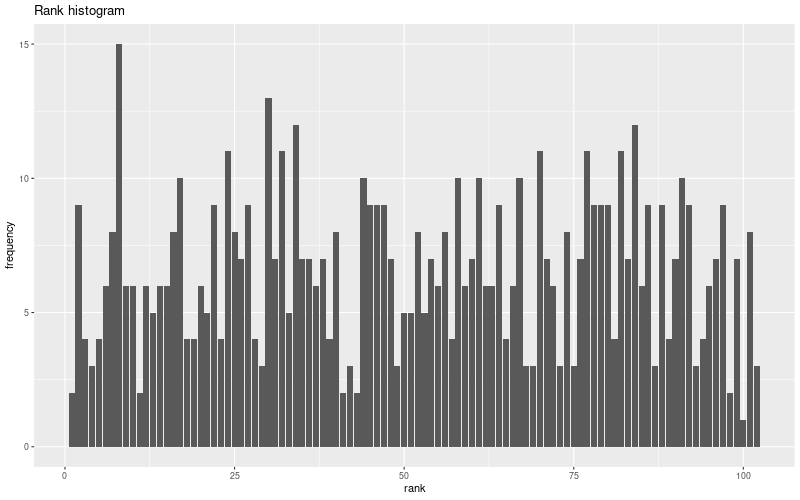
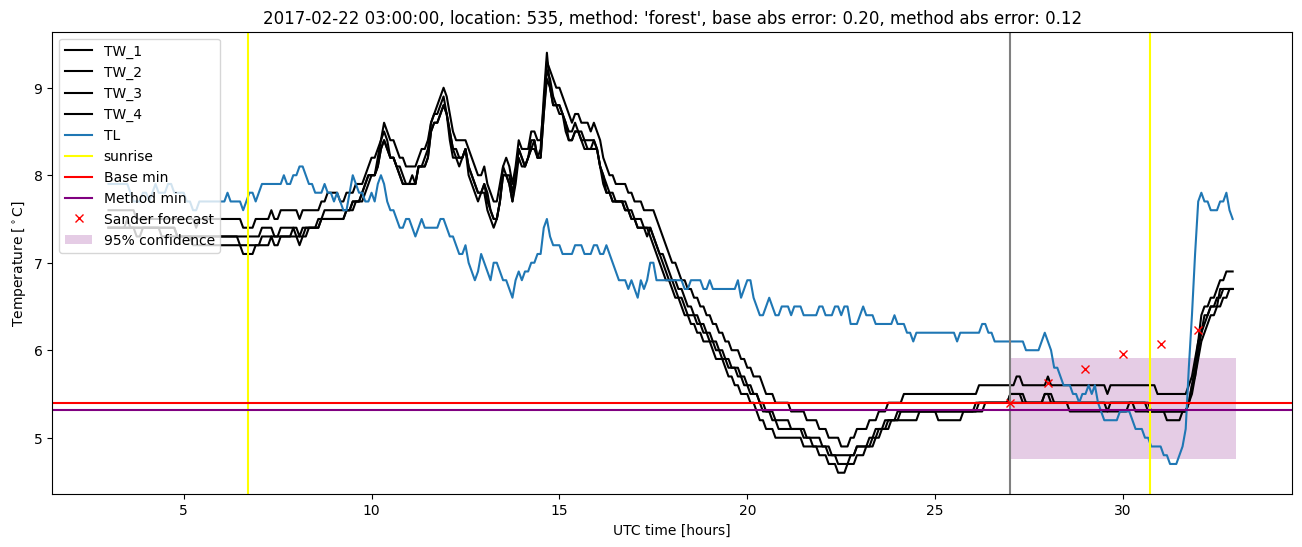
Random forest plots
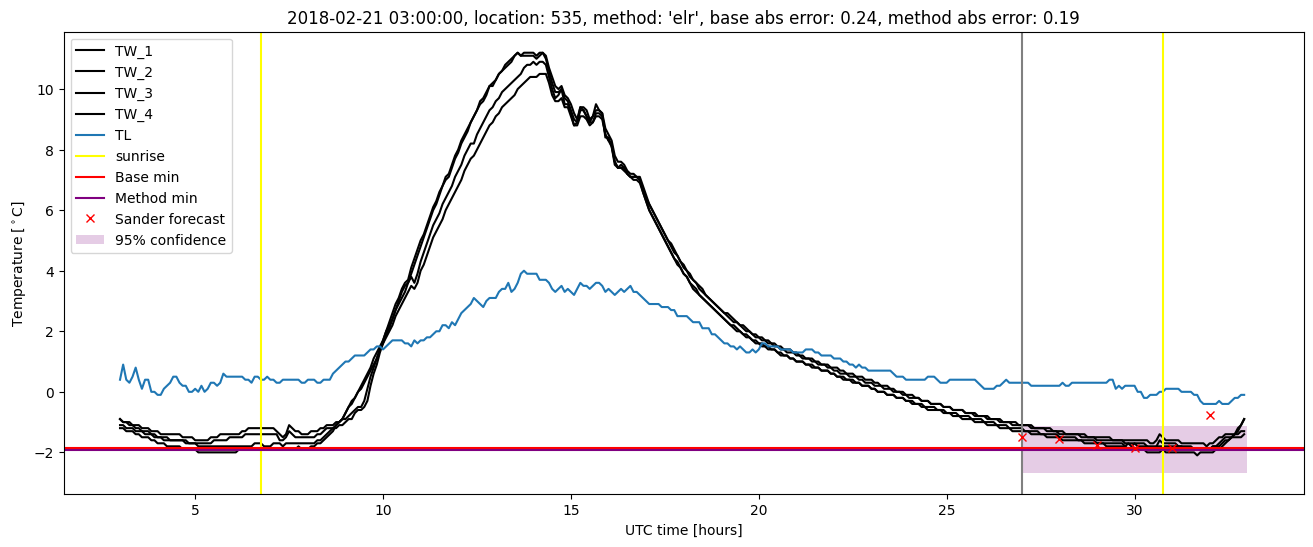
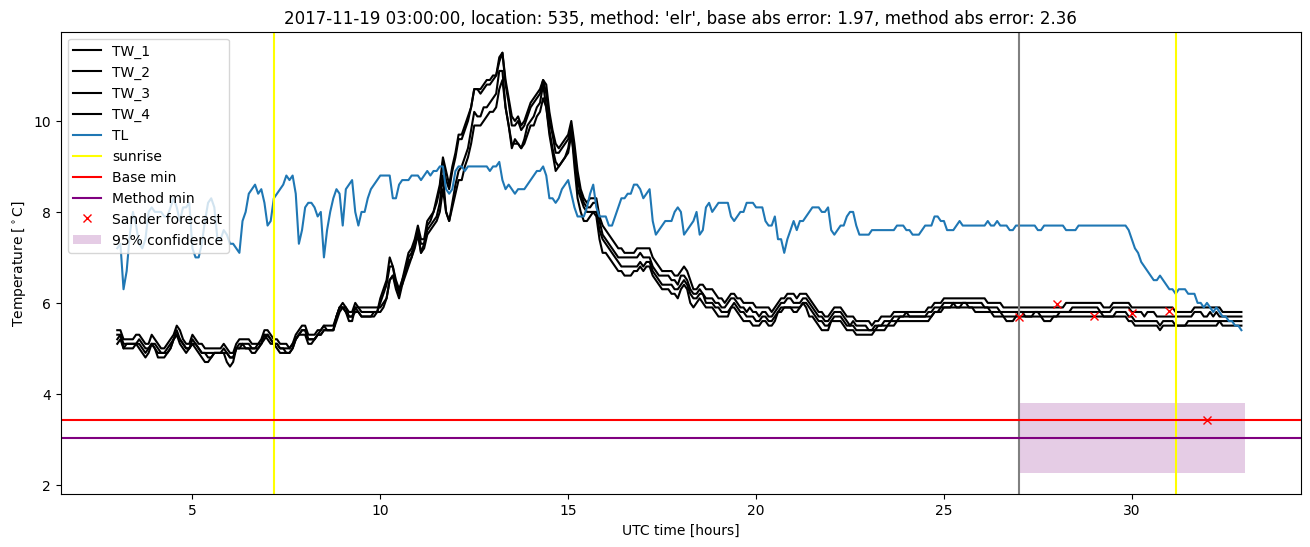
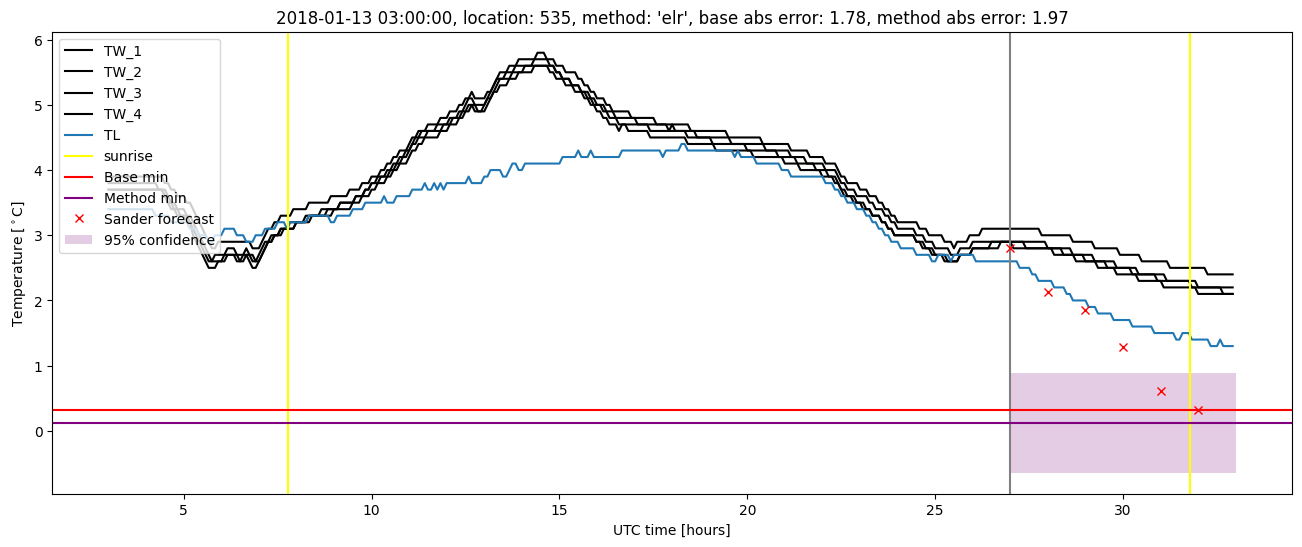
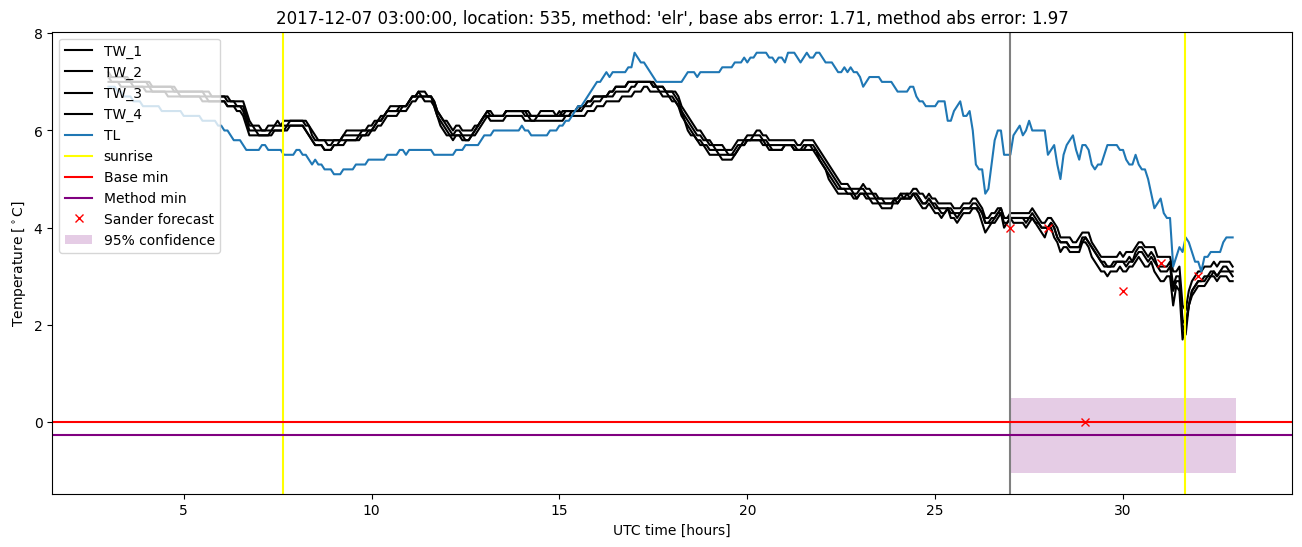
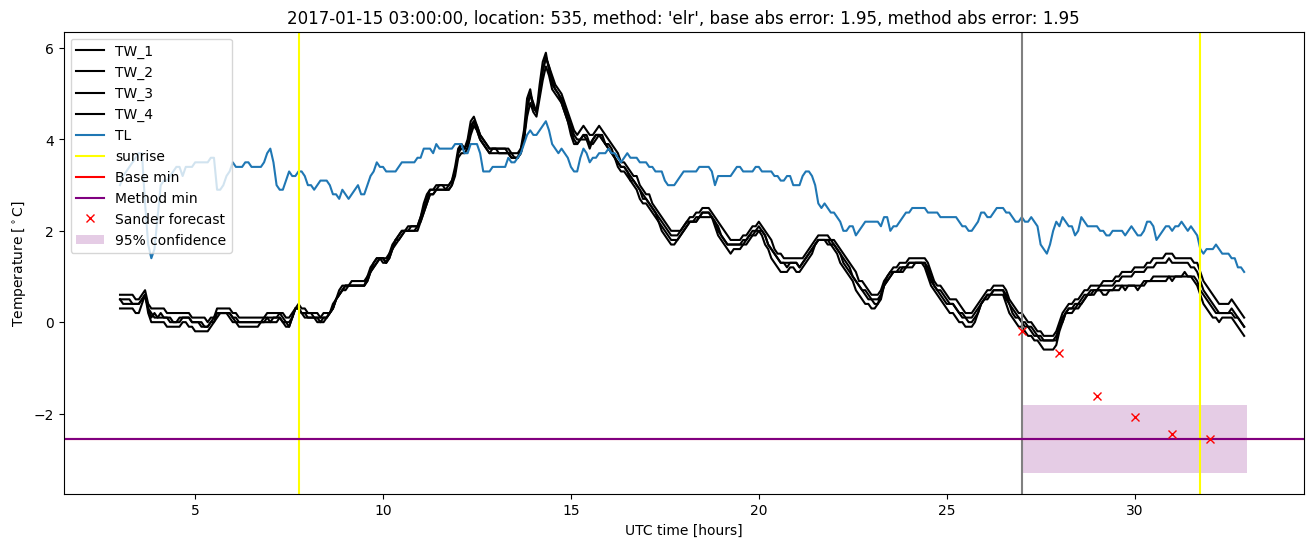
Extended logistic regression results
| names |
period |
power |
significance |
meanSquareError |
absError |
maxError |
CRPS |
IGN |
| baseline |
winter 2016 |
0.995 |
0.000e+00 |
0.375 |
0.459 |
1.902 |
NaN |
NaN |
| elr |
winter 2016 |
0.985 |
0.000e+00 |
0.235 |
0.375 |
1.457 |
0.786 |
1.149e+01 |
| baseline |
winter 2017 |
0.992 |
0.080 |
0.358 |
0.447 |
1.948 |
NaN |
NaN |
| elr |
winter 2017 |
0.992 |
0.040 |
0.310 |
0.394 |
1.954 |
0.694 |
1.225e+01 |
| baseline |
winter 2018 |
0.993 |
0.095 |
0.423 |
0.466 |
1.971 |
NaN |
NaN |
| elr |
winter 2018 |
0.993 |
0.095 |
0.367 |
0.434 |
2.363 |
0.790 |
1.330e+01 |
| baseline |
winter 2019 |
0.985 |
0.000e+00 |
0.283 |
0.402 |
2.149 |
NaN |
NaN |
| elr |
winter 2019 |
0.985 |
0.000e+00 |
0.170 |
0.309 |
1.391 |
0.766 |
1.069e+01 |
| baseline |
all |
0.992 |
0.059 |
0.363 |
0.446 |
2.149 |
NaN |
NaN |
| elr |
all |
0.988 |
0.044 |
0.271 |
0.380 |
2.363 |
0.762 |
1.194e+01 |
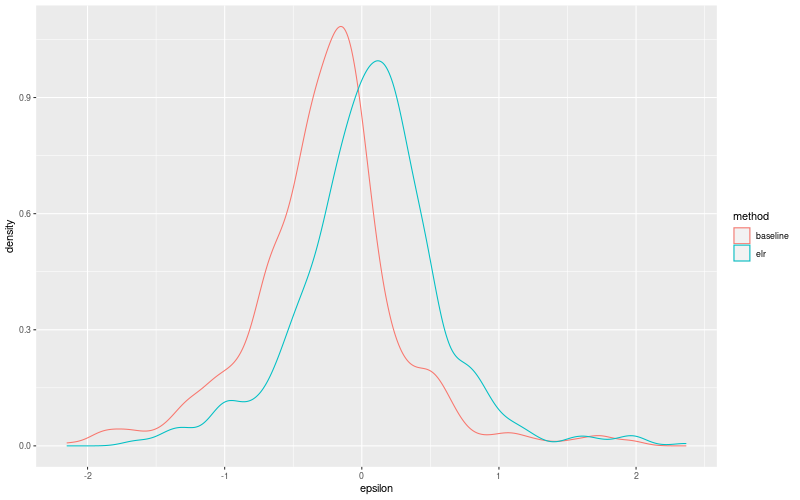
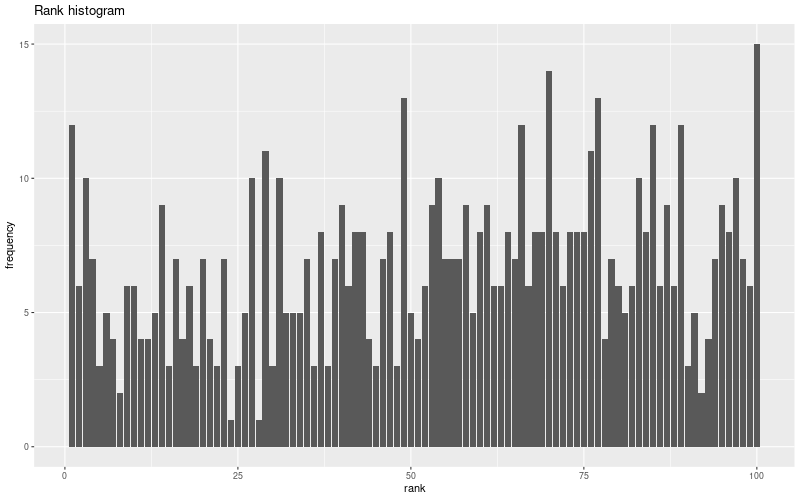
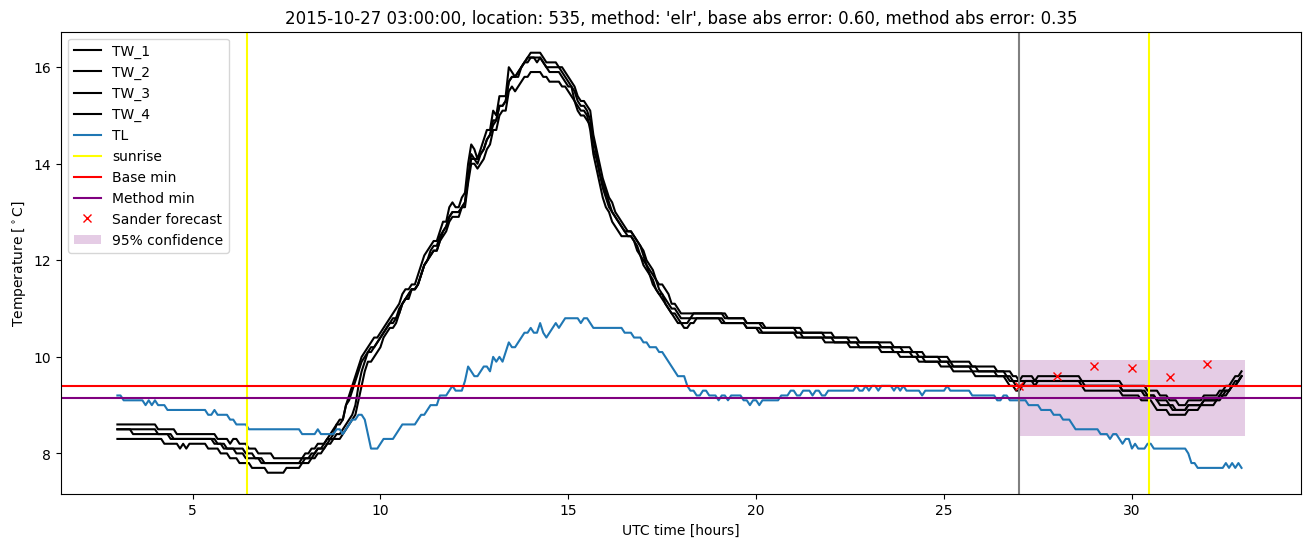
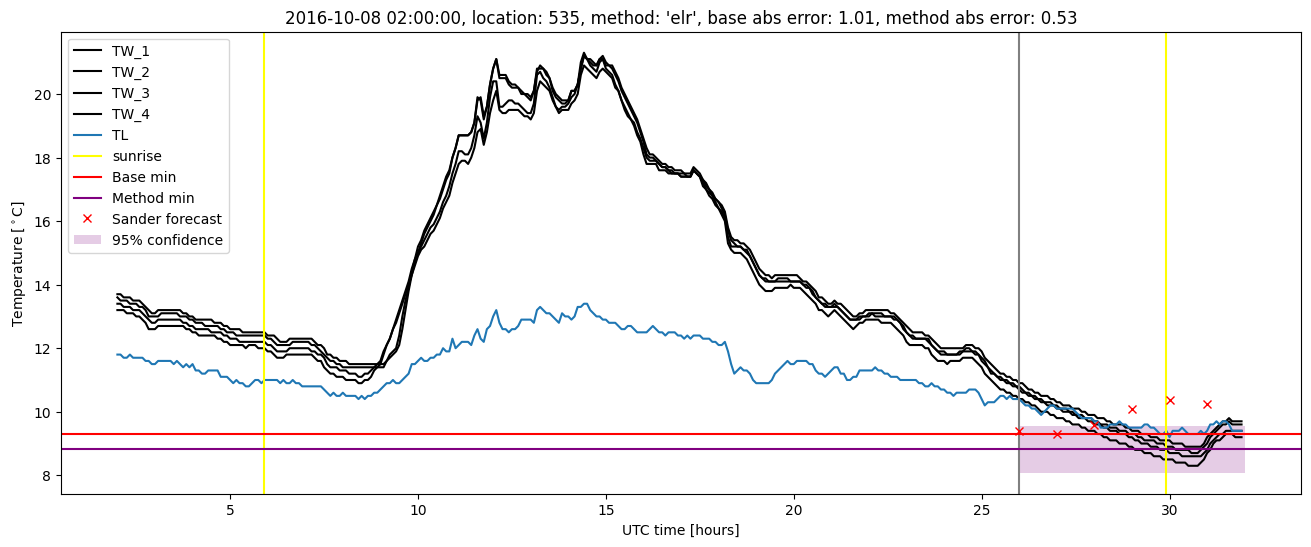
Extended logistic regression plots