GMS location: 534
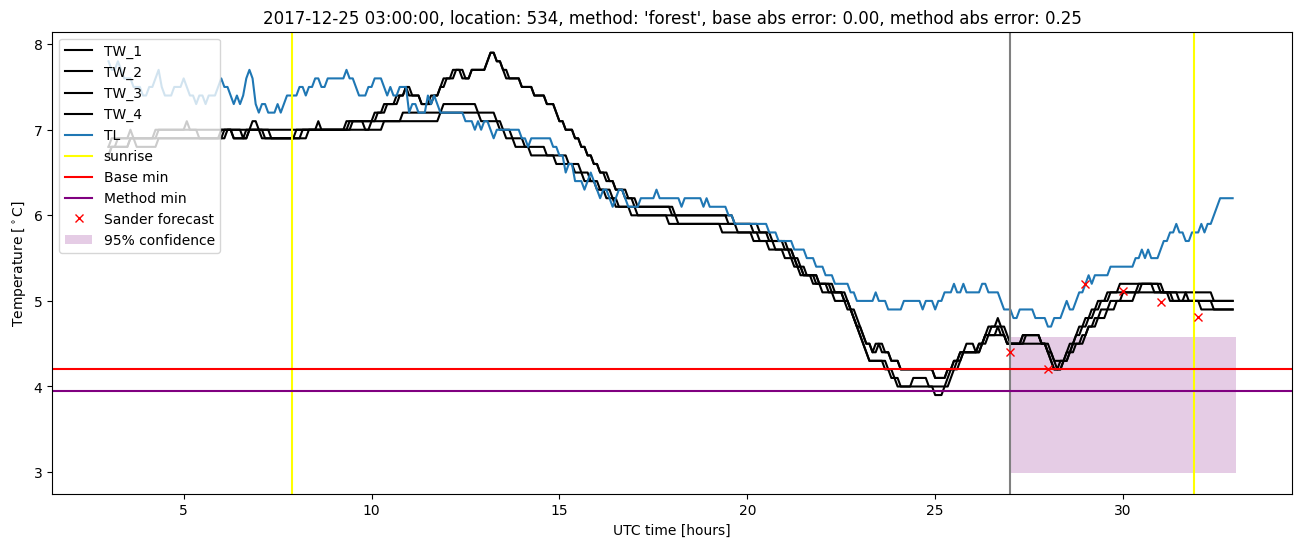
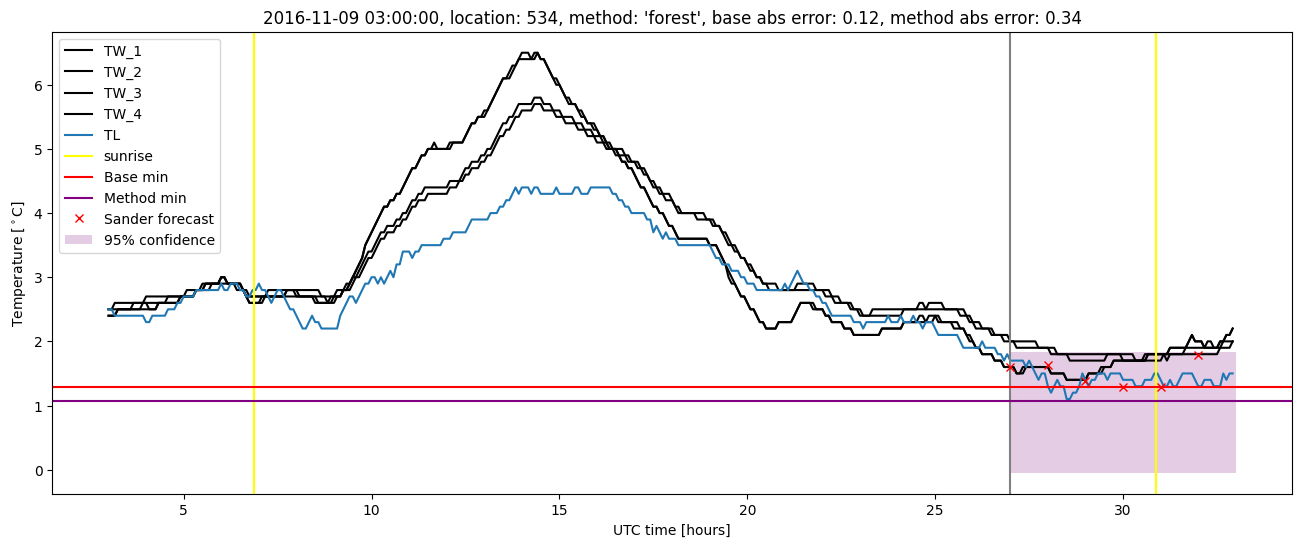
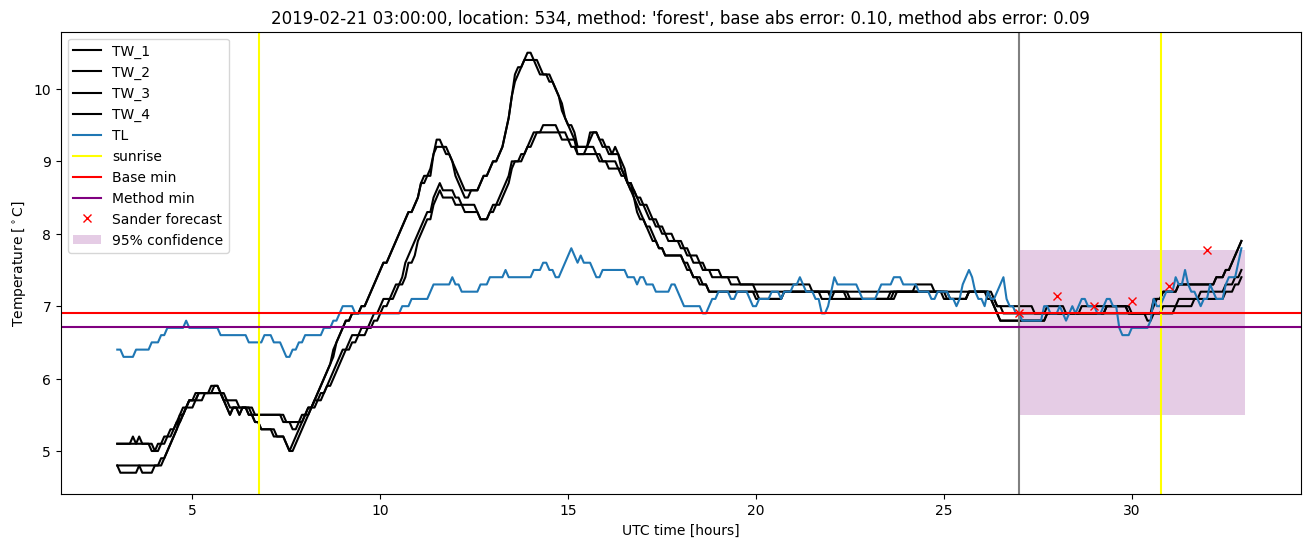
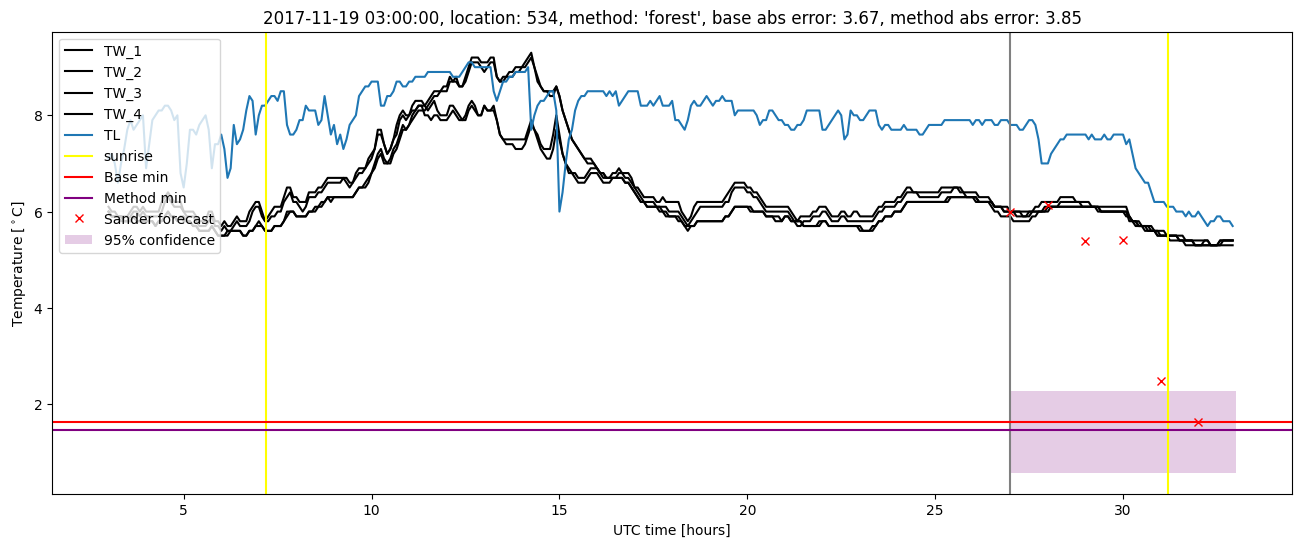
Random forest results
| names |
period |
power |
significance |
meanSquareError |
absError |
maxError |
CRPS |
IGN |
| baseline |
winter 2016 |
1.000 |
0.043 |
0.381 |
0.454 |
1.937 |
NaN |
NaN |
| forest |
winter 2016 |
1.000 |
0.043 |
0.283 |
0.396 |
1.814 |
0.561 |
2.901 |
| baseline |
winter 2017 |
0.992 |
0.062 |
0.585 |
0.575 |
2.440 |
NaN |
NaN |
| forest |
winter 2017 |
0.984 |
0.062 |
0.517 |
0.518 |
2.401 |
0.555 |
3.545 |
| baseline |
winter 2018 |
0.966 |
0.000e+00 |
0.401 |
0.404 |
3.668 |
NaN |
NaN |
| forest |
winter 2018 |
0.966 |
0.000e+00 |
0.426 |
0.426 |
3.846 |
0.597 |
3.719 |
| baseline |
winter 2019 |
0.993 |
0.105 |
0.244 |
0.349 |
2.300 |
NaN |
NaN |
| forest |
winter 2019 |
0.993 |
0.158 |
0.218 |
0.334 |
1.989 |
0.564 |
2.899 |
| baseline |
all |
0.988 |
0.050 |
0.399 |
0.444 |
3.668 |
NaN |
NaN |
| forest |
all |
0.986 |
0.059 |
0.356 |
0.416 |
3.846 |
0.569 |
3.250 |
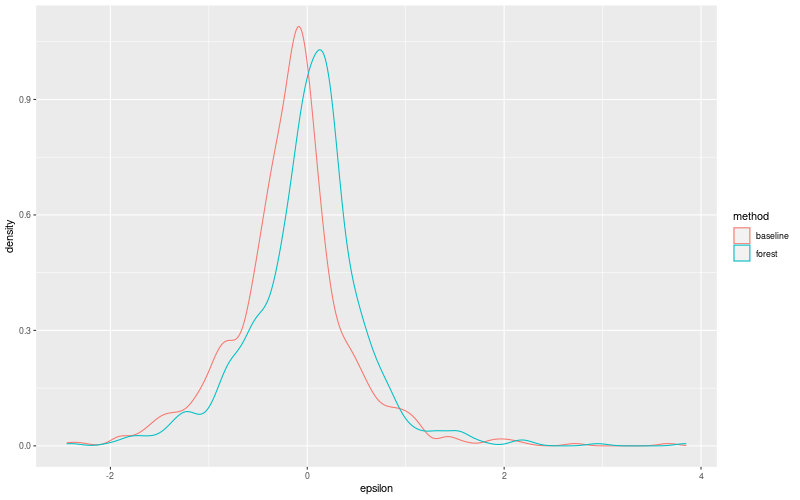
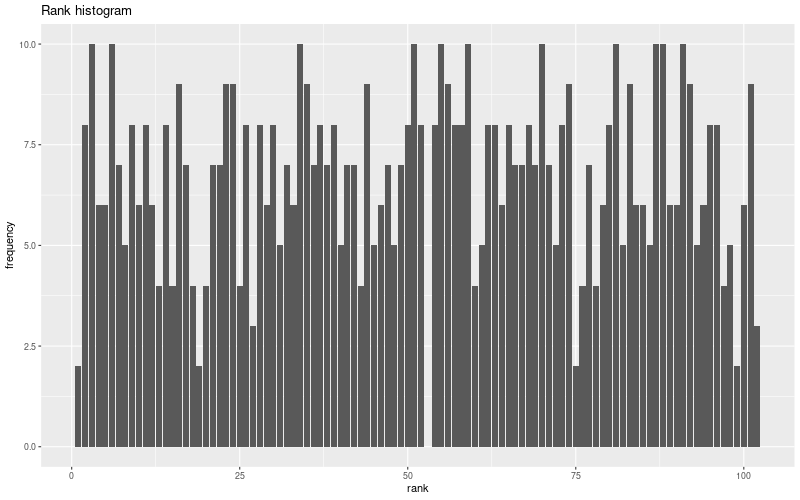
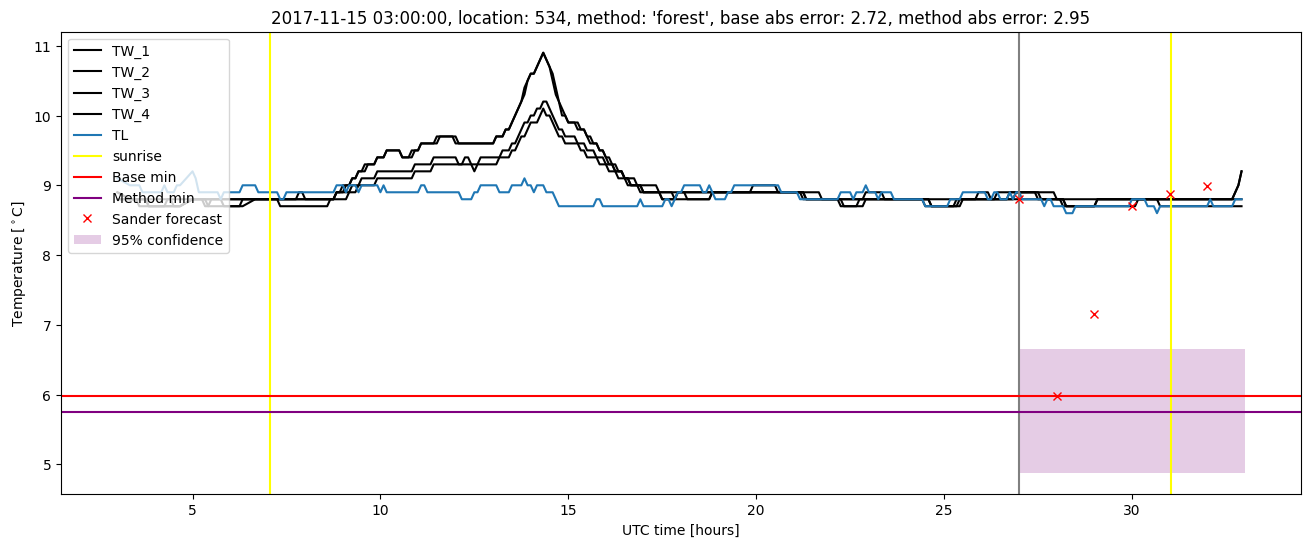
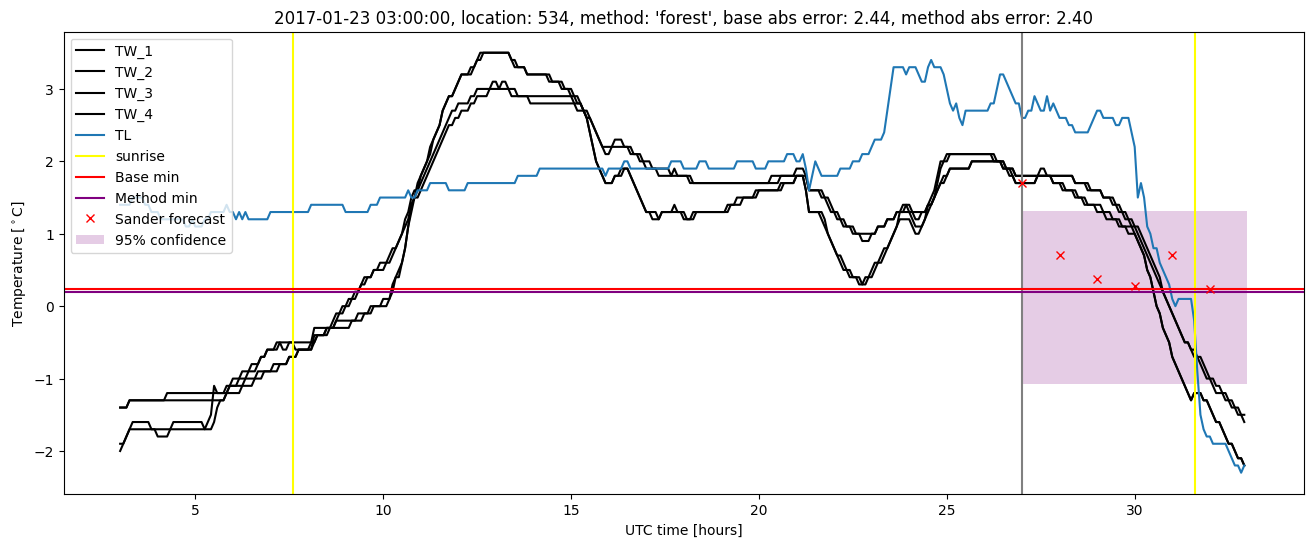
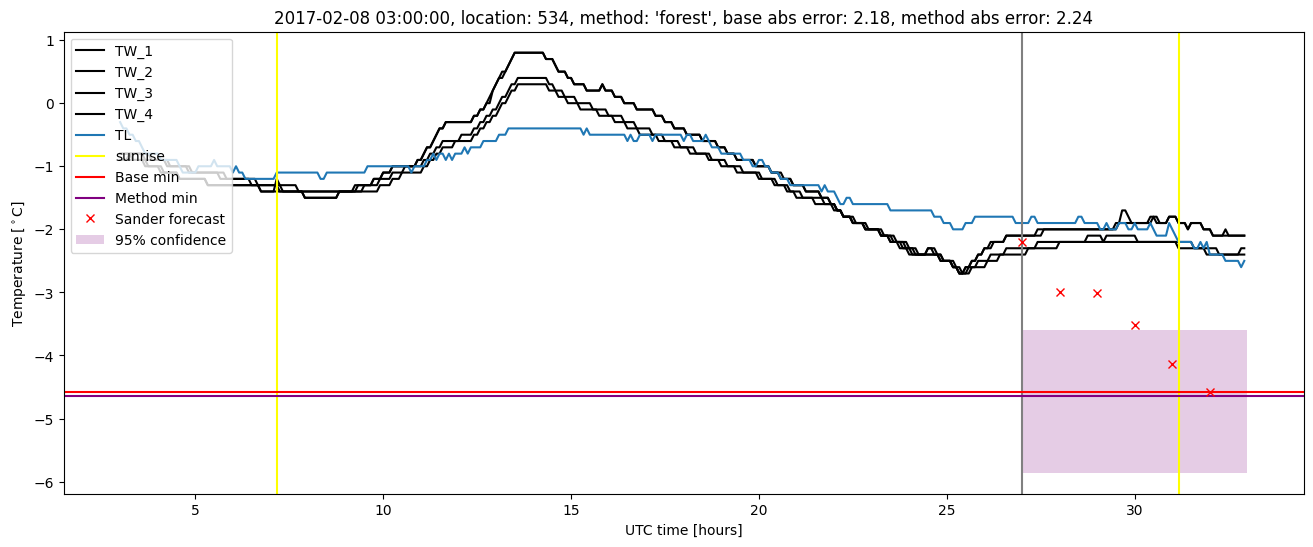
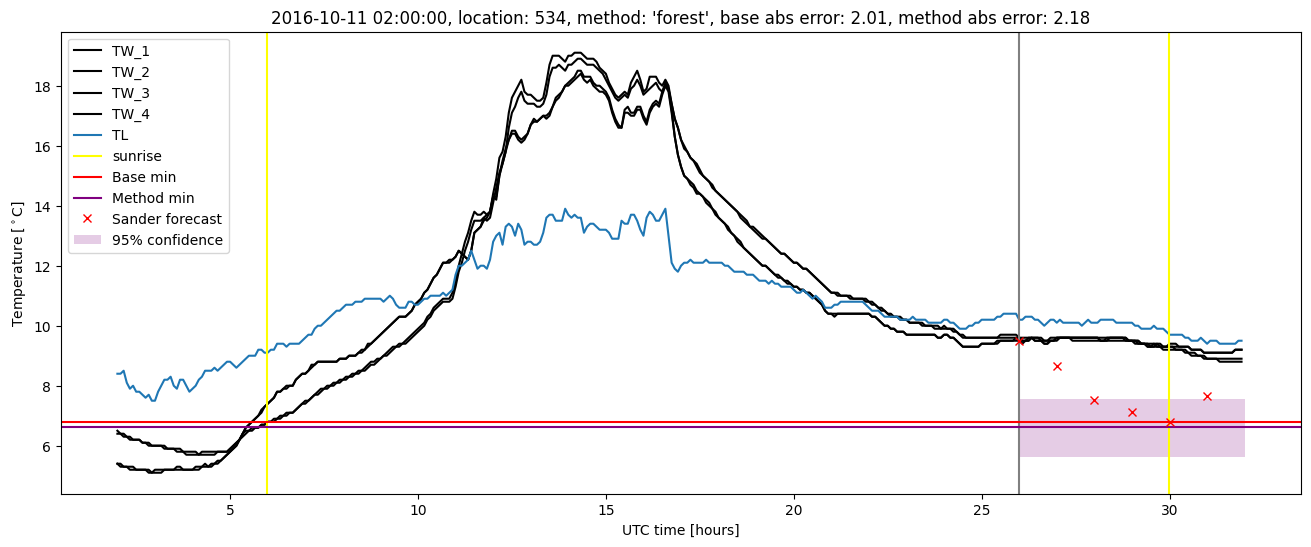
Random forest plots
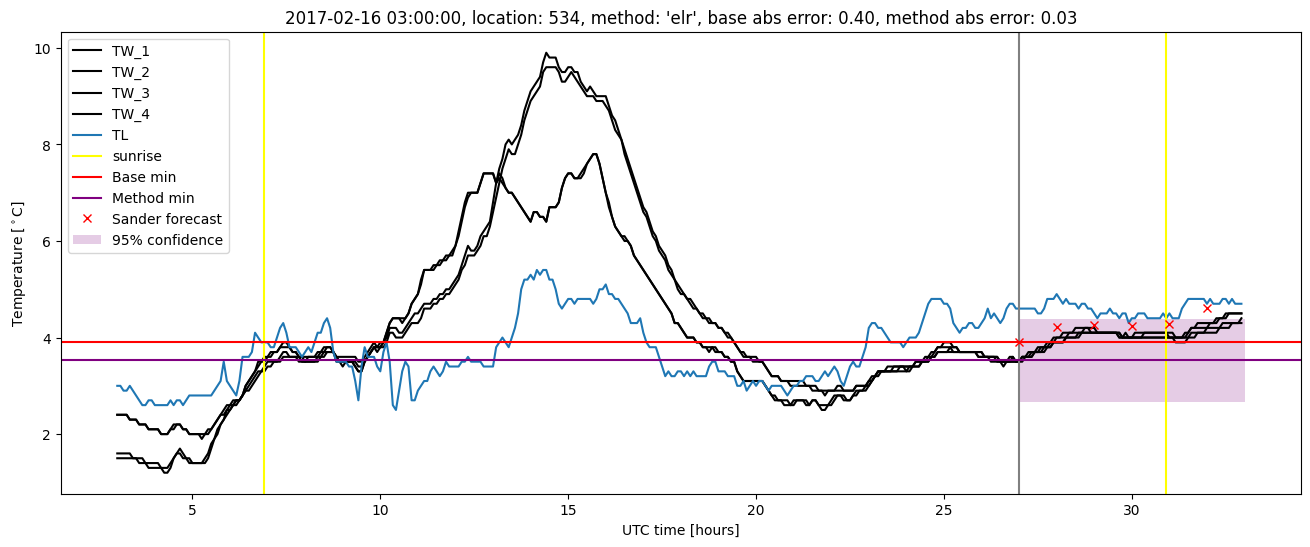
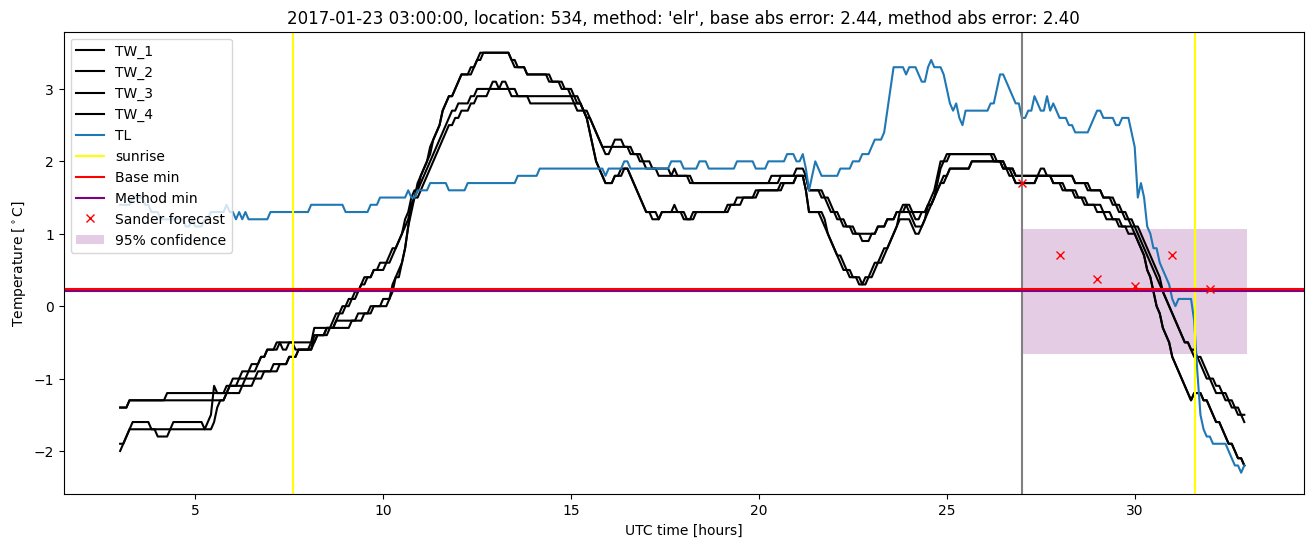
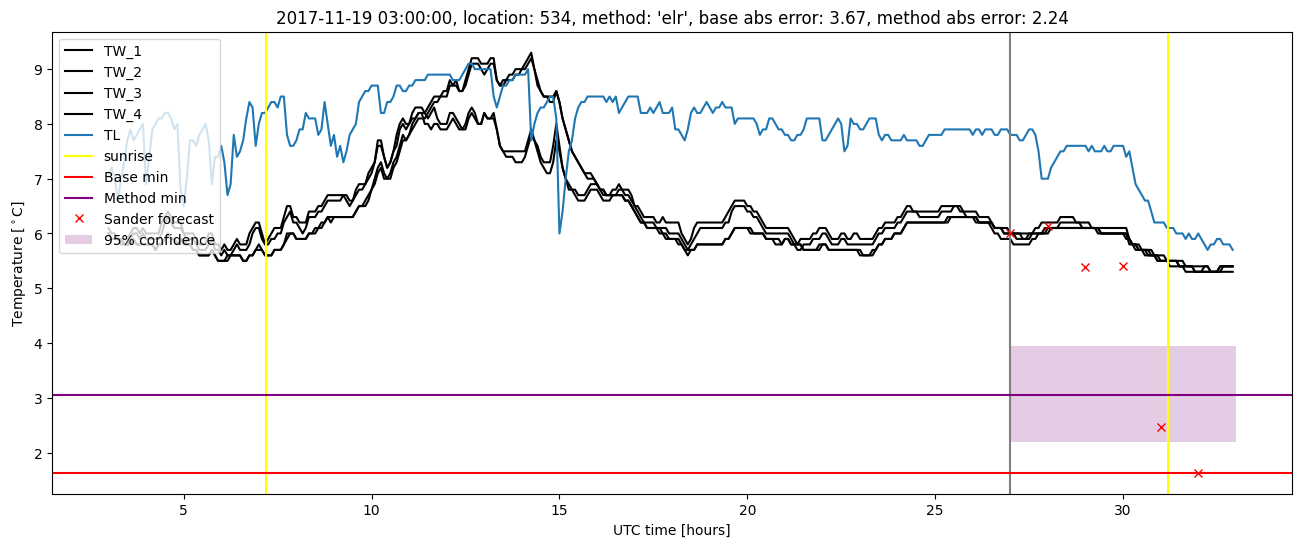
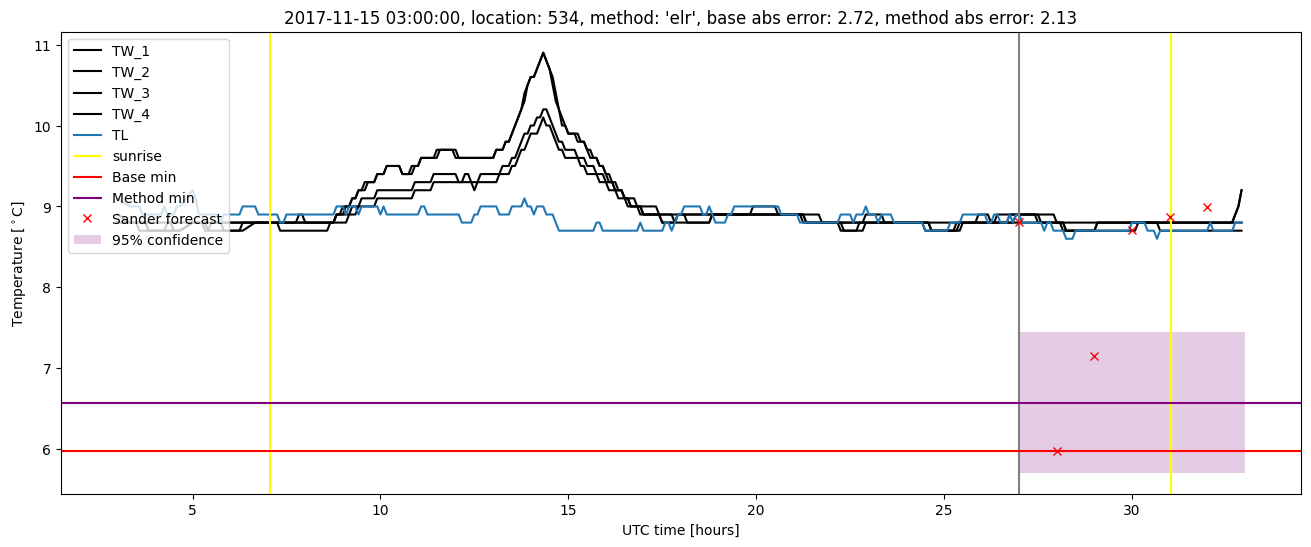
Extended logistic regression results
| names |
period |
power |
significance |
meanSquareError |
absError |
maxError |
CRPS |
IGN |
| baseline |
winter 2016 |
1.000 |
0.043 |
0.381 |
0.454 |
1.937 |
NaN |
NaN |
| elr |
winter 2016 |
0.994 |
0.043 |
0.335 |
0.450 |
1.753 |
0.649 |
4.812 |
| baseline |
winter 2017 |
0.992 |
0.062 |
0.585 |
0.575 |
2.440 |
NaN |
NaN |
| elr |
winter 2017 |
0.984 |
0.062 |
0.469 |
0.516 |
2.405 |
0.616 |
5.617 |
| baseline |
winter 2018 |
0.966 |
0.000e+00 |
0.401 |
0.404 |
3.668 |
NaN |
NaN |
| elr |
winter 2018 |
0.980 |
0.000e+00 |
0.297 |
0.404 |
2.243 |
0.692 |
6.754 |
| baseline |
winter 2019 |
0.993 |
0.105 |
0.244 |
0.349 |
2.300 |
NaN |
NaN |
| elr |
winter 2019 |
1.000 |
0.158 |
0.254 |
0.388 |
1.931 |
0.647 |
4.332 |
| baseline |
all |
0.988 |
0.050 |
0.399 |
0.444 |
3.668 |
NaN |
NaN |
| elr |
all |
0.990 |
0.059 |
0.336 |
0.438 |
2.405 |
0.652 |
5.368 |
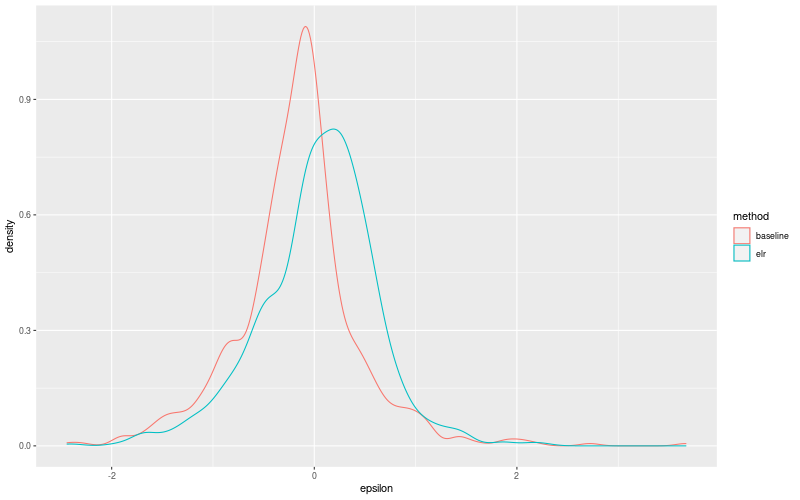
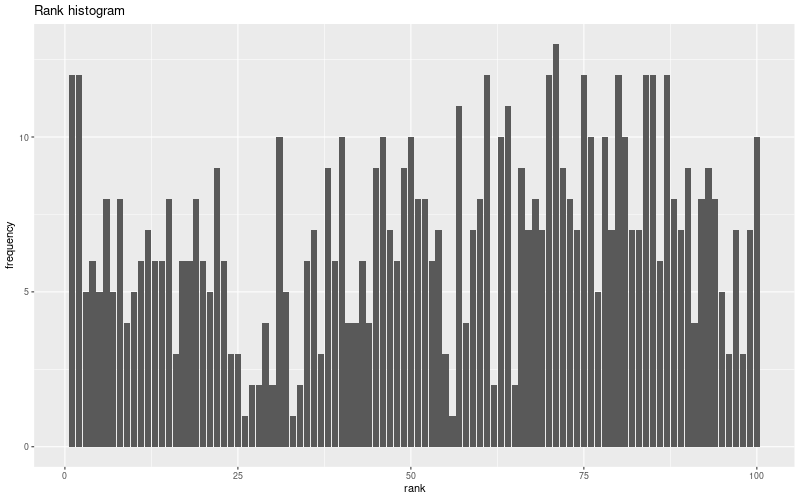
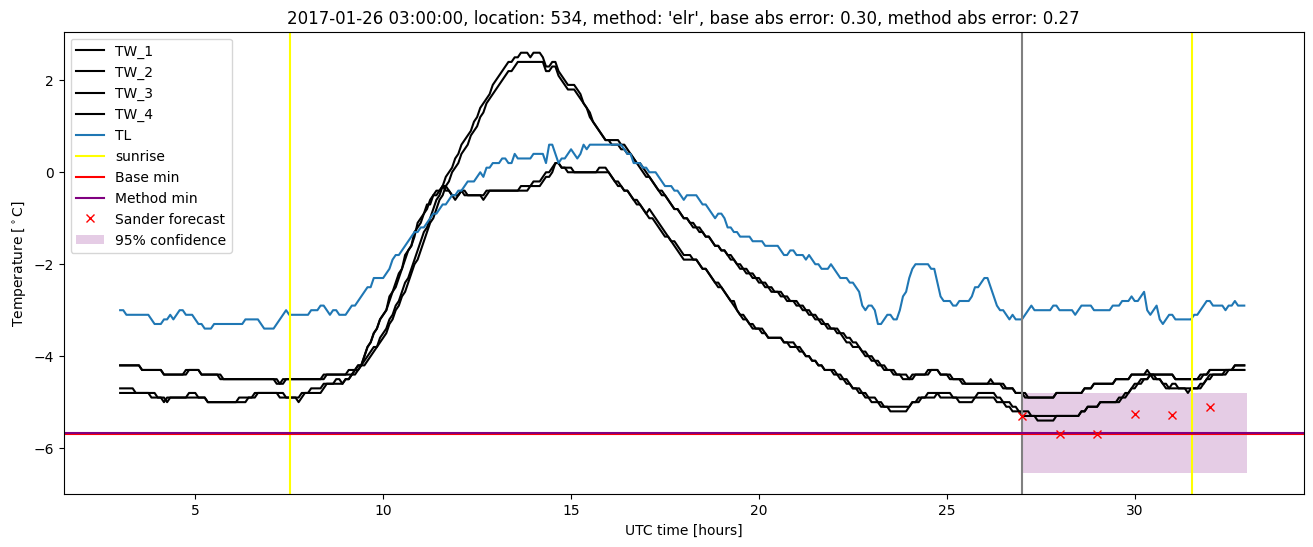
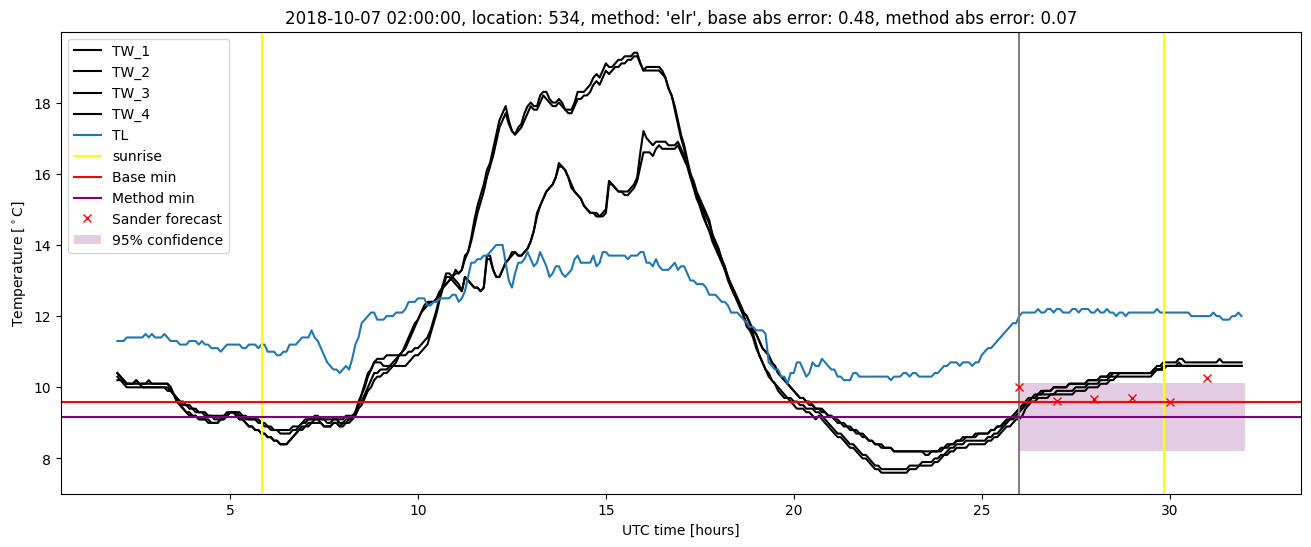
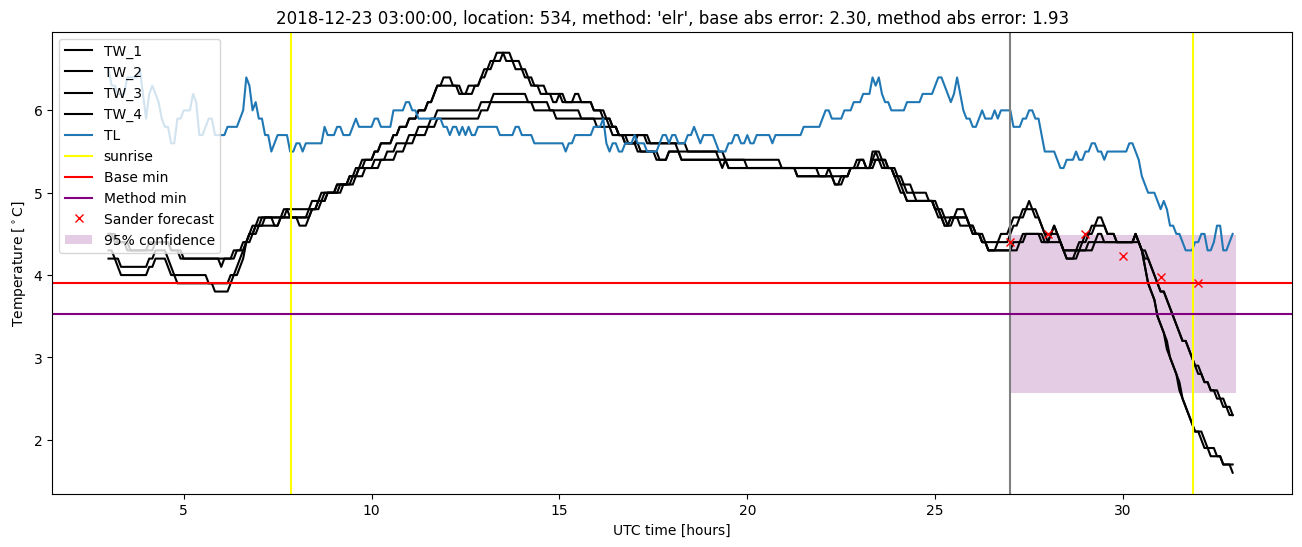
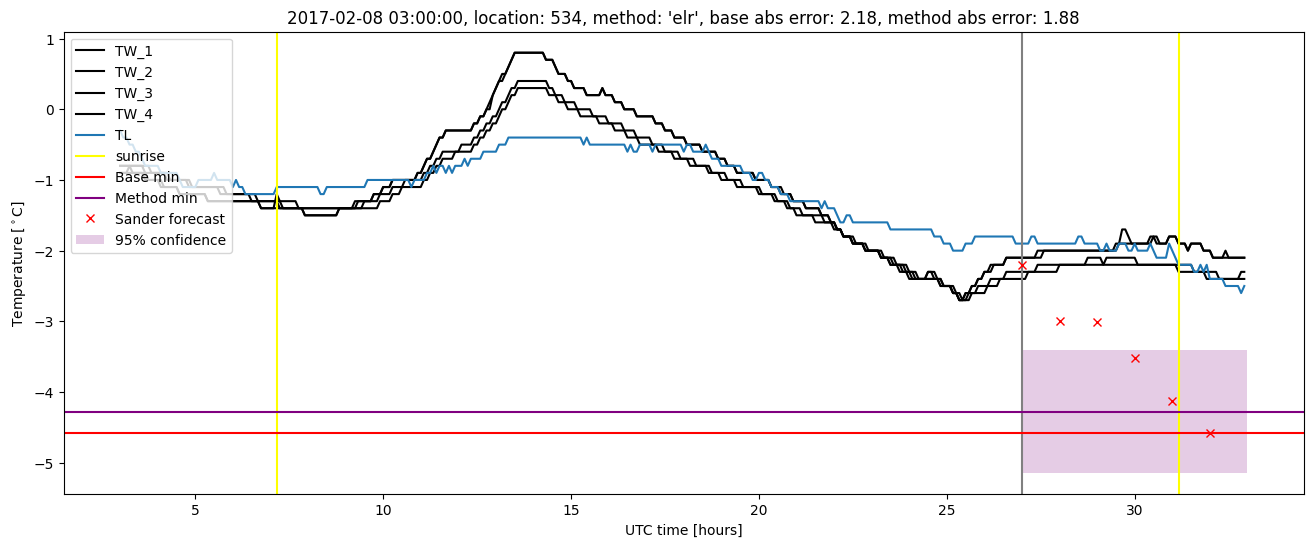
Extended logistic regression plots