GMS location: 533
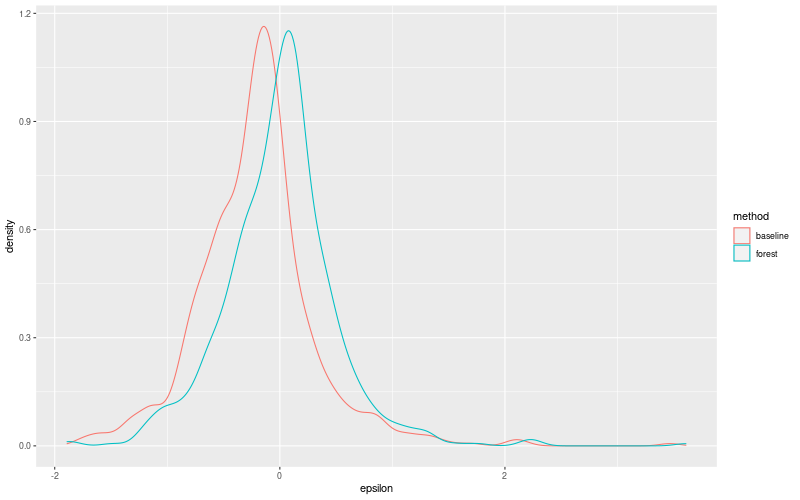
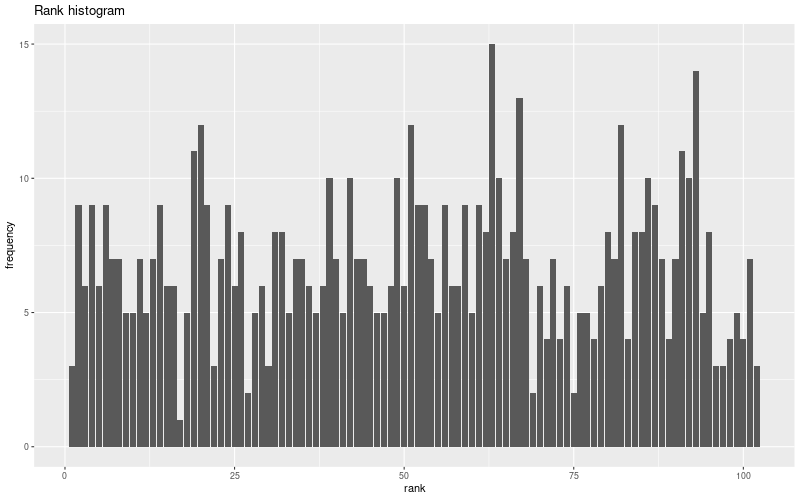
Random forest results
| names |
period |
power |
significance |
meanSquareError |
absError |
maxError |
CRPS |
IGN |
| baseline |
winter 2016 |
0.995 |
0.133 |
0.328 |
0.432 |
1.794 |
NaN |
NaN |
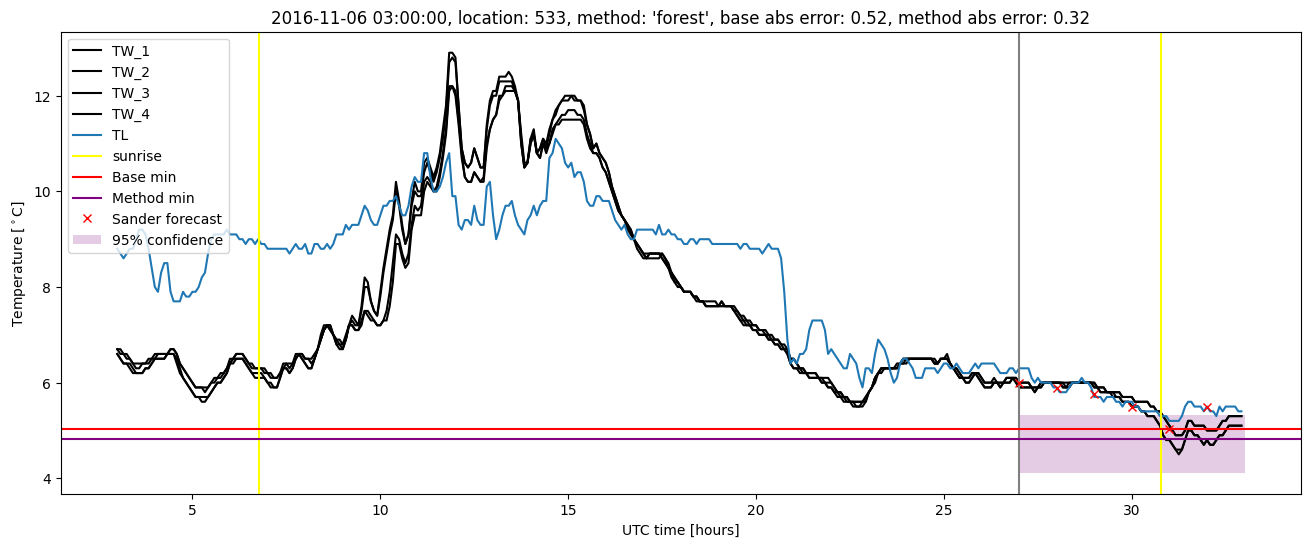
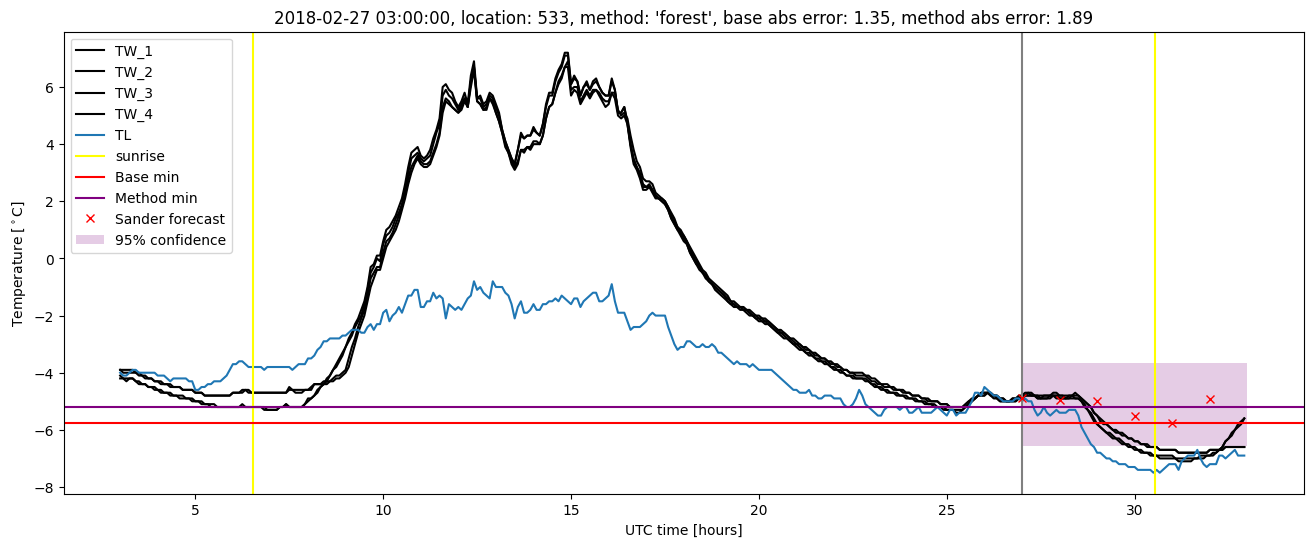
| forest |
winter 2016 |
0.990 |
0.133 |
0.224 |
0.352 |
1.849 |
0.623 |
6.519 |
| baseline |
winter 2017 |
0.992 |
0.179 |
0.390 |
0.475 |
2.096 |
NaN |
NaN |
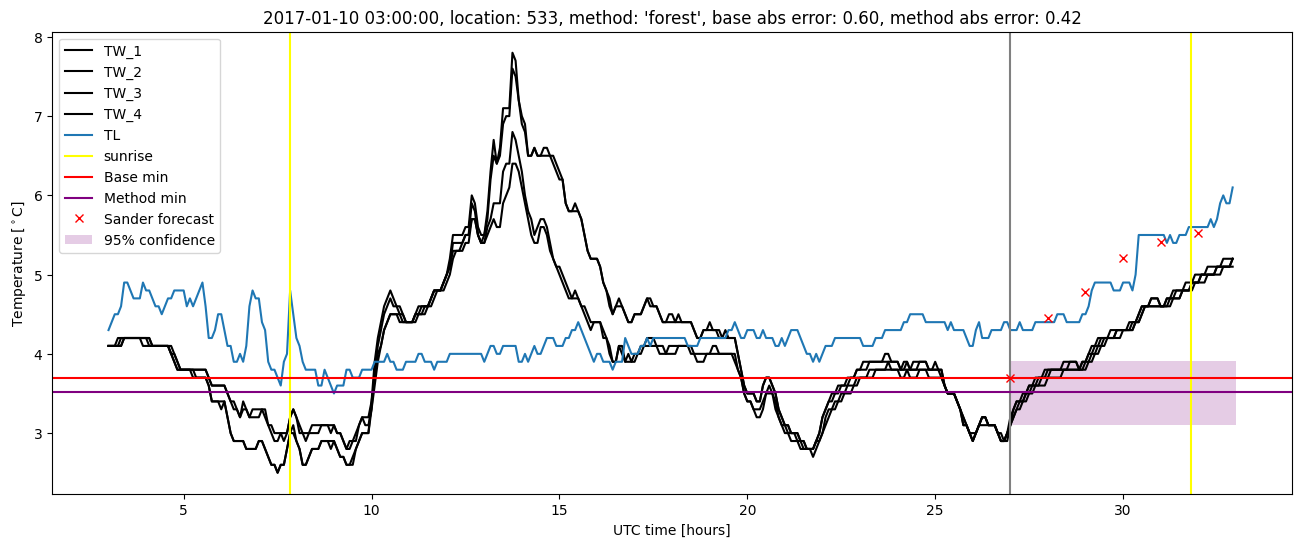
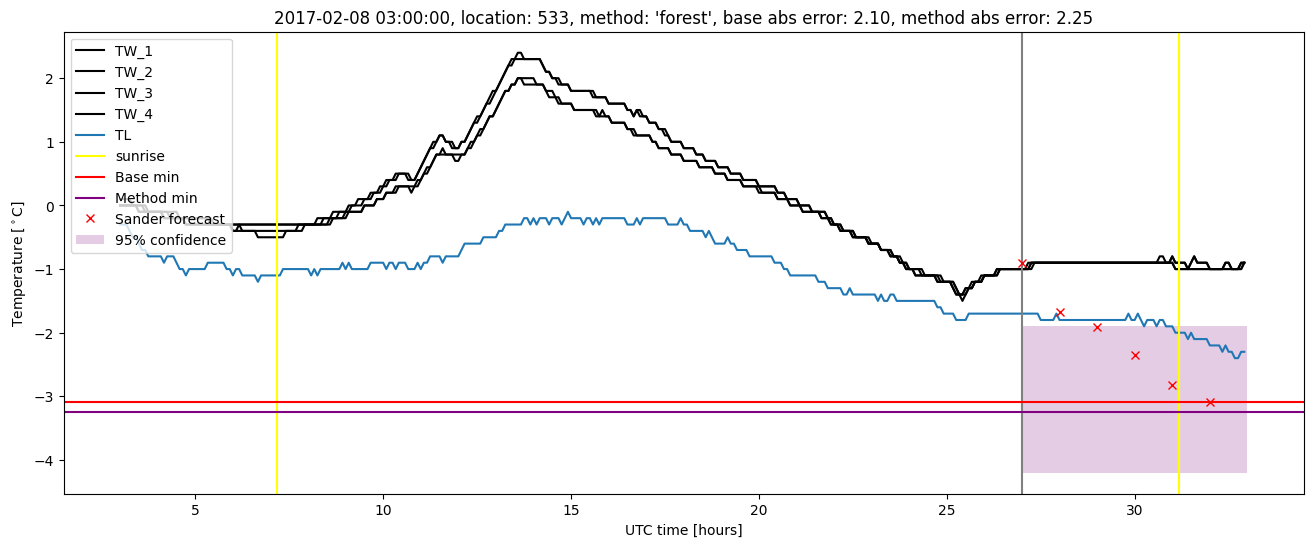
| forest |
winter 2017 |
0.984 |
0.143 |
0.321 |
0.417 |
2.252 |
0.599 |
7.788 |
| baseline |
winter 2018 |
0.987 |
0.045 |
0.353 |
0.404 |
3.465 |
NaN |
NaN |
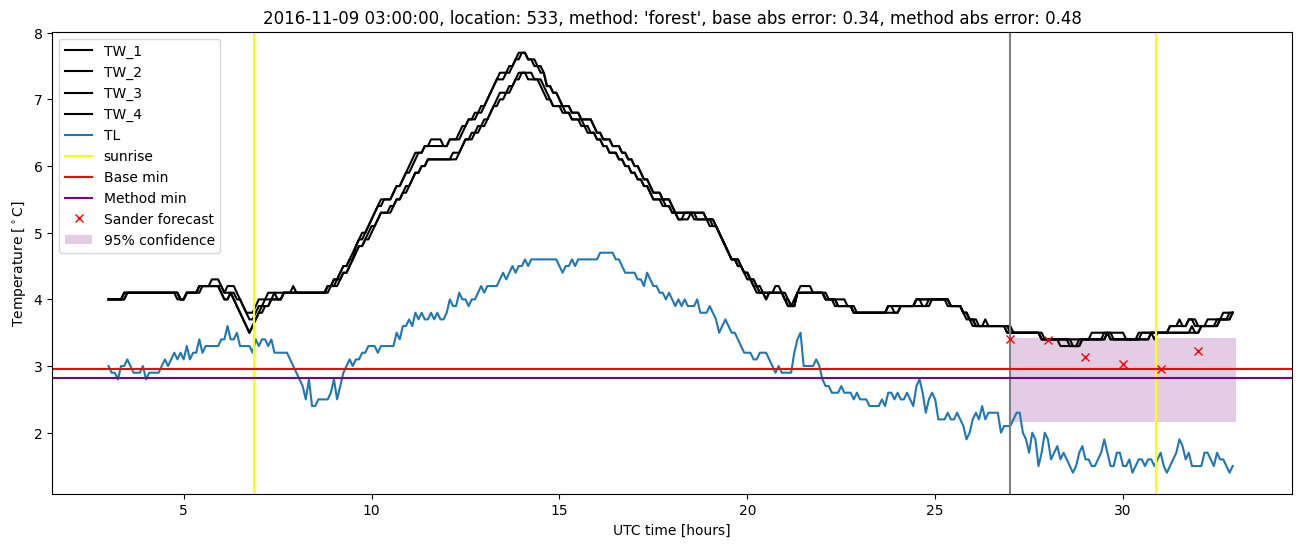
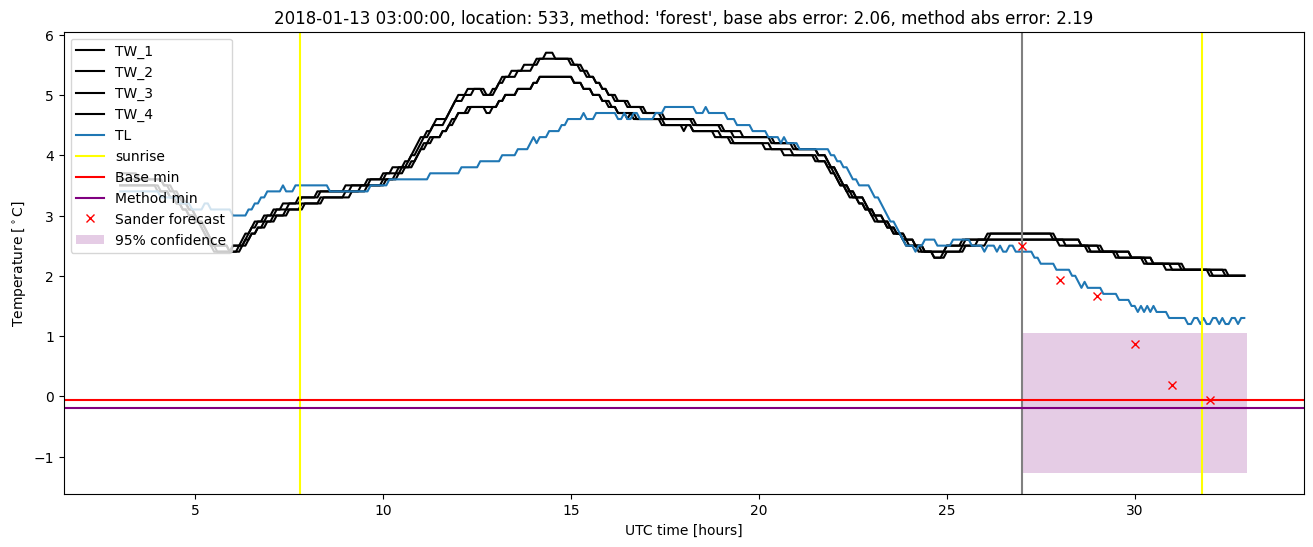
| forest |
winter 2018 |
0.981 |
0.045 |
0.328 |
0.370 |
3.608 |
0.645 |
7.473 |
| baseline |
winter 2019 |
1.000 |
0.125 |
0.215 |
0.353 |
1.390 |
NaN |
NaN |
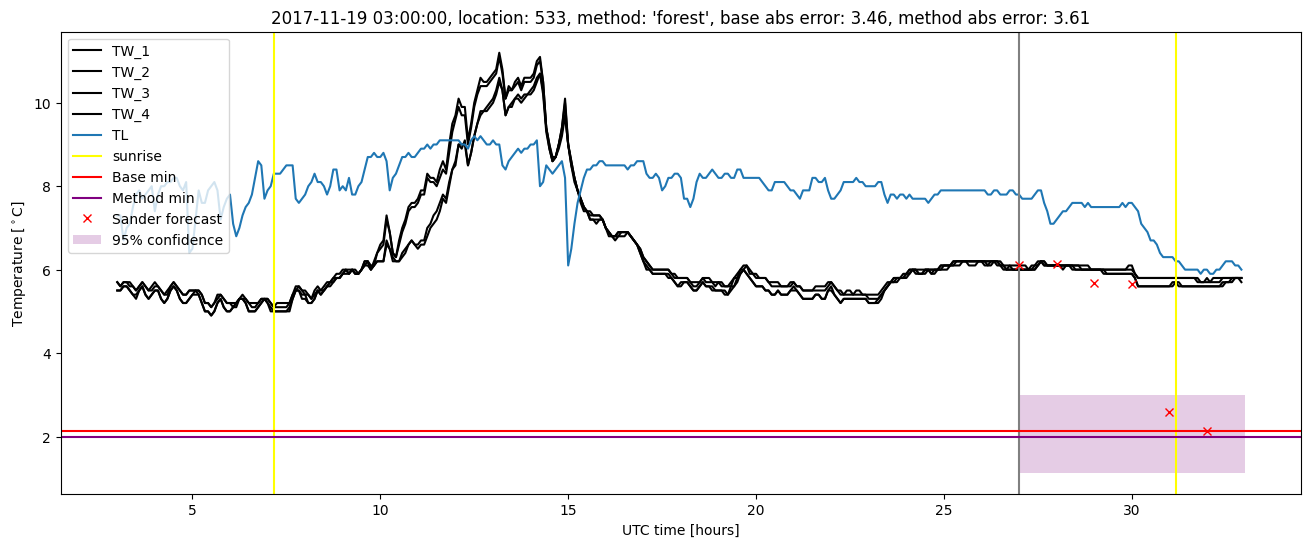
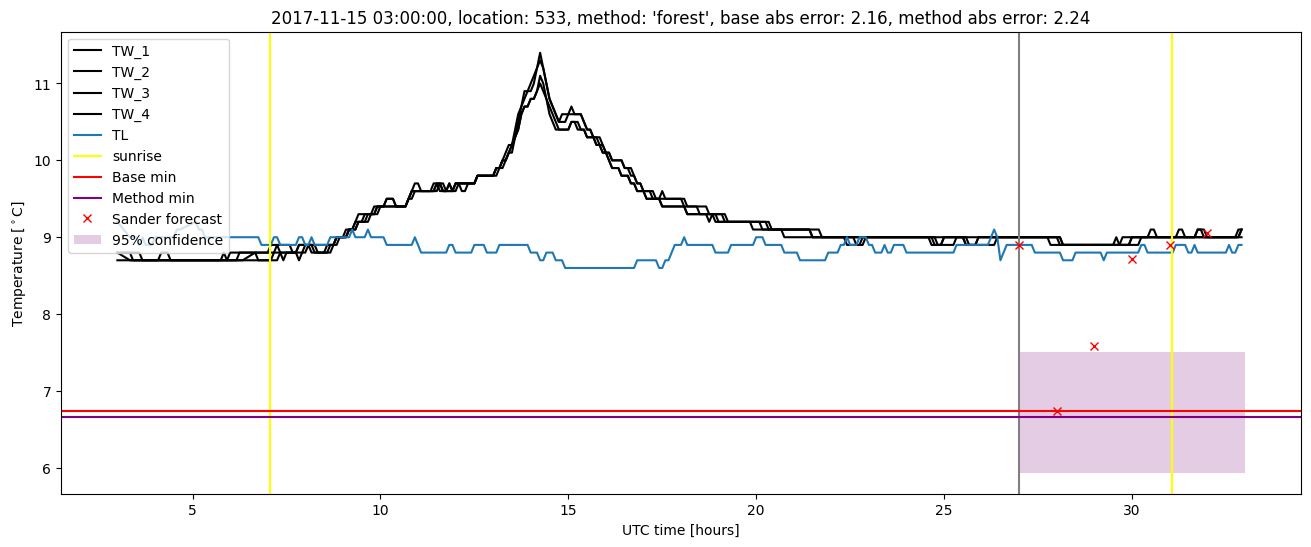
| forest |
winter 2019 |
1.000 |
0.062 |
0.147 |
0.286 |
1.262 |
0.639 |
5.017 |
| baseline |
all |
0.994 |
0.123 |
0.322 |
0.416 |
3.465 |
NaN |
NaN |
| forest |
all |
0.989 |
0.099 |
0.254 |
0.356 |
3.608 |
0.627 |
6.694 |
Random forest plots
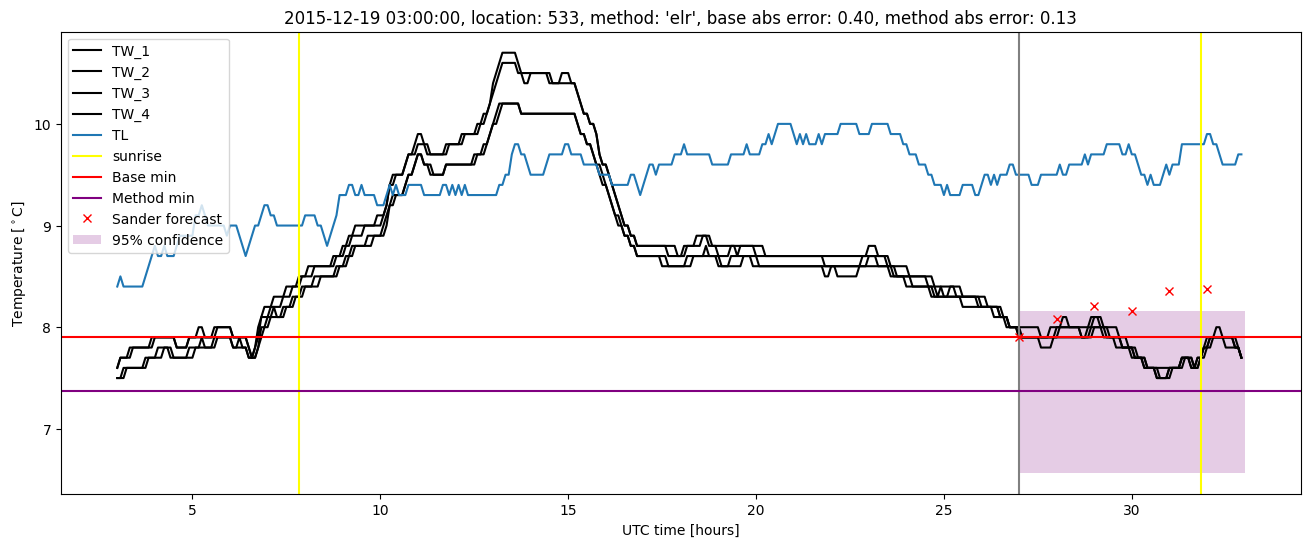
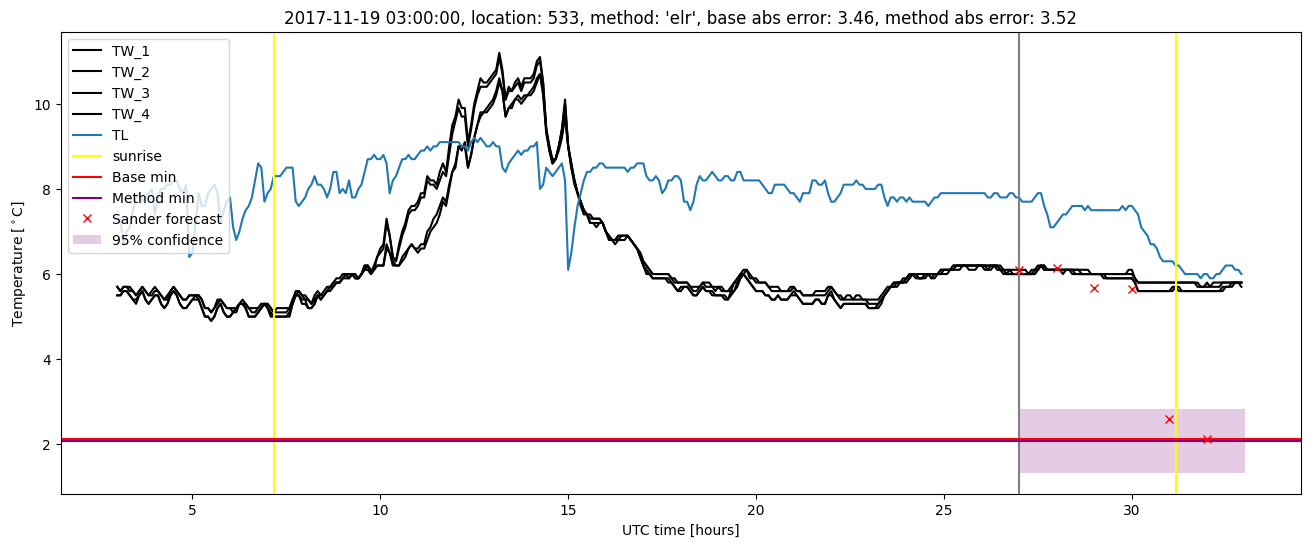
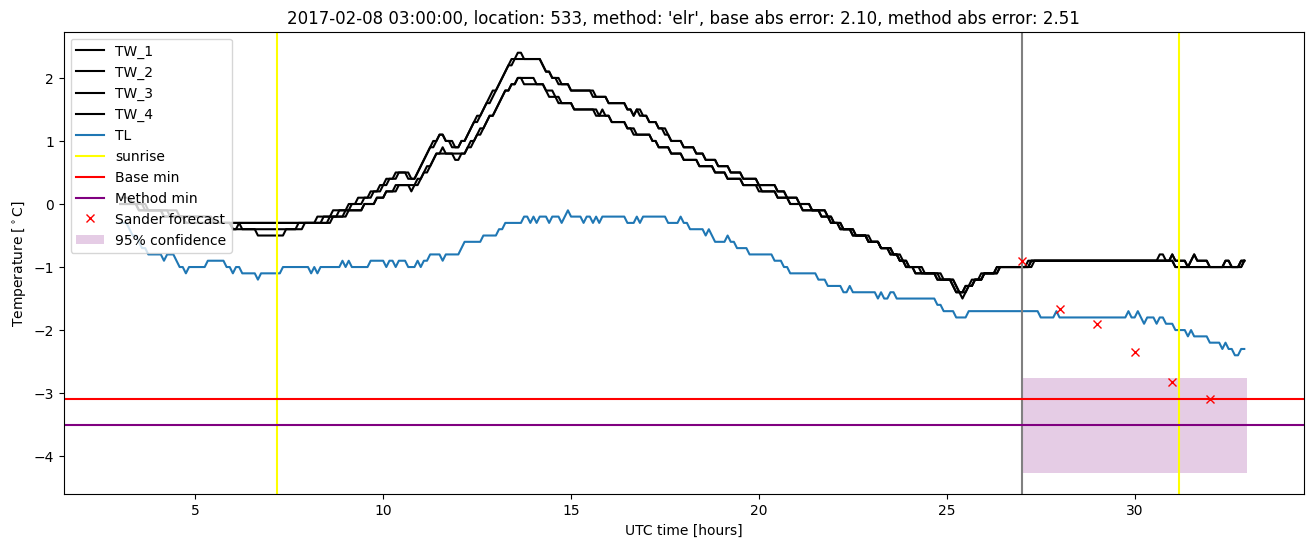
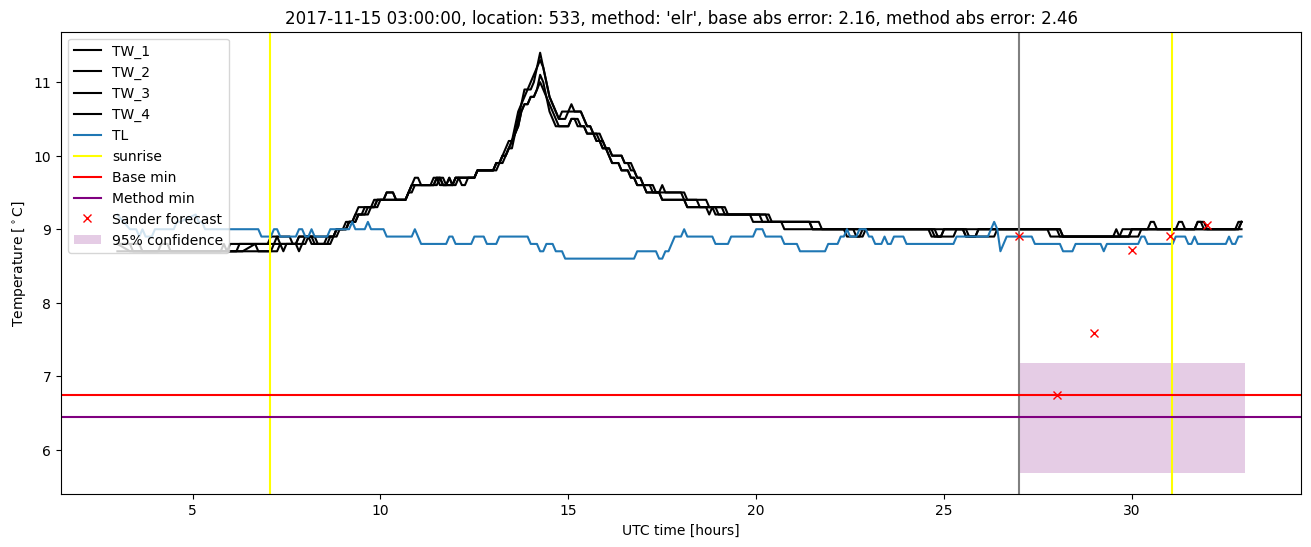
Extended logistic regression results
| names |
period |
power |
significance |
meanSquareError |
absError |
maxError |
CRPS |
IGN |
| baseline |
winter 2016 |
0.995 |
0.133 |
0.328 |
0.432 |
1.794 |
NaN |
NaN |
| elr |
winter 2016 |
0.990 |
0.133 |
0.250 |
0.388 |
1.708 |
0.736 |
1.012e+01 |
| baseline |
winter 2017 |
0.992 |
0.179 |
0.390 |
0.475 |
2.096 |
NaN |
NaN |
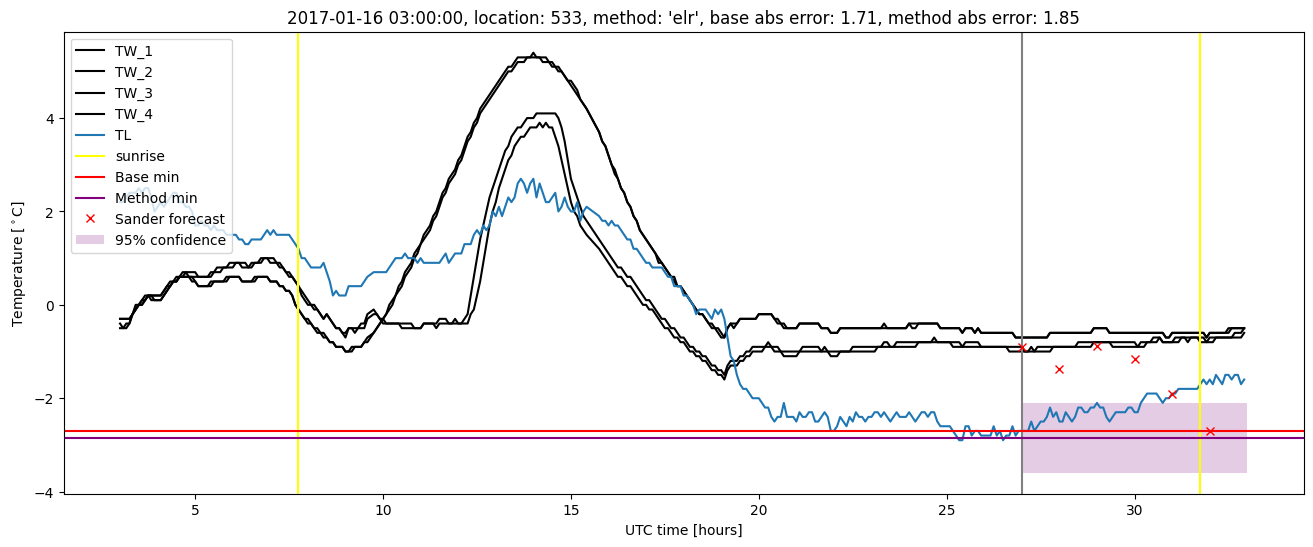
| elr |
winter 2017 |
0.976 |
0.107 |
0.392 |
0.466 |
2.510 |
0.684 |
1.140e+01 |
| baseline |
winter 2018 |
0.987 |
0.045 |
0.353 |
0.404 |
3.465 |
NaN |
NaN |
| elr |
winter 2018 |
0.981 |
0.045 |
0.334 |
0.399 |
3.519 |
0.753 |
1.340e+01 |
| baseline |
winter 2019 |
1.000 |
0.125 |
0.215 |
0.353 |
1.390 |
NaN |
NaN |
| elr |
winter 2019 |
1.000 |
0.062 |
0.207 |
0.339 |
1.738 |
0.676 |
8.102 |
| baseline |
all |
0.994 |
0.123 |
0.322 |
0.416 |
3.465 |
NaN |
NaN |
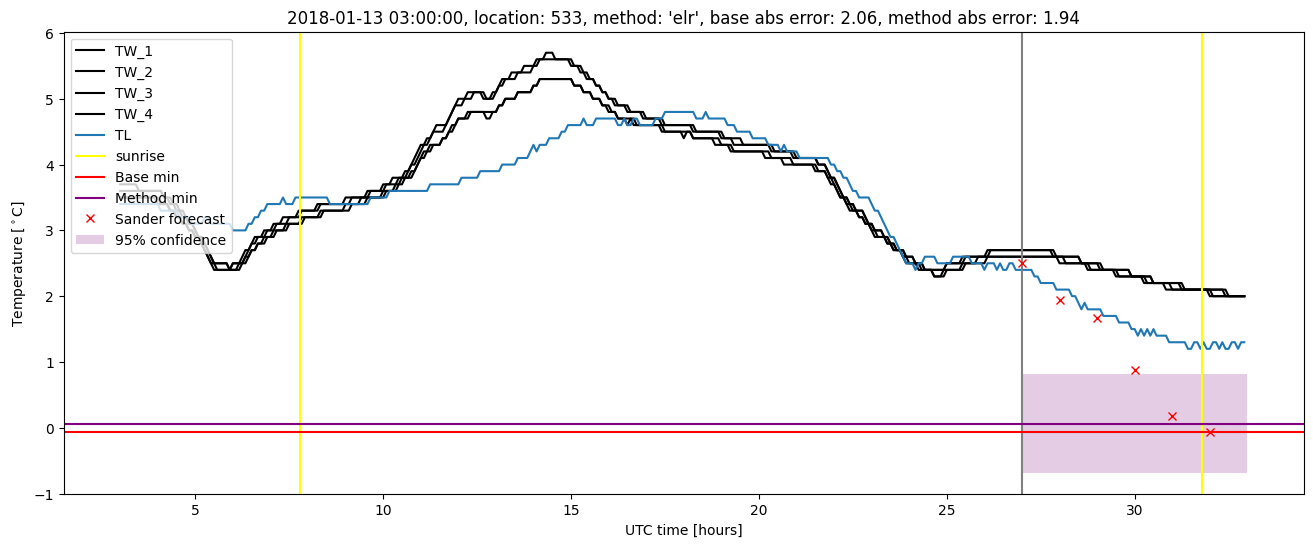
| elr |
all |
0.987 |
0.086 |
0.293 |
0.397 |
3.519 |
0.715 |
1.077e+01 |
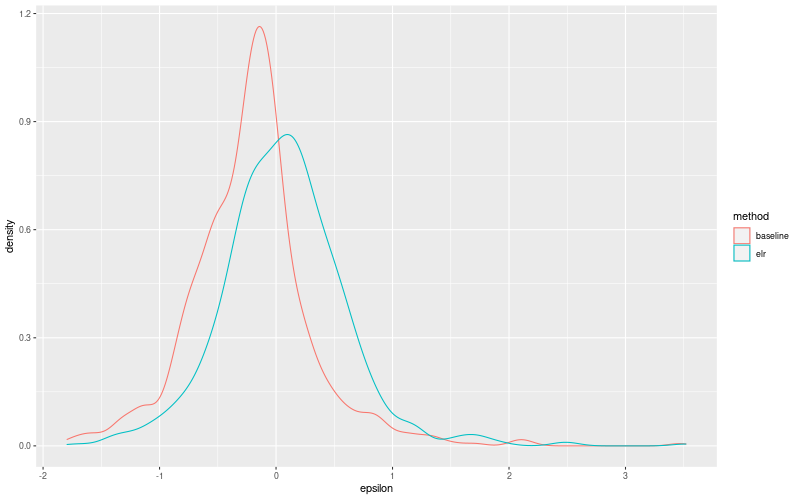
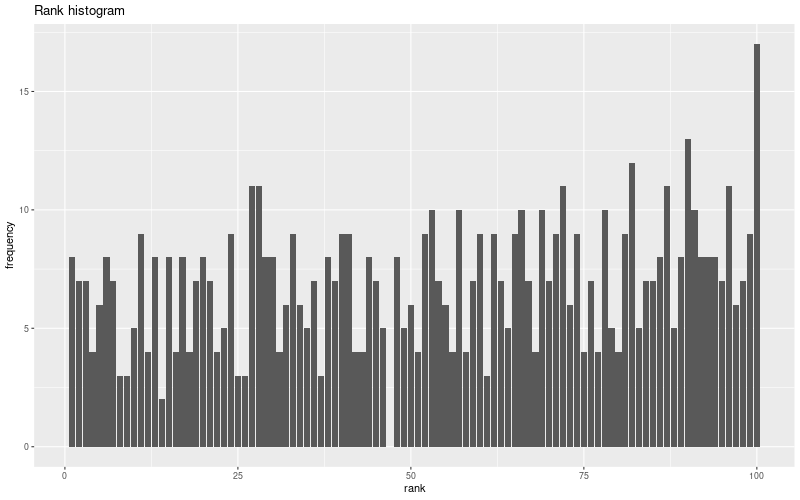
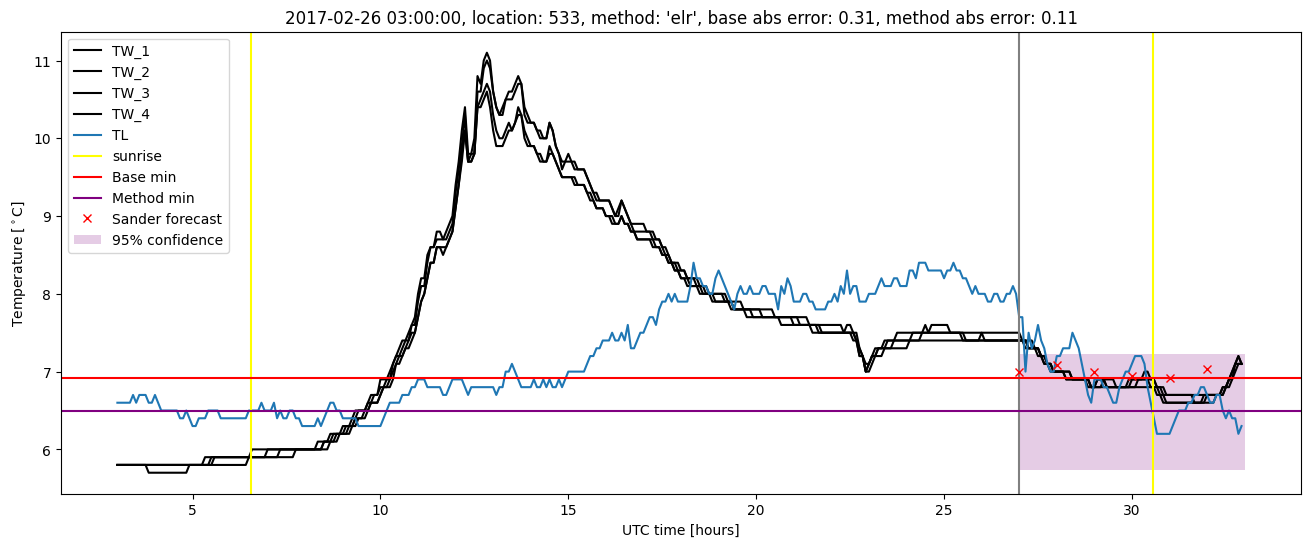
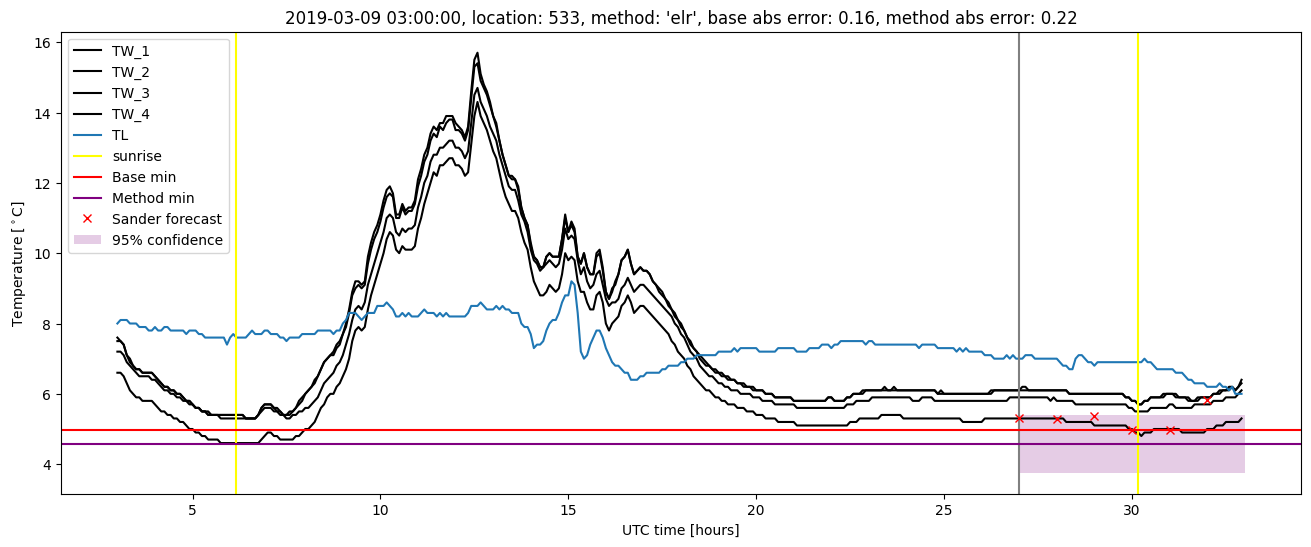
Extended logistic regression plots