GMS location: 532
Random forest results
| names |
period |
power |
significance |
meanSquareError |
absError |
maxError |
CRPS |
IGN |
| baseline |
winter 2016 |
0.989 |
0.000e+00 |
0.338 |
0.434 |
2.045 |
NaN |
NaN |
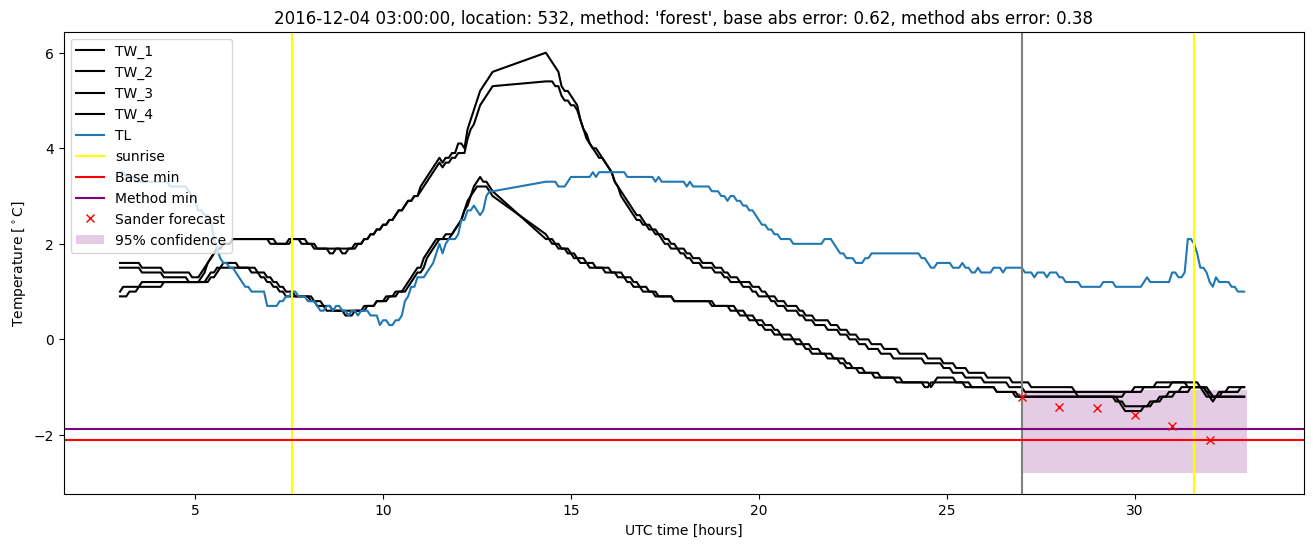
| forest |
winter 2016 |
0.989 |
0.000e+00 |
0.291 |
0.418 |
1.627 |
0.618 |
3.935 |
| baseline |
winter 2017 |
0.985 |
0.037 |
0.447 |
0.473 |
2.142 |
NaN |
NaN |
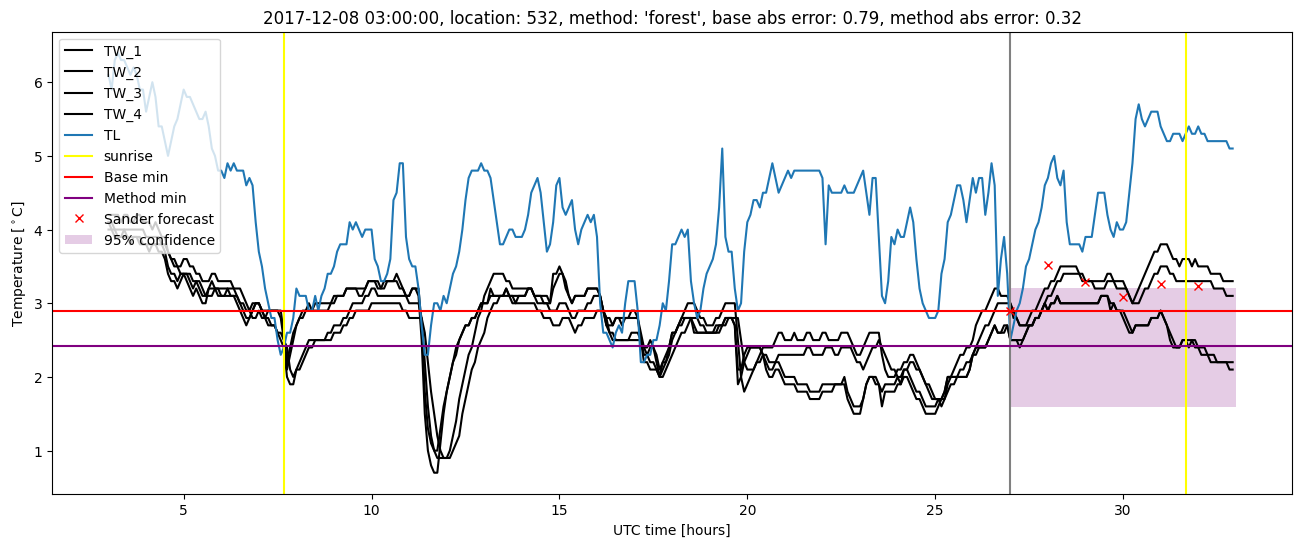
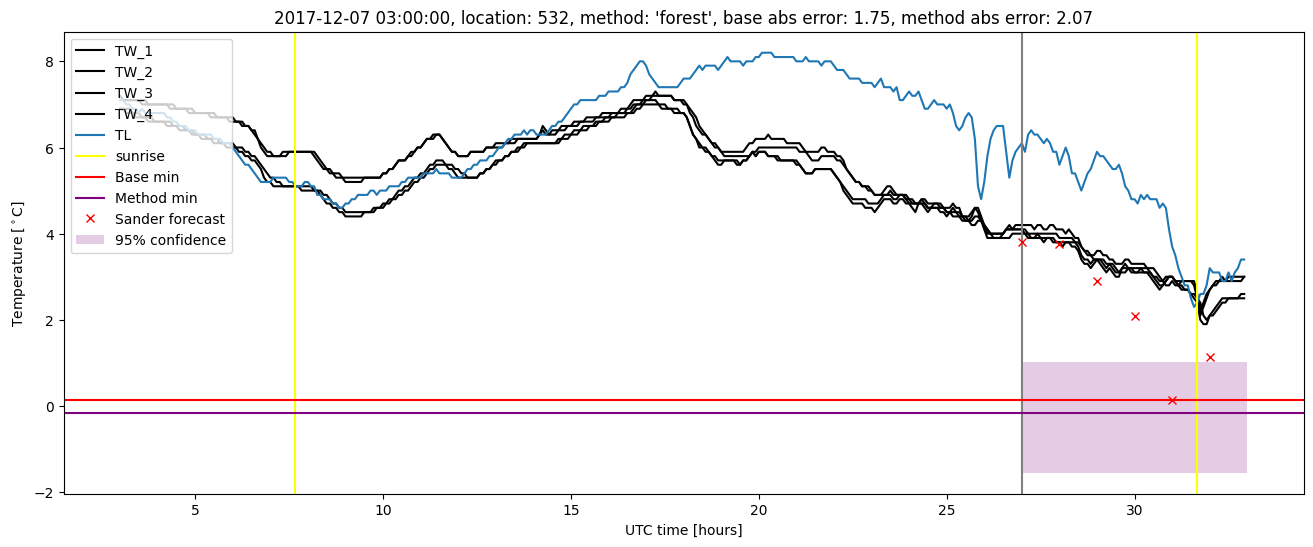
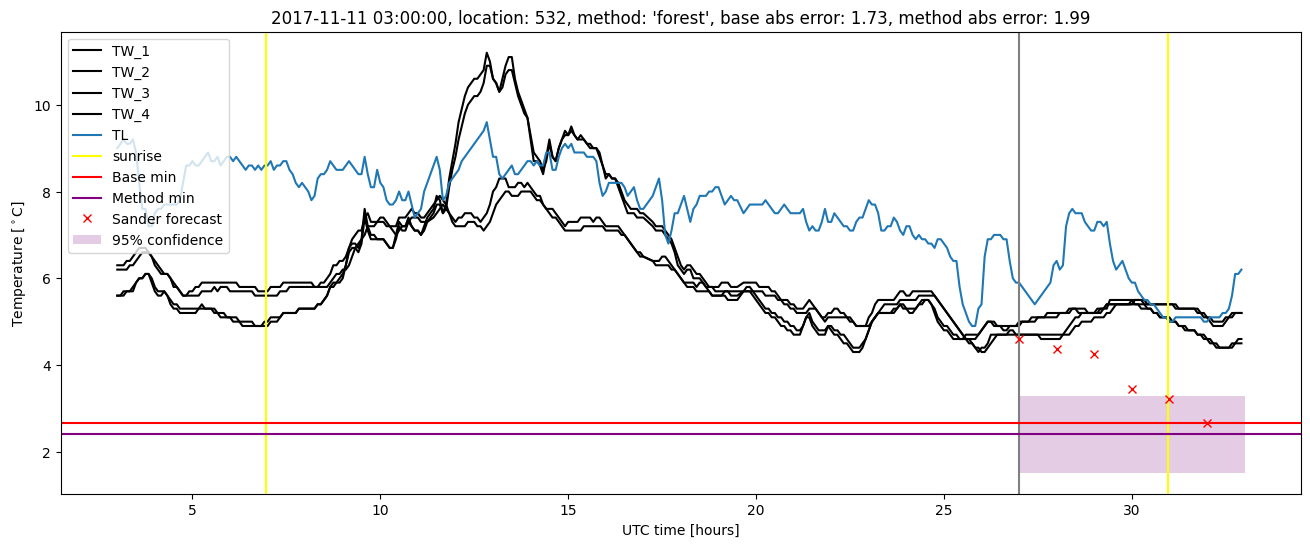
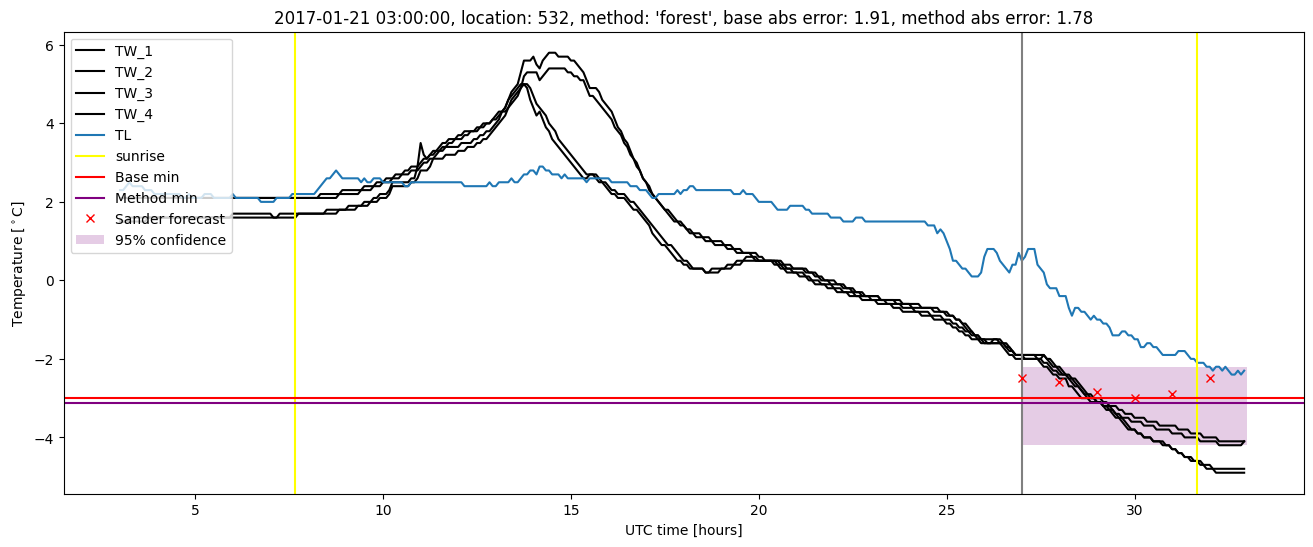
| forest |
winter 2017 |
1.000 |
0.037 |
0.348 |
0.411 |
1.776 |
0.583 |
4.687 |
| baseline |
winter 2018 |
0.978 |
0.229 |
0.411 |
0.464 |
2.599 |
NaN |
NaN |
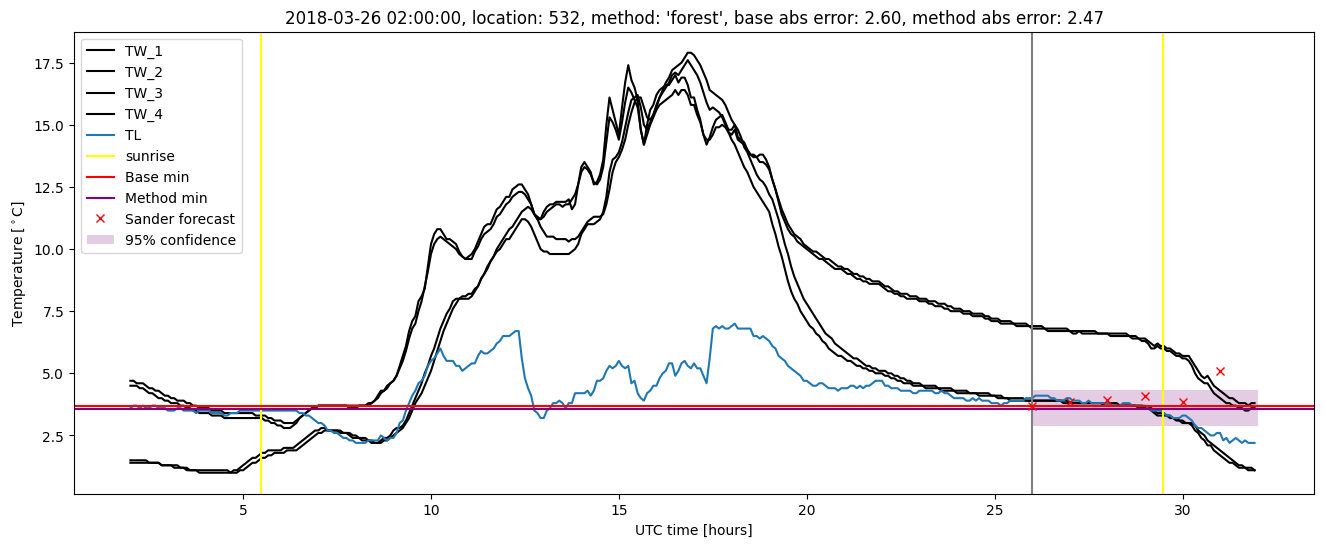
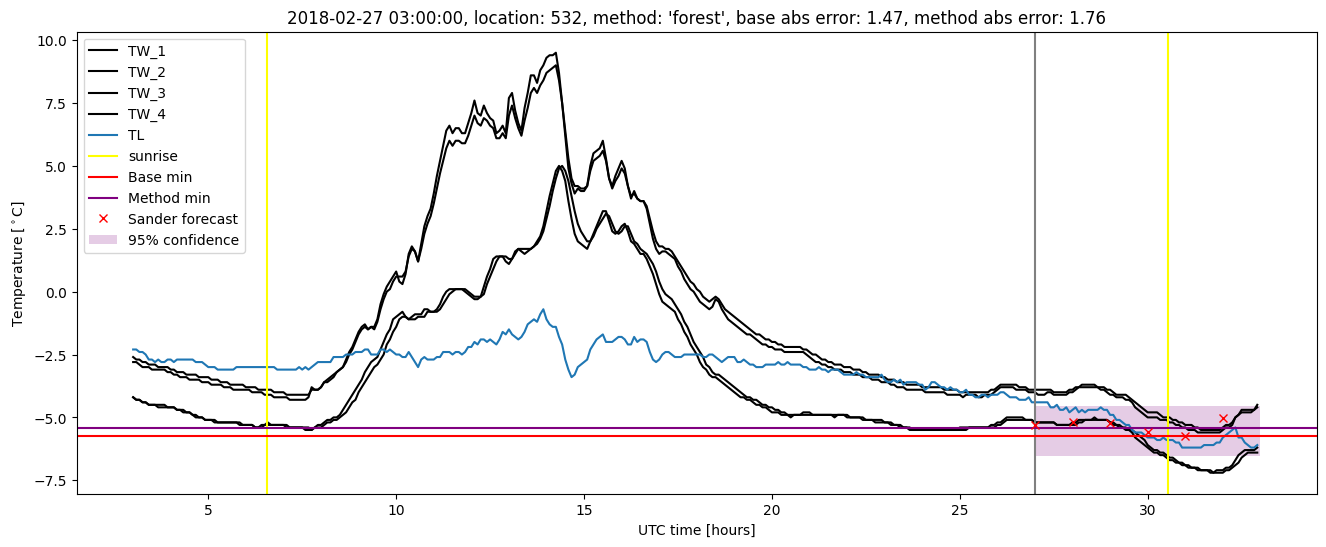
| forest |
winter 2018 |
0.957 |
0.200 |
0.385 |
0.459 |
2.467 |
0.602 |
4.933 |
| baseline |
winter 2019 |
0.993 |
0.091 |
0.303 |
0.419 |
1.991 |
NaN |
NaN |
| forest |
winter 2019 |
0.993 |
0.091 |
0.241 |
0.371 |
1.643 |
0.607 |
3.736 |
| baseline |
all |
0.987 |
0.106 |
0.365 |
0.444 |
2.599 |
NaN |
NaN |
| forest |
all |
0.983 |
0.096 |
0.313 |
0.416 |
2.467 |
0.606 |
4.272 |
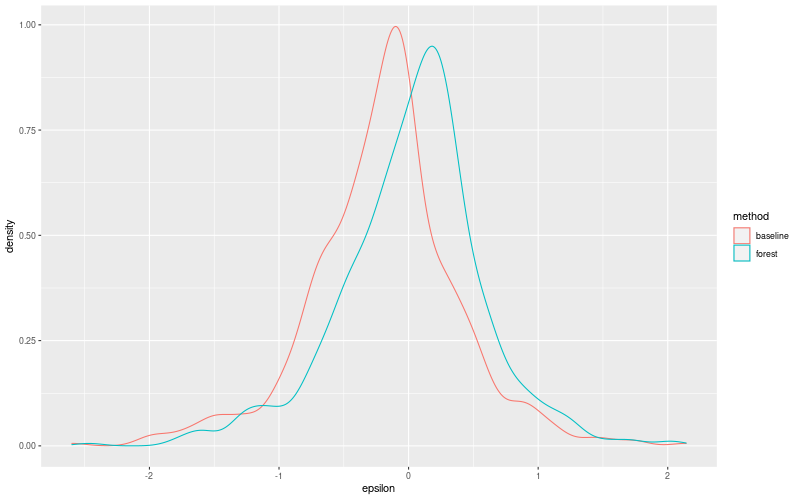
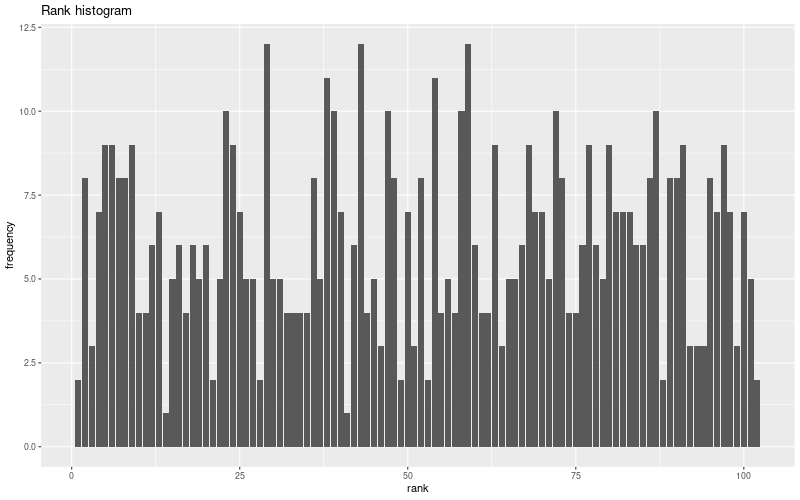
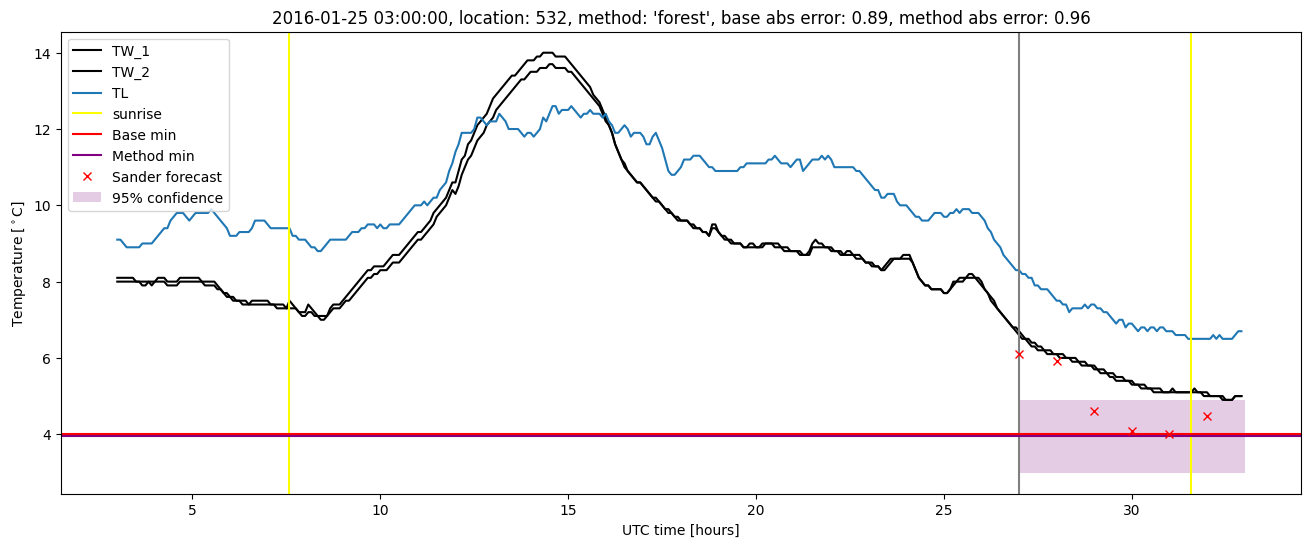
Random forest plots
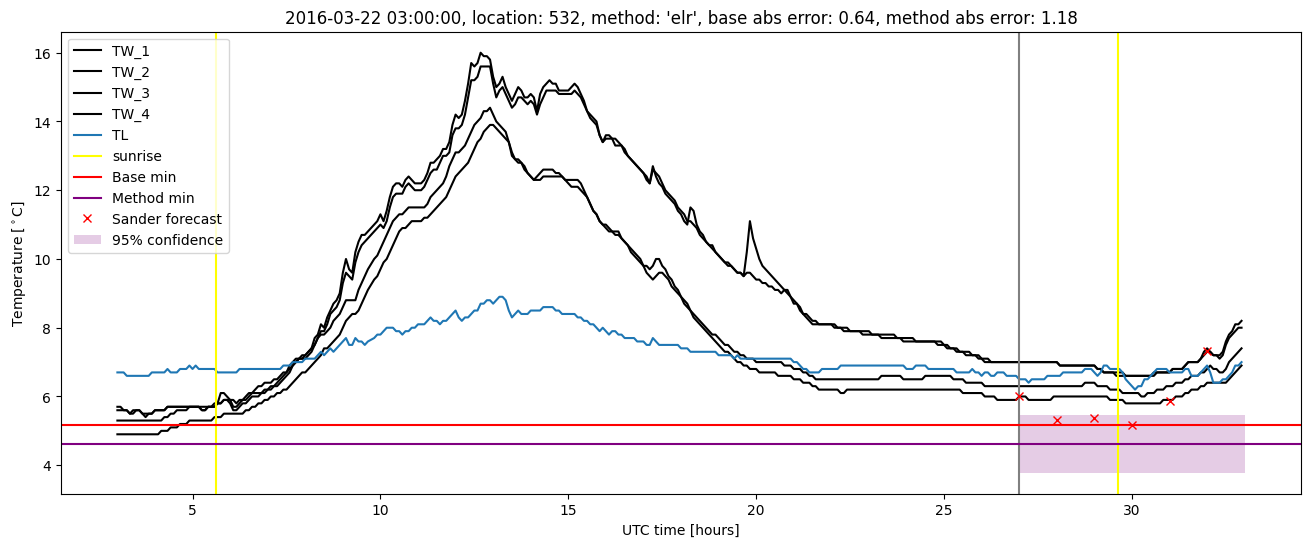
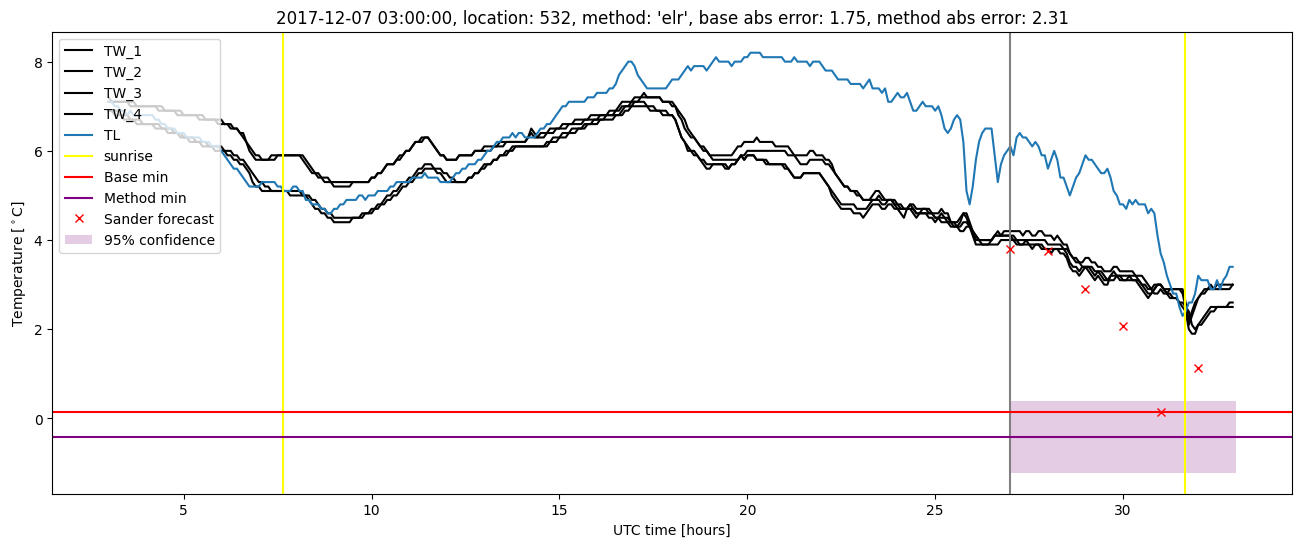
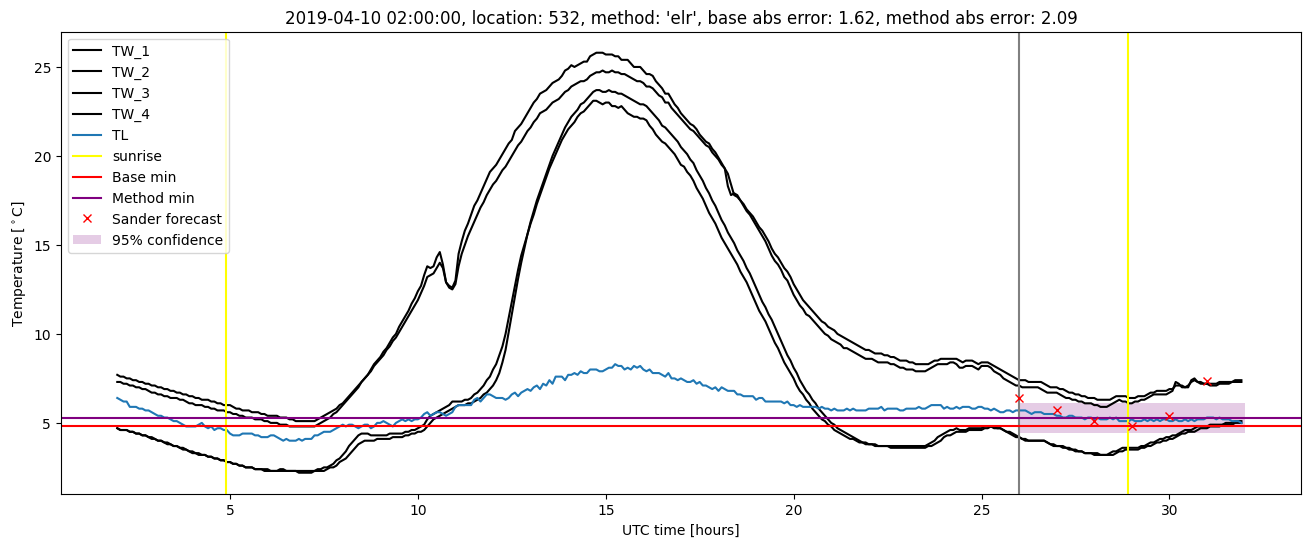
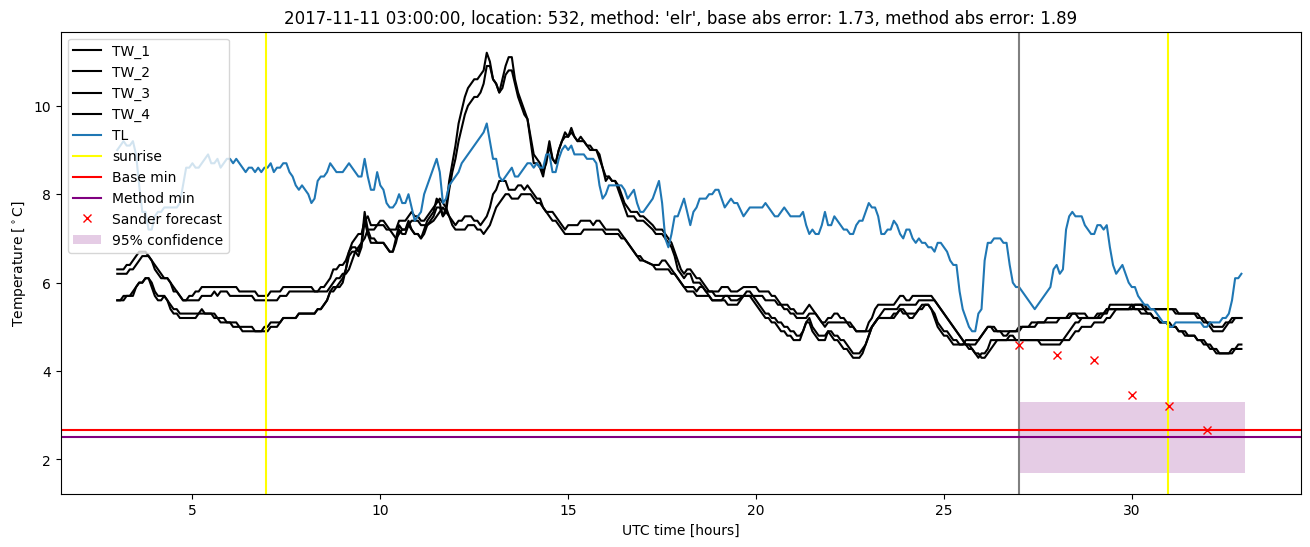
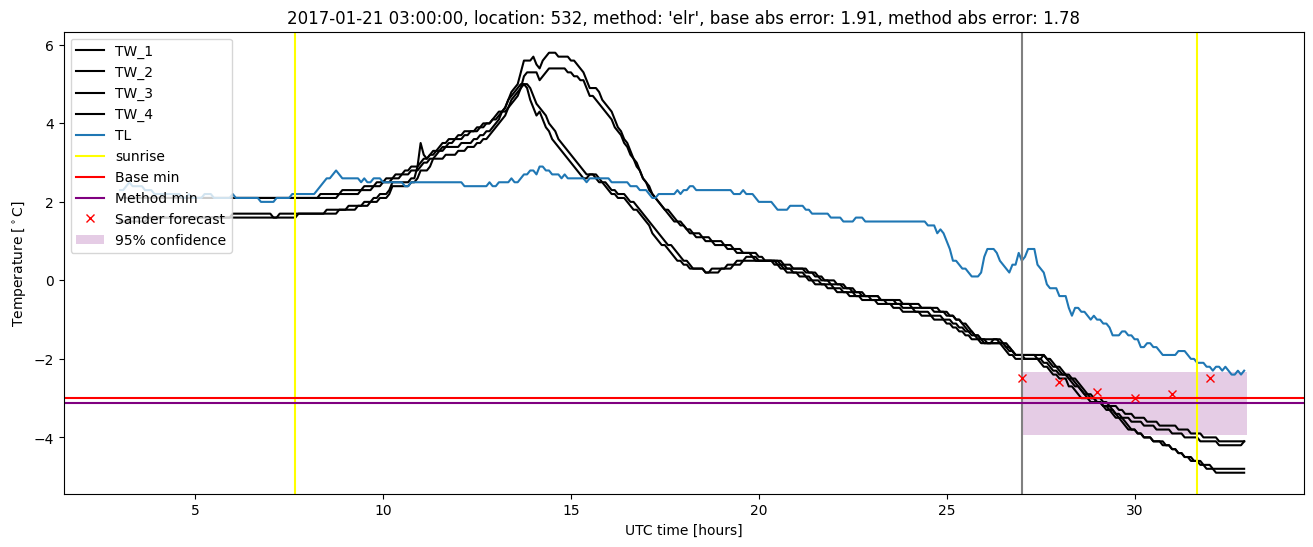
Extended logistic regression results
| names |
period |
power |
significance |
meanSquareError |
absError |
maxError |
CRPS |
IGN |
| baseline |
winter 2016 |
0.989 |
0.000e+00 |
0.338 |
0.434 |
2.045 |
NaN |
NaN |
| elr |
winter 2016 |
0.994 |
0.048 |
0.305 |
0.435 |
1.746 |
0.675 |
7.489 |
| baseline |
winter 2017 |
0.985 |
0.037 |
0.447 |
0.473 |
2.142 |
NaN |
NaN |
| elr |
winter 2017 |
1.000 |
0.000e+00 |
0.359 |
0.426 |
1.777 |
0.661 |
8.359 |
| baseline |
winter 2018 |
0.978 |
0.229 |
0.411 |
0.464 |
2.599 |
NaN |
NaN |
| elr |
winter 2018 |
0.957 |
0.143 |
0.409 |
0.482 |
2.464 |
0.708 |
9.273 |
| baseline |
winter 2019 |
0.993 |
0.091 |
0.303 |
0.419 |
1.991 |
NaN |
NaN |
| elr |
winter 2019 |
1.000 |
0.000e+00 |
0.269 |
0.390 |
2.086 |
0.682 |
7.403 |
| baseline |
all |
0.987 |
0.106 |
0.365 |
0.444 |
2.599 |
NaN |
NaN |
| elr |
all |
0.987 |
0.064 |
0.333 |
0.435 |
2.464 |
0.684 |
8.090 |
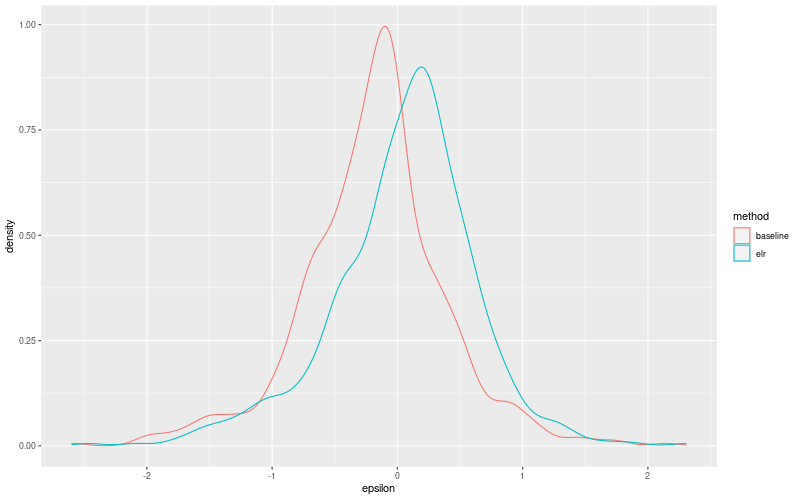
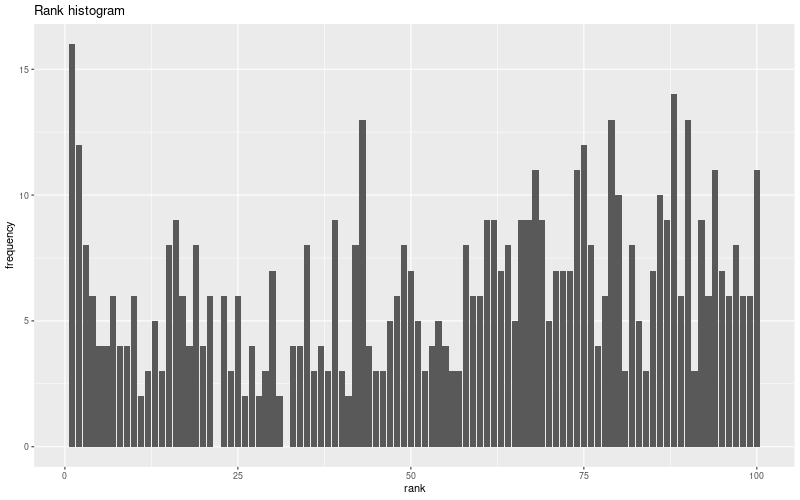
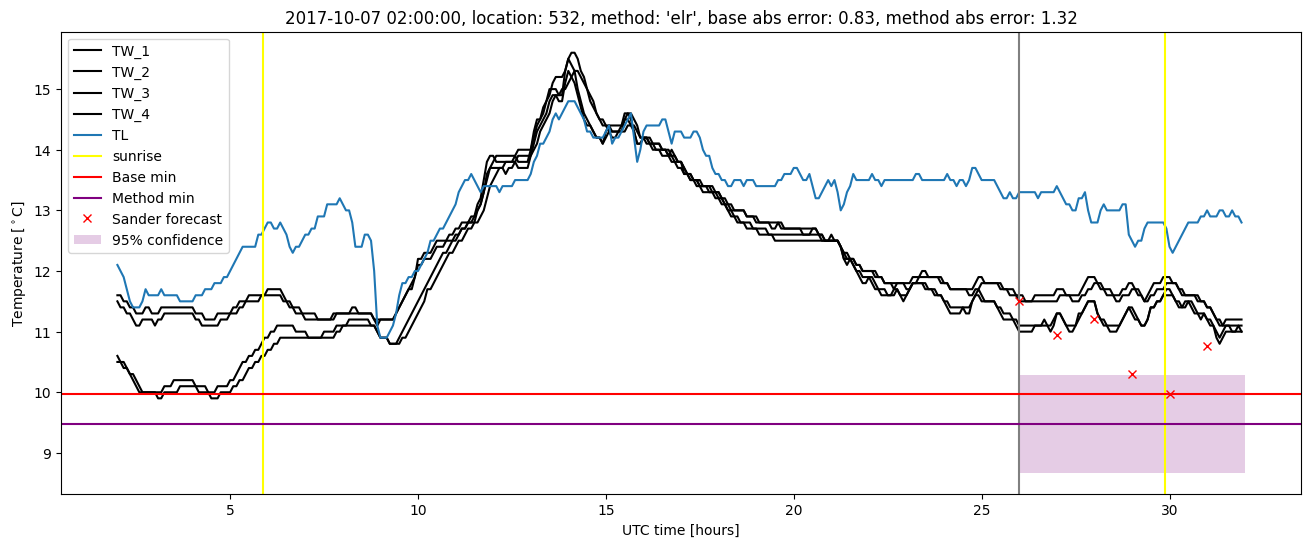
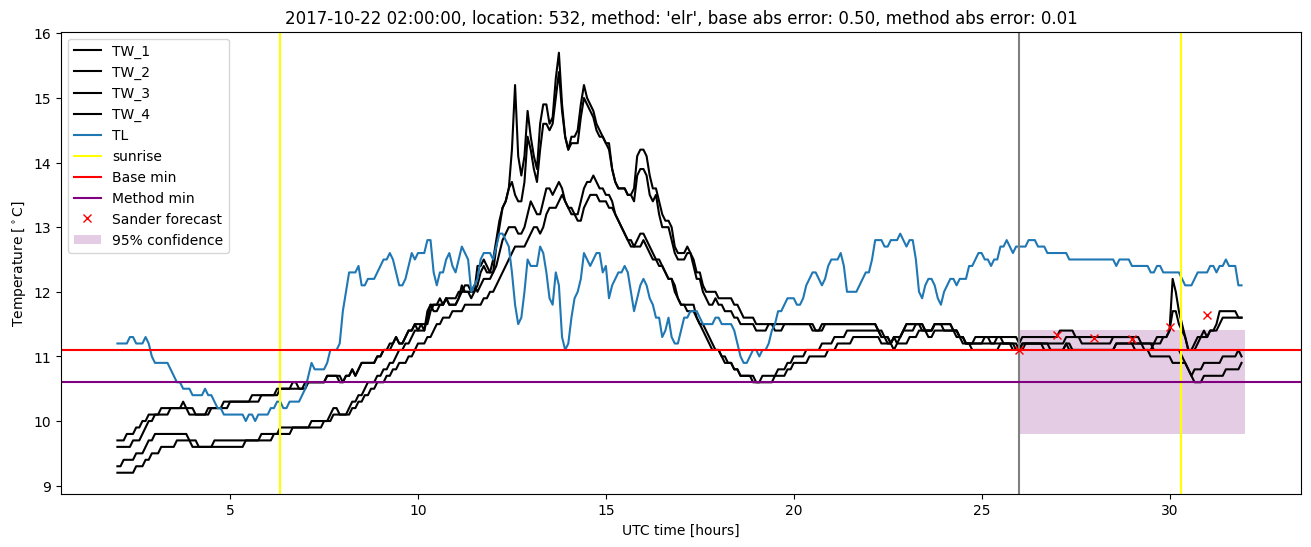
Extended logistic regression plots