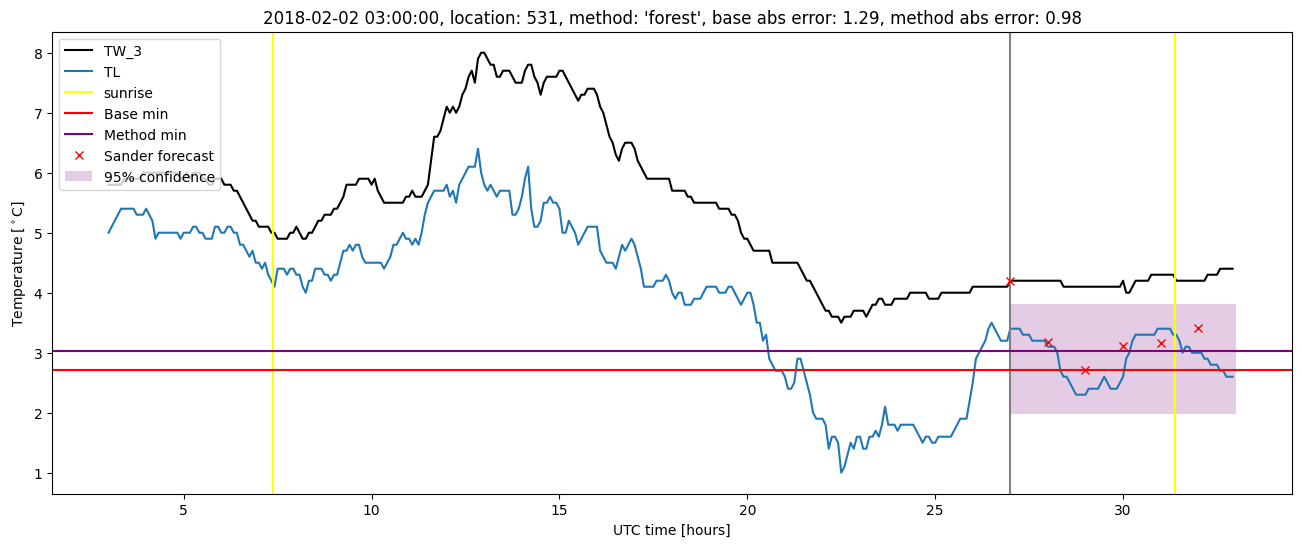
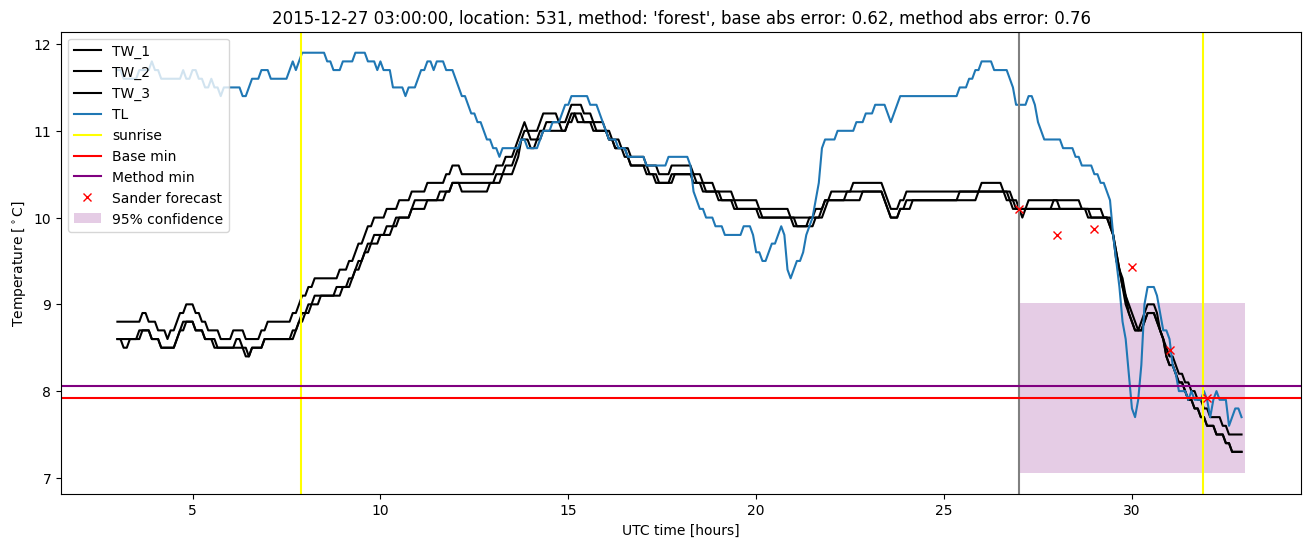
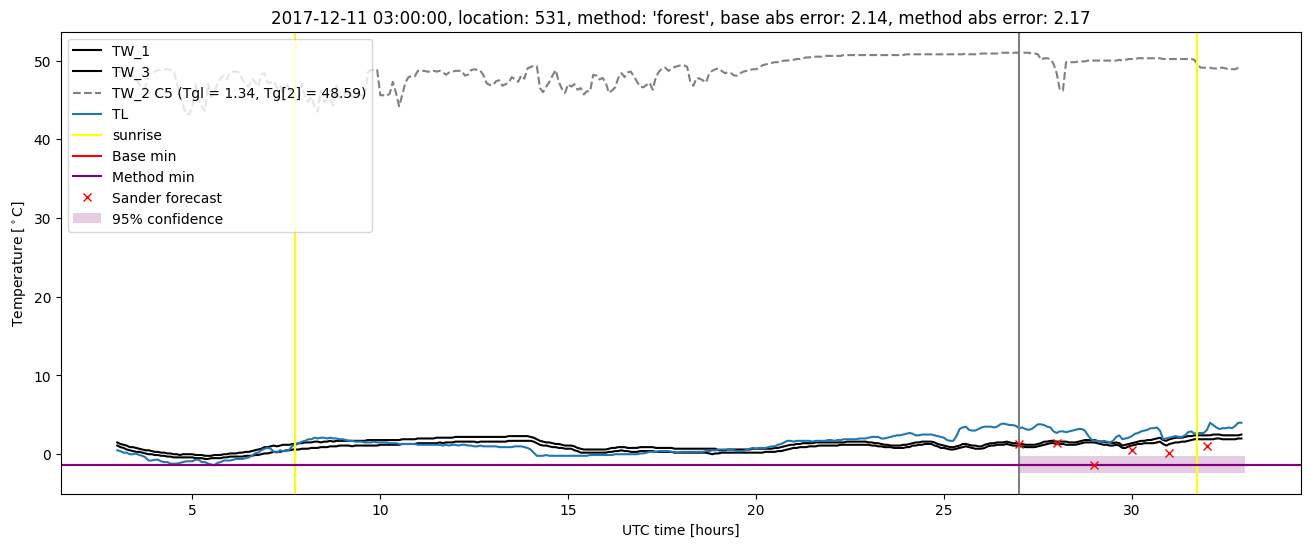
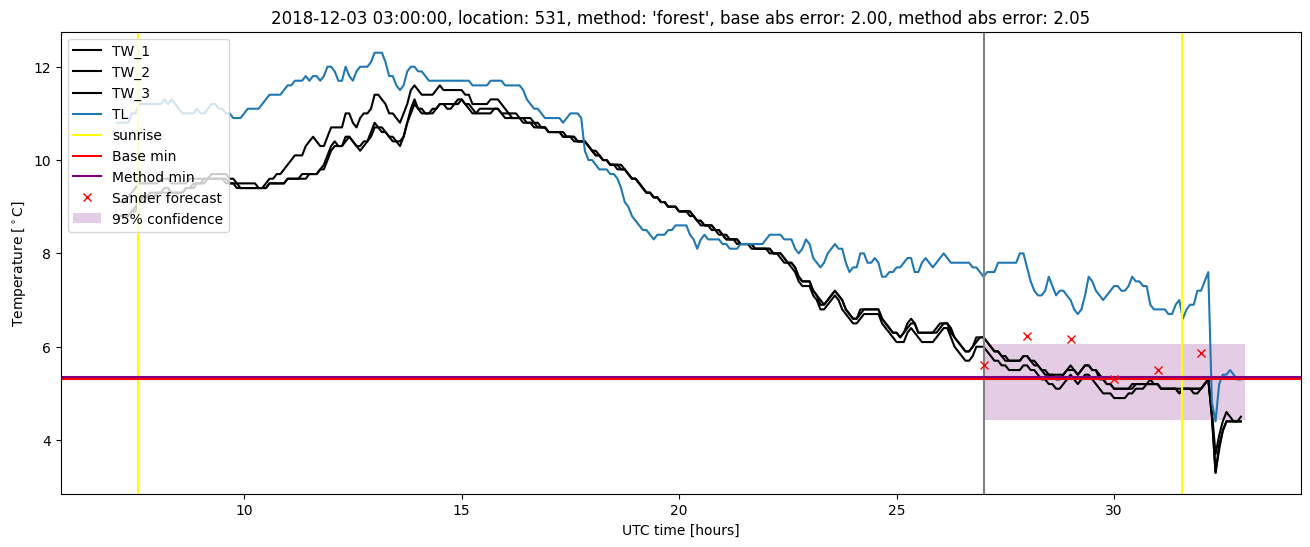
GMS location: 531
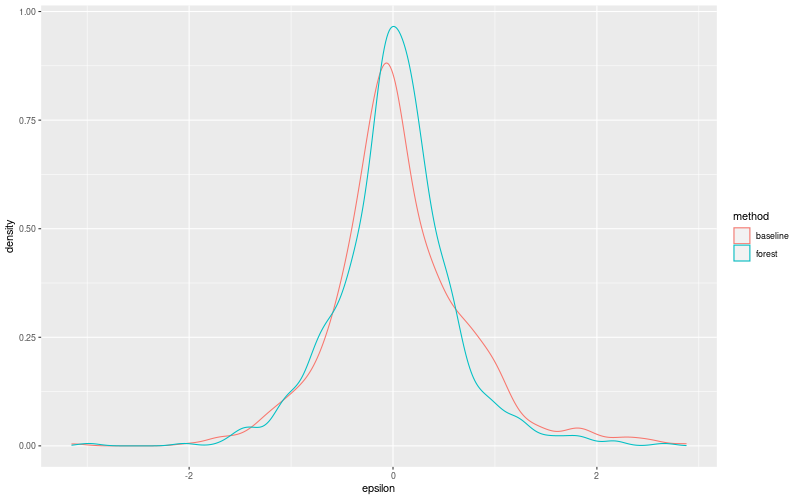
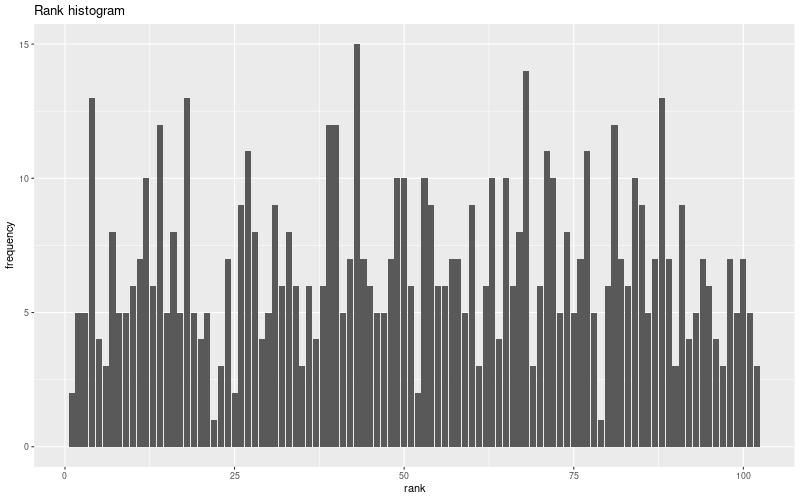
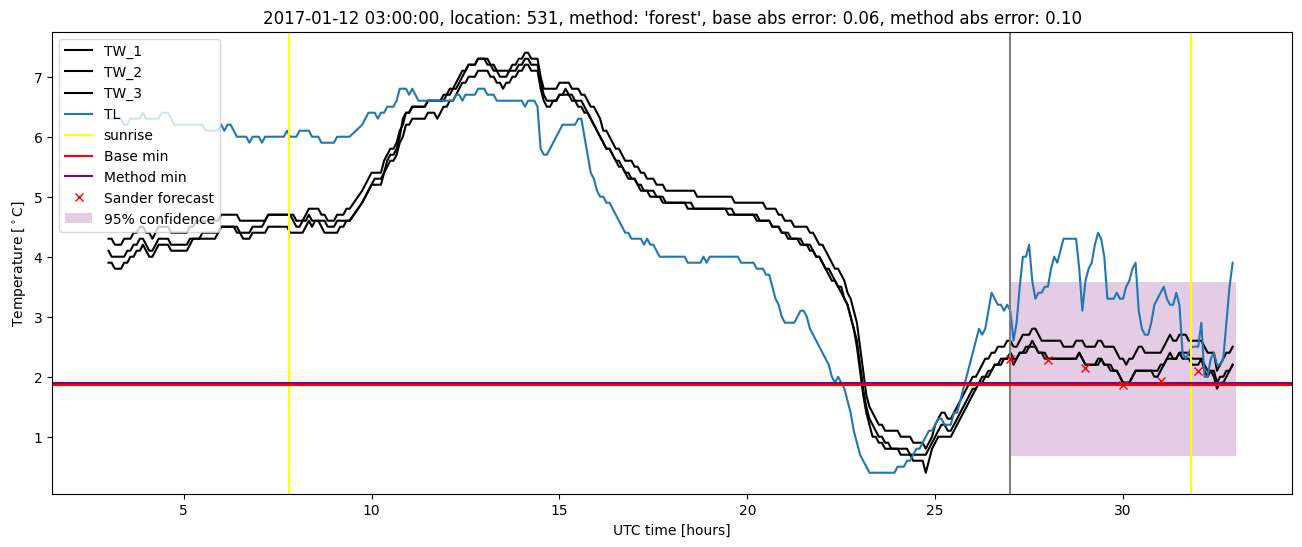
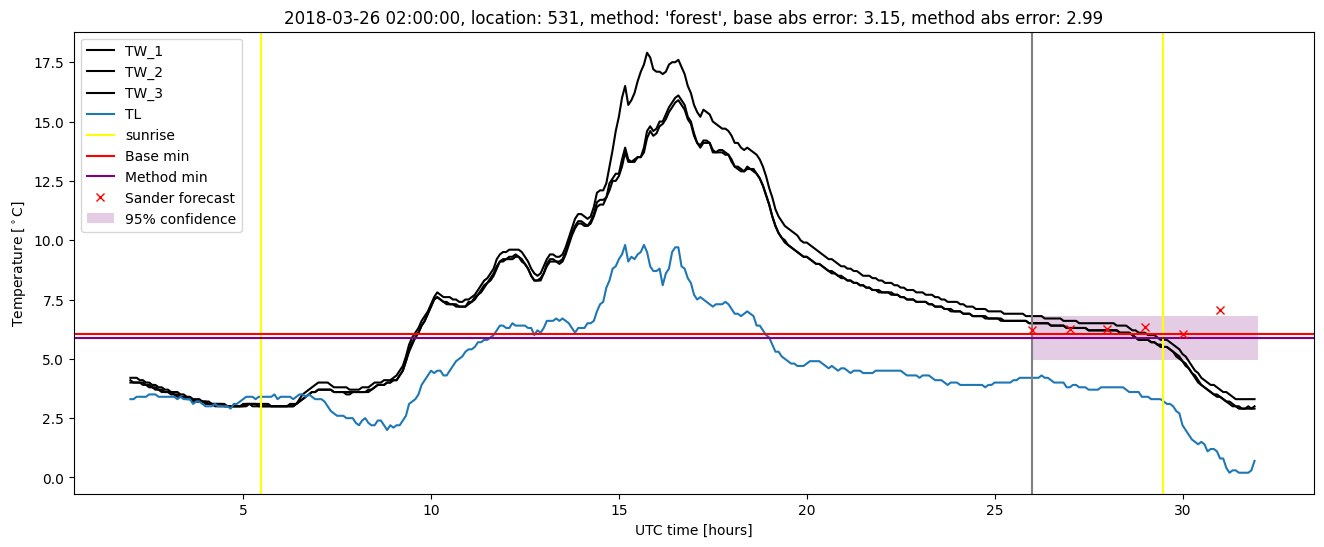
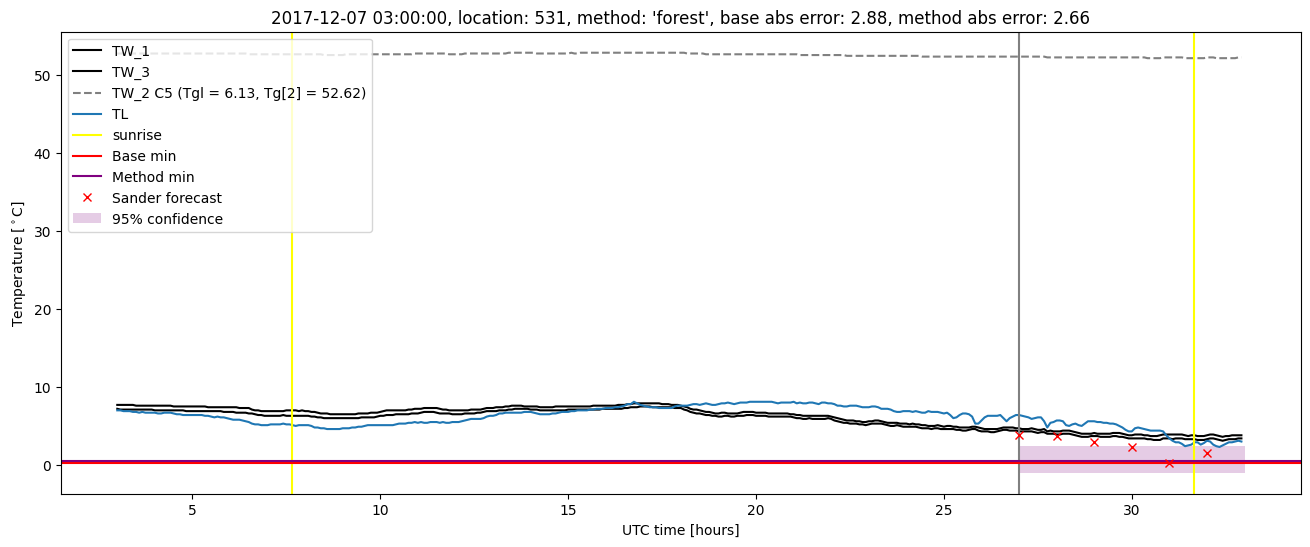
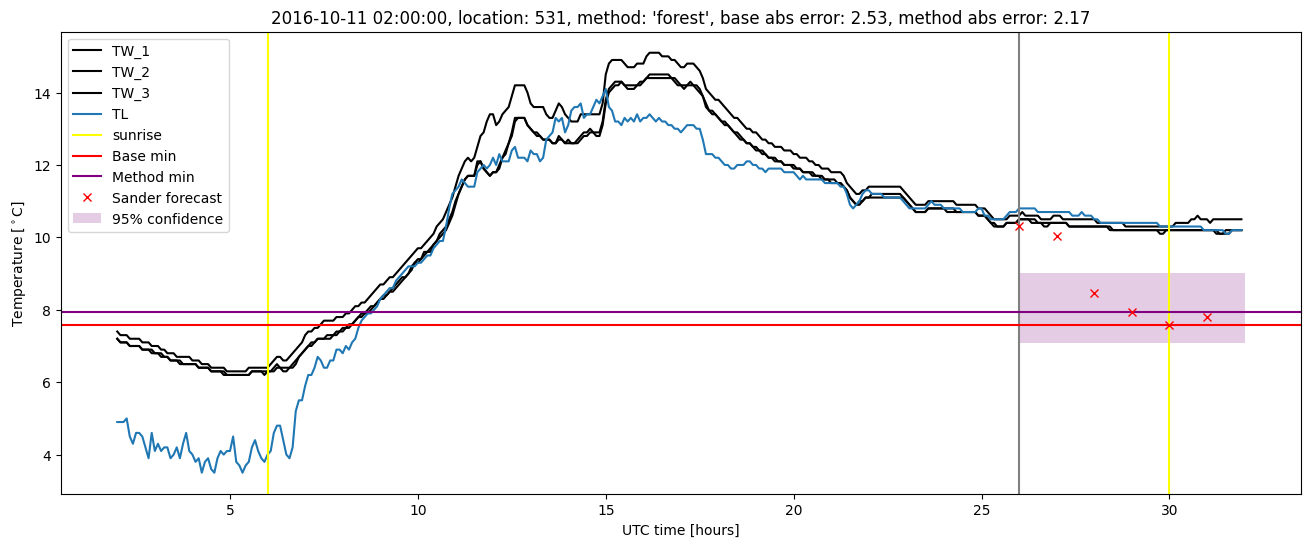
Random forest results
| names |
period |
power |
significance |
meanSquareError |
absError |
maxError |
CRPS |
IGN |
| baseline |
winter 2016 |
0.995 |
0.091 |
0.341 |
0.430 |
2.017 |
NaN |
NaN |
| forest |
winter 2016 |
1.000 |
0.136 |
0.276 |
0.390 |
1.817 |
0.452 |
2.611 |
| baseline |
winter 2017 |
0.953 |
0.042 |
0.541 |
0.531 |
2.526 |
NaN |
NaN |
| forest |
winter 2017 |
0.969 |
0.042 |
0.357 |
0.440 |
2.171 |
0.457 |
3.752 |
| baseline |
winter 2018 |
0.981 |
0.059 |
0.638 |
0.556 |
3.150 |
NaN |
NaN |
| forest |
winter 2018 |
0.981 |
0.059 |
0.444 |
0.455 |
2.985 |
0.465 |
2.453 |
| baseline |
winter 2019 |
0.987 |
0.000e+00 |
0.301 |
0.405 |
2.004 |
NaN |
NaN |
| forest |
winter 2019 |
0.993 |
0.100 |
0.233 |
0.356 |
2.046 |
0.472 |
2.639 |
| baseline |
all |
0.980 |
0.055 |
0.451 |
0.478 |
3.150 |
NaN |
NaN |
| forest |
all |
0.987 |
0.082 |
0.326 |
0.410 |
2.985 |
0.461 |
2.829 |
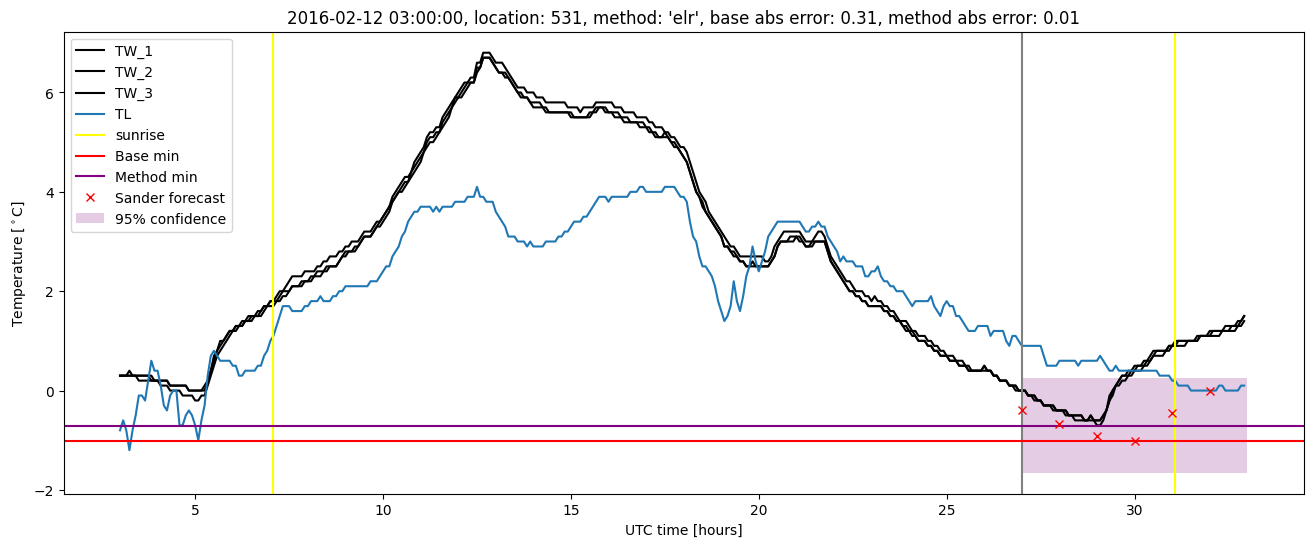
Random forest plots
Extended logistic regression results
| names |
period |
power |
significance |
meanSquareError |
absError |
maxError |
CRPS |
IGN |
| baseline |
winter 2016 |
0.995 |
0.091 |
0.341 |
0.430 |
2.017 |
NaN |
NaN |
| elr |
winter 2016 |
0.995 |
0.000e+00 |
0.302 |
0.419 |
1.690 |
0.538 |
3.274 |
| baseline |
winter 2017 |
0.953 |
0.042 |
0.541 |
0.531 |
2.526 |
NaN |
NaN |
| elr |
winter 2017 |
0.961 |
0.042 |
0.369 |
0.462 |
2.029 |
0.544 |
3.454 |
| baseline |
winter 2018 |
0.981 |
0.059 |
0.638 |
0.556 |
3.150 |
NaN |
NaN |
| elr |
winter 2018 |
0.974 |
0.059 |
0.453 |
0.459 |
3.154 |
0.538 |
3.915 |
| baseline |
winter 2019 |
0.987 |
0.000e+00 |
0.301 |
0.405 |
2.004 |
NaN |
NaN |
| elr |
winter 2019 |
0.993 |
0.100 |
0.268 |
0.401 |
1.973 |
0.517 |
2.831 |
| baseline |
all |
0.980 |
0.055 |
0.451 |
0.478 |
3.150 |
NaN |
NaN |
| elr |
all |
0.982 |
0.041 |
0.347 |
0.435 |
3.154 |
0.534 |
3.373 |
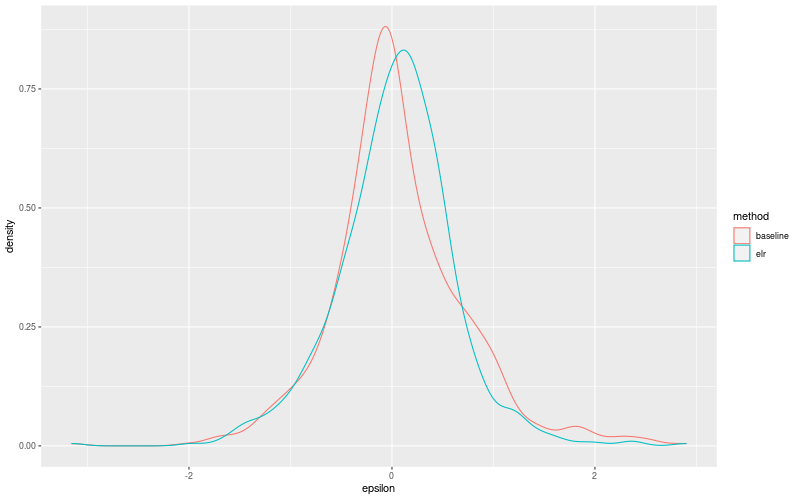
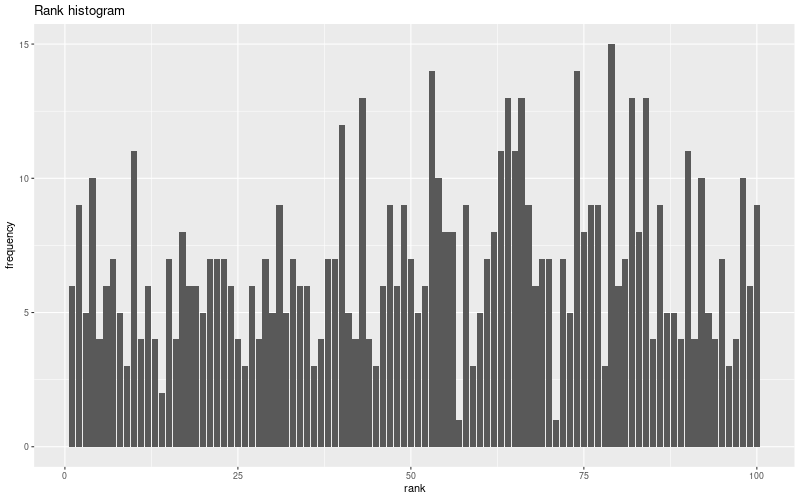
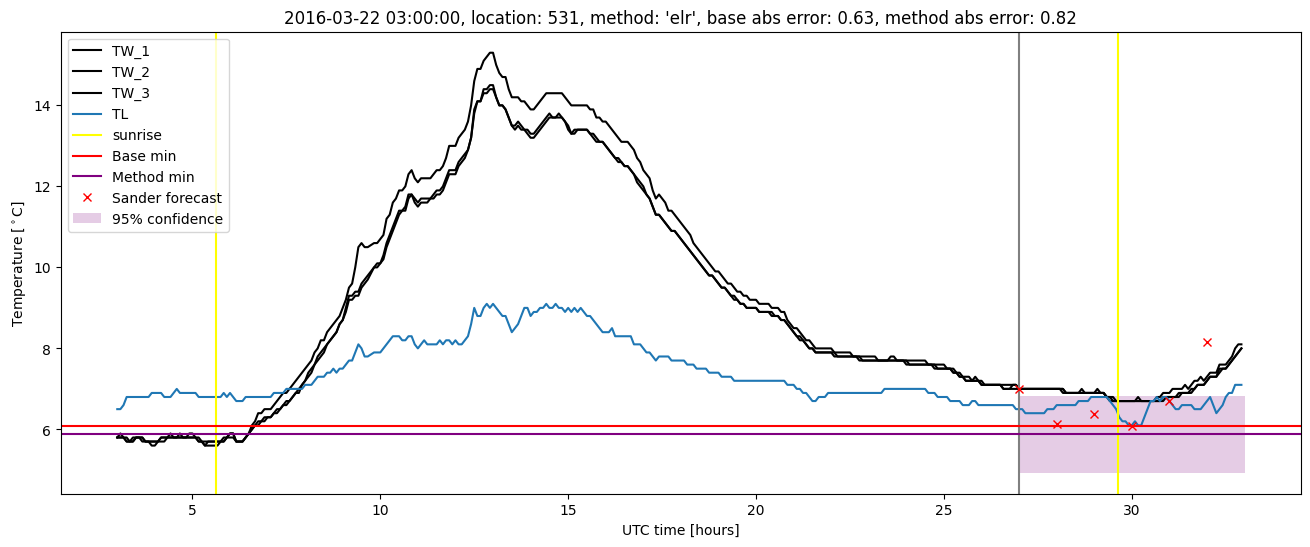
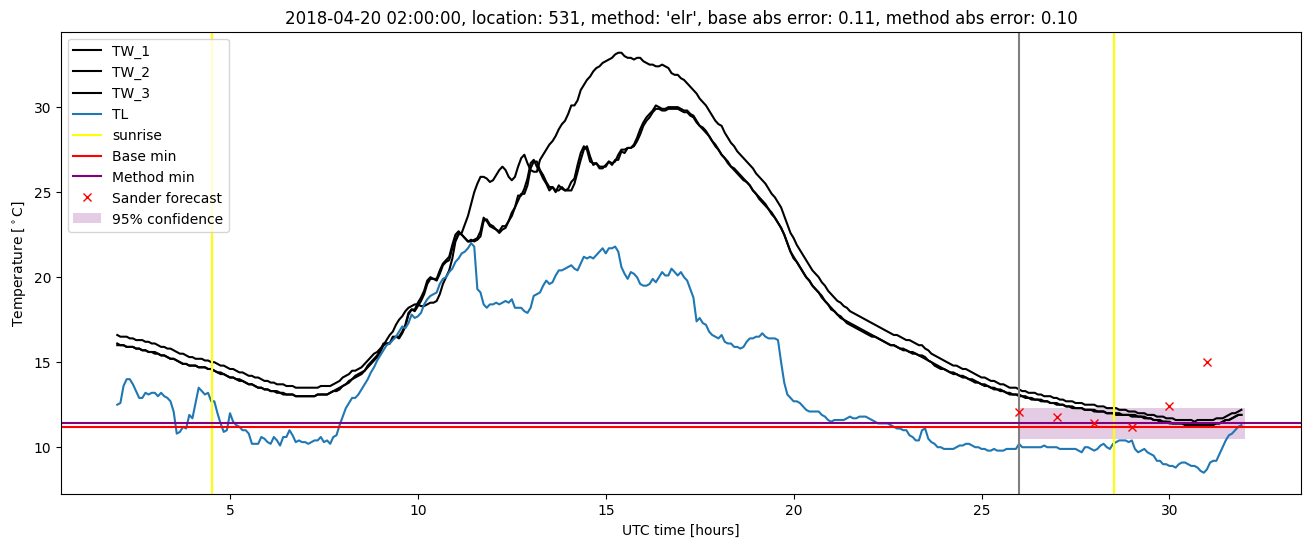
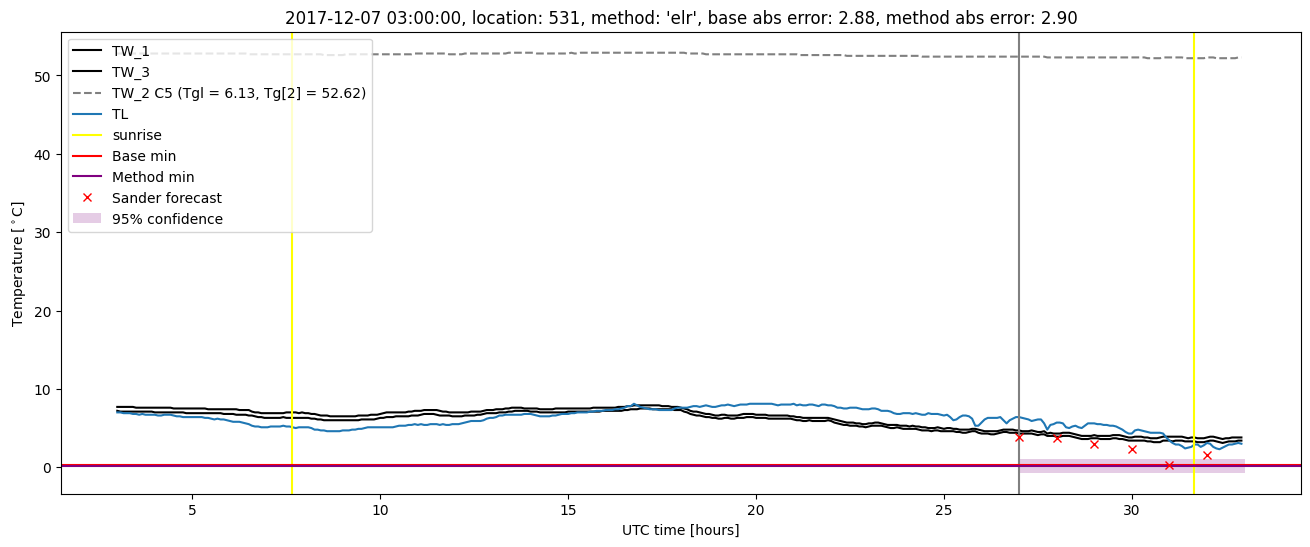
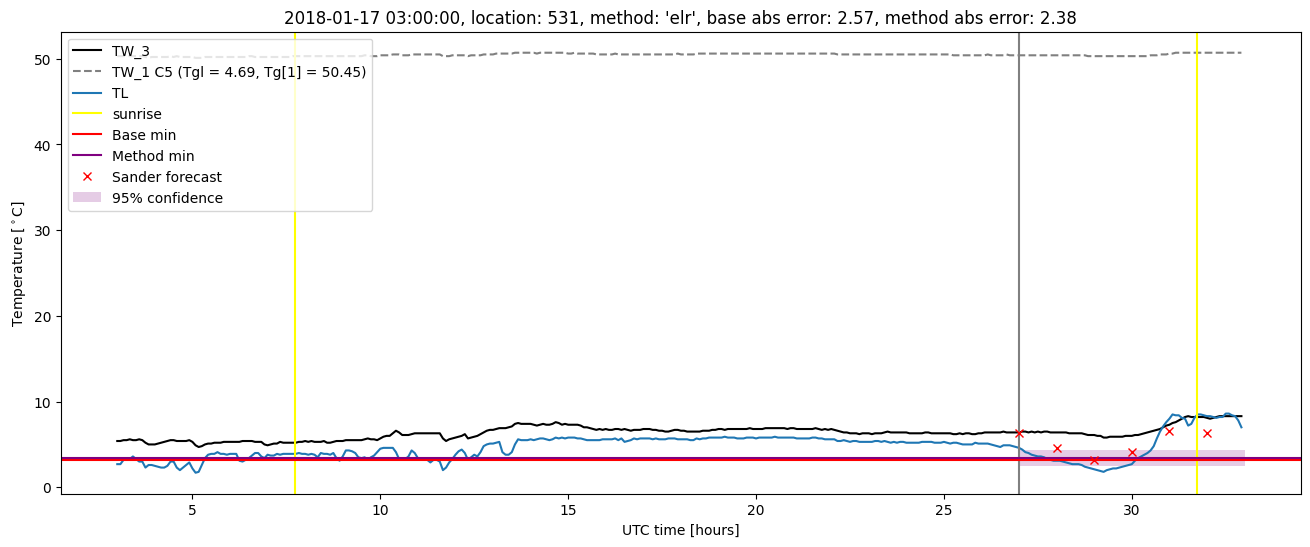
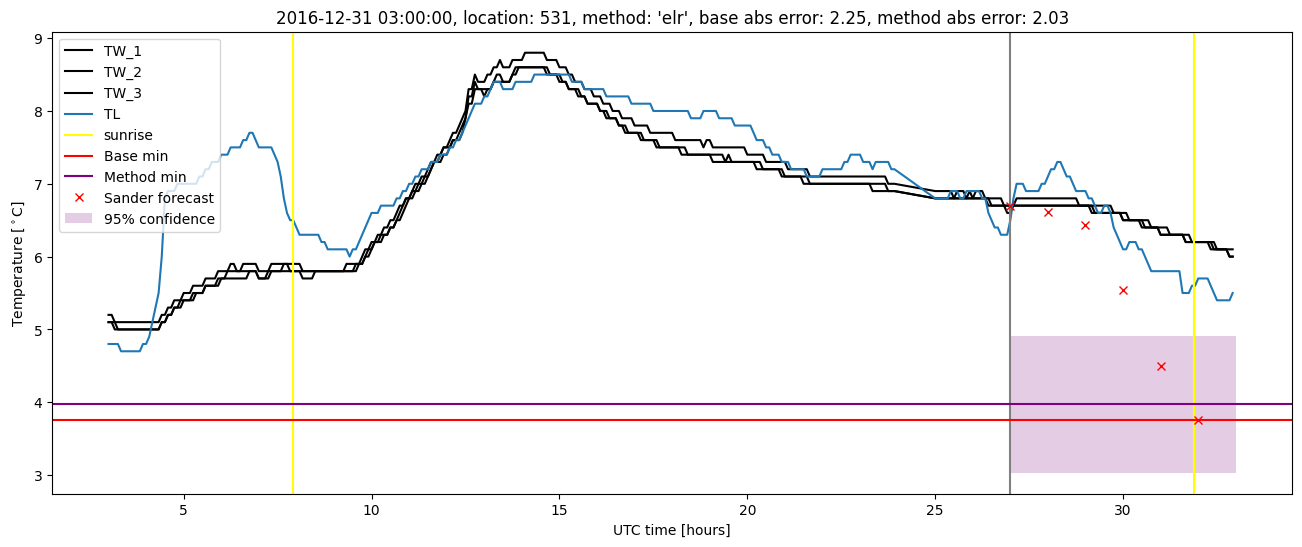
Extended logistic regression plots