GMS location: 530
Random forest results
| names |
period |
power |
significance |
meanSquareError |
absError |
maxError |
CRPS |
IGN |
| baseline |
winter 2016 |
0.979 |
0.000e+00 |
0.371 |
0.454 |
1.975 |
NaN |
NaN |
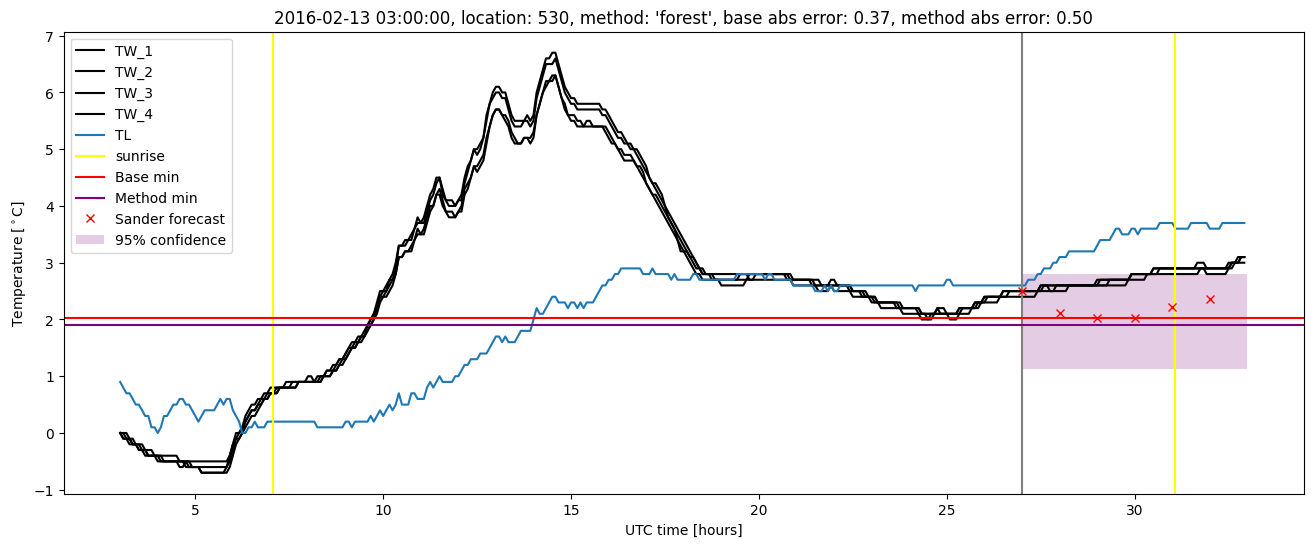
| forest |
winter 2016 |
0.989 |
0.000e+00 |
0.290 |
0.404 |
1.854 |
0.503 |
3.279 |
| baseline |
winter 2017 |
0.969 |
0.000e+00 |
0.459 |
0.484 |
2.798 |
NaN |
NaN |
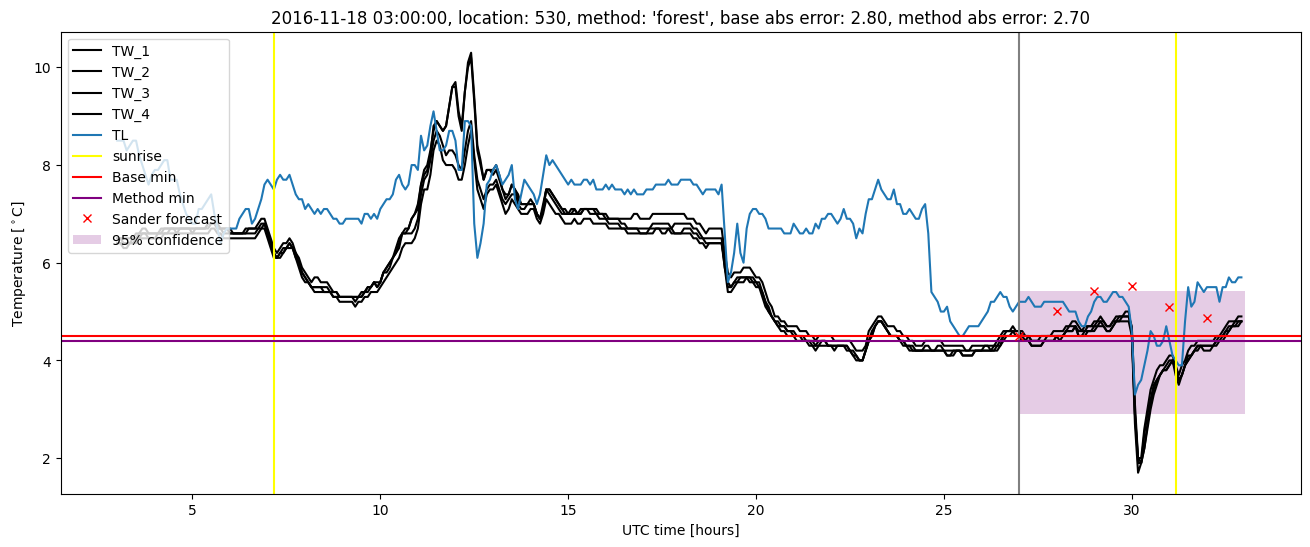
| forest |
winter 2017 |
0.977 |
0.040 |
0.343 |
0.412 |
2.701 |
0.490 |
4.184 |
| baseline |
winter 2018 |
0.987 |
0.103 |
0.375 |
0.446 |
2.220 |
NaN |
NaN |
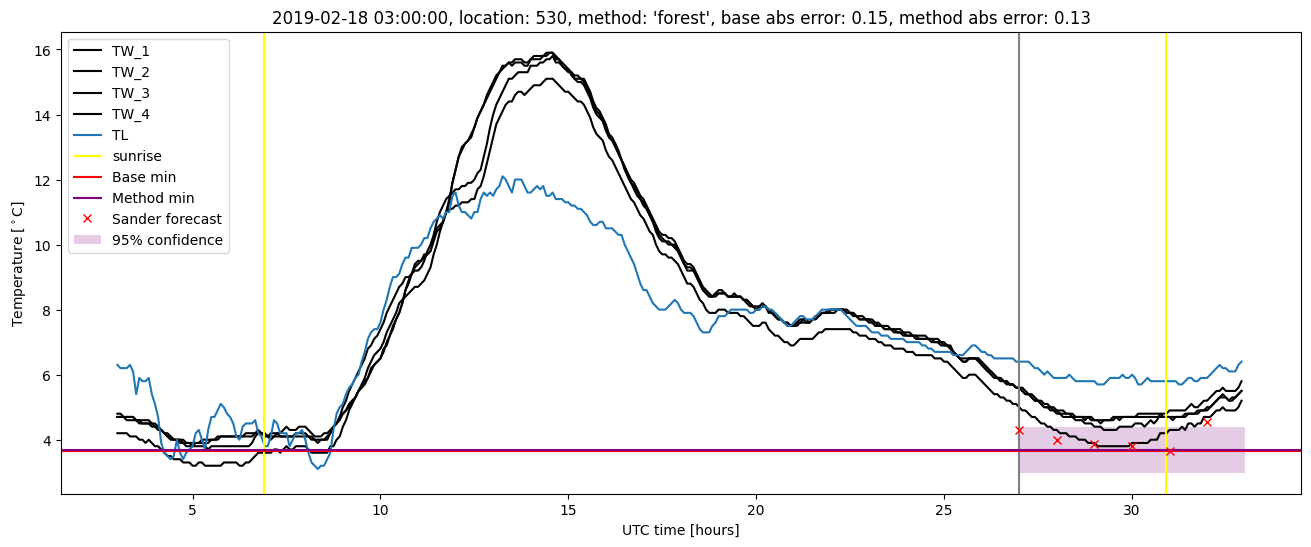
| forest |
winter 2018 |
0.994 |
0.138 |
0.326 |
0.420 |
1.983 |
0.494 |
3.045 |
| baseline |
winter 2019 |
0.985 |
0.125 |
0.262 |
0.385 |
1.789 |
NaN |
NaN |
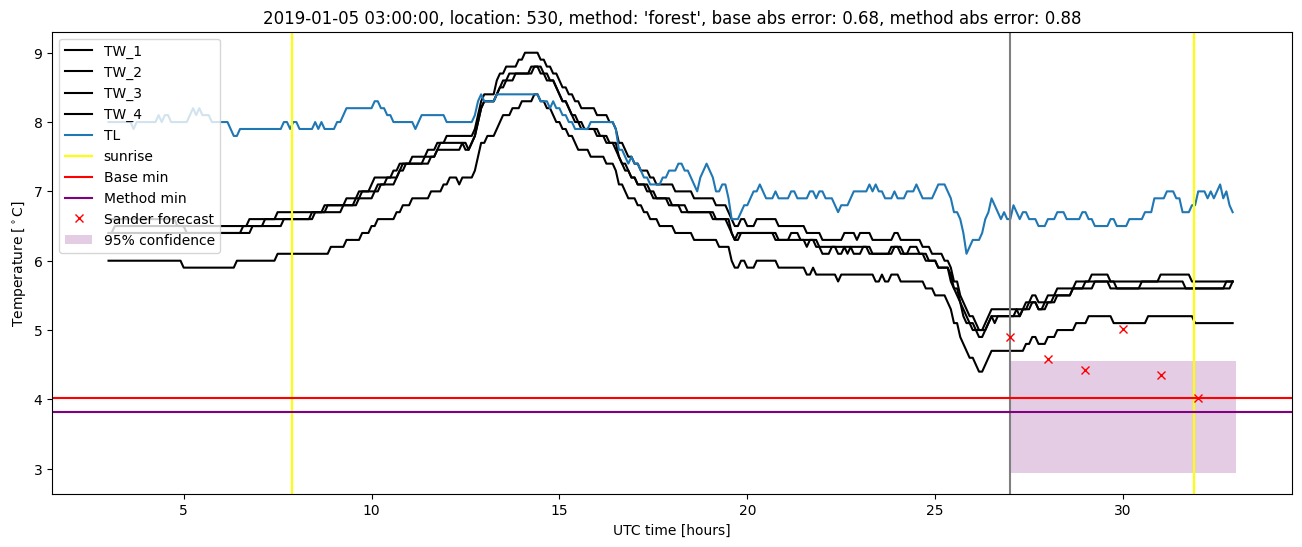
| forest |
winter 2019 |
0.992 |
0.250 |
0.201 |
0.351 |
1.587 |
0.528 |
3.476 |
| baseline |
all |
0.980 |
0.051 |
0.369 |
0.444 |
2.798 |
NaN |
NaN |
| forest |
all |
0.988 |
0.090 |
0.293 |
0.399 |
2.701 |
0.503 |
3.461 |
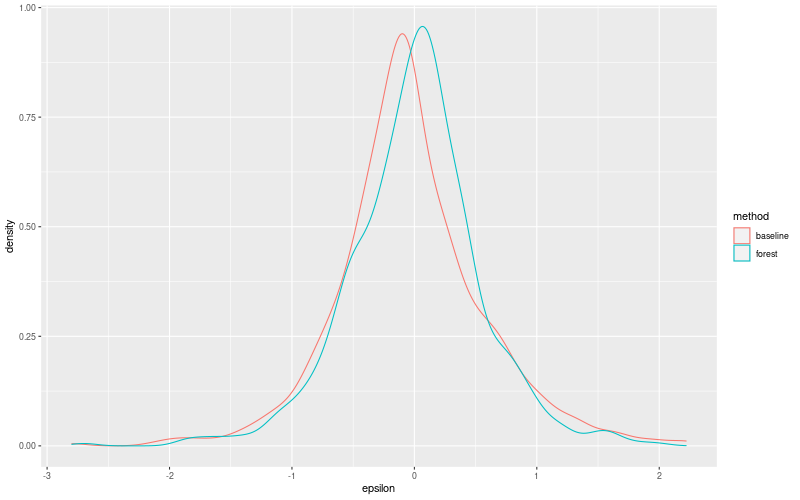
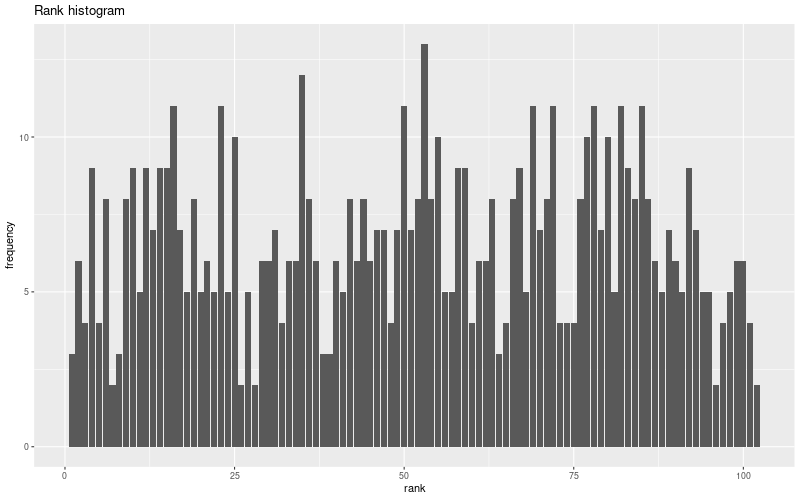
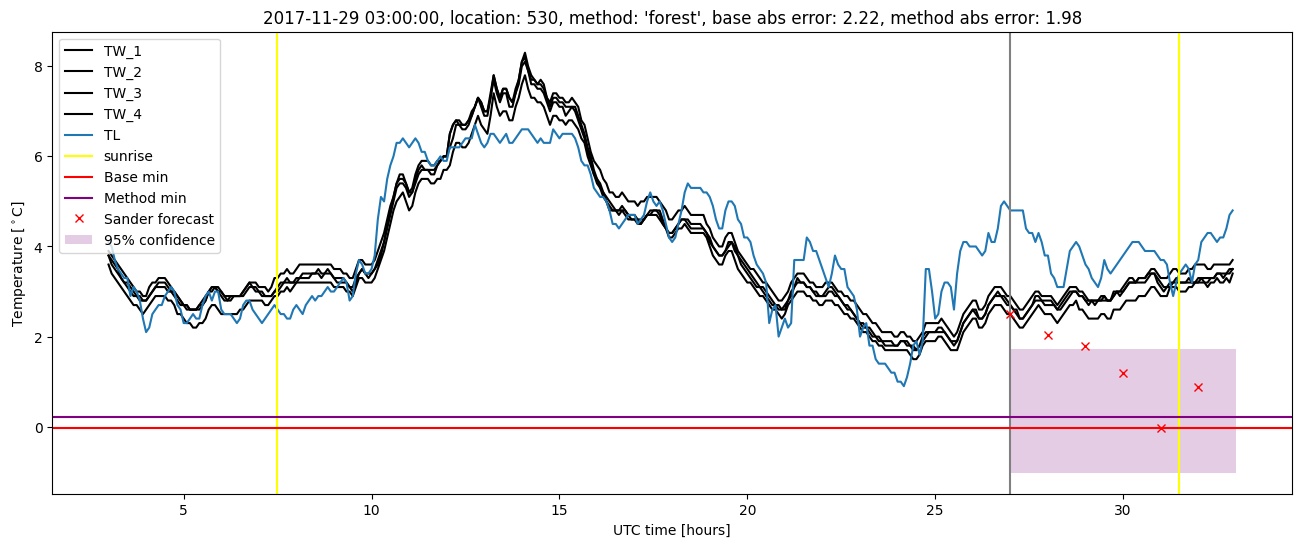
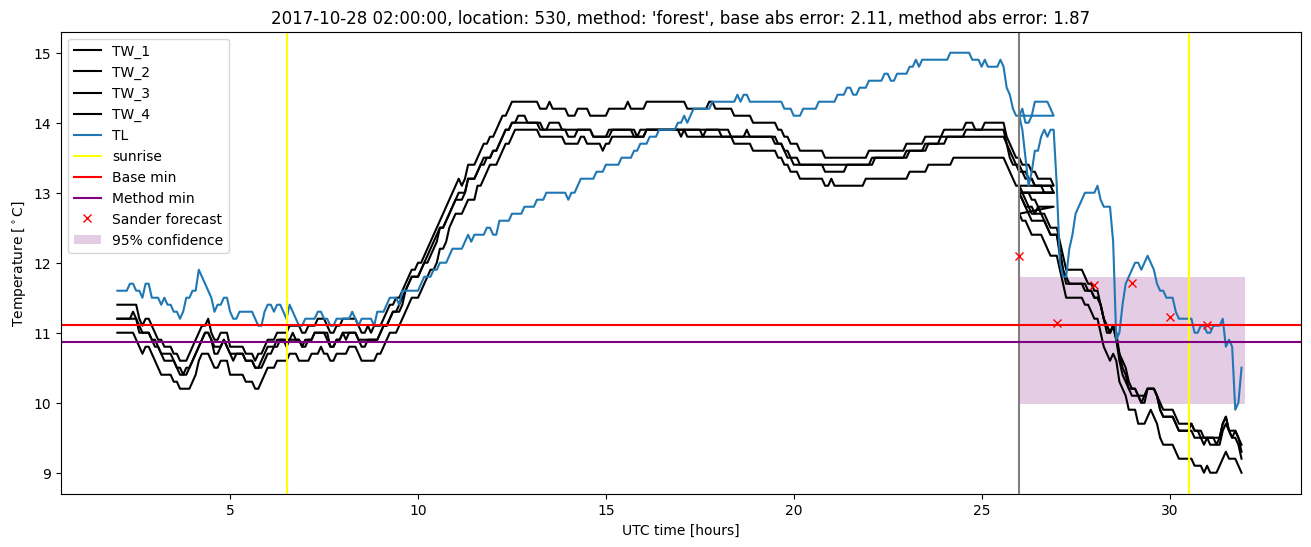
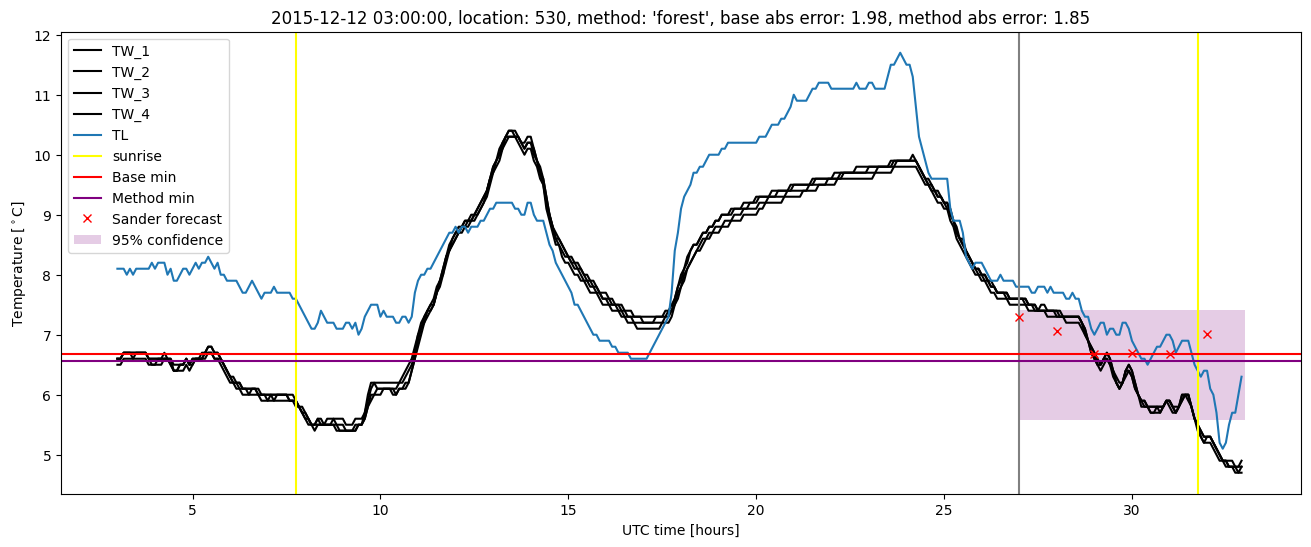
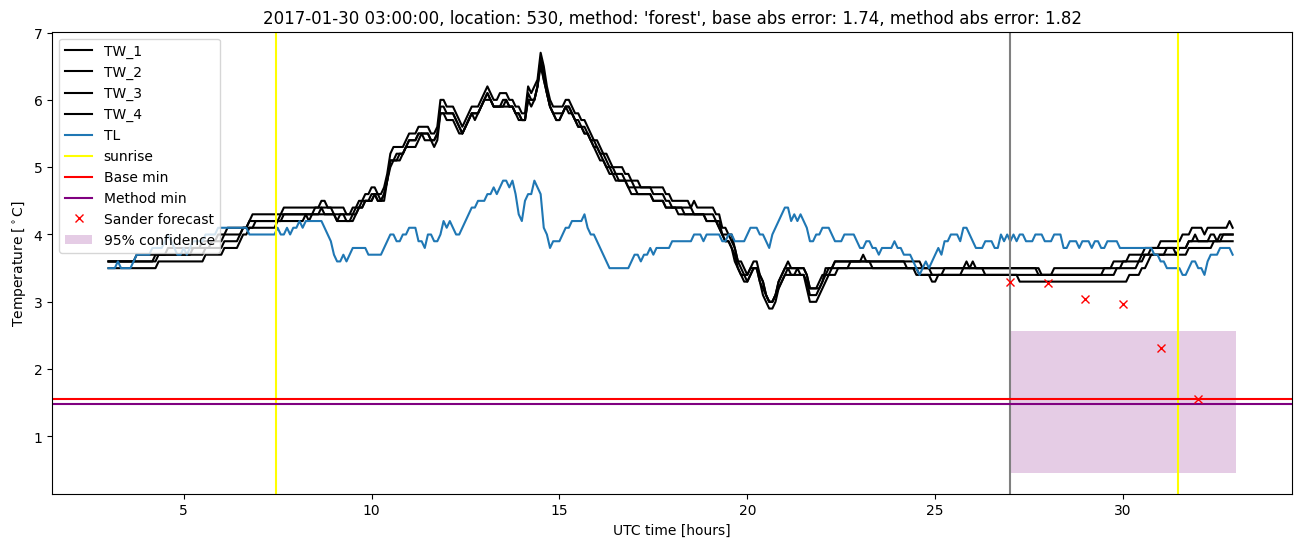
Random forest plots
Extended logistic regression results
| names |
period |
power |
significance |
meanSquareError |
absError |
maxError |
CRPS |
IGN |
| baseline |
winter 2016 |
0.979 |
0.000e+00 |
0.371 |
0.454 |
1.975 |
NaN |
NaN |
| elr |
winter 2016 |
0.979 |
0.000e+00 |
0.347 |
0.454 |
2.186 |
0.560 |
5.392 |
| baseline |
winter 2017 |
0.969 |
0.000e+00 |
0.459 |
0.484 |
2.798 |
NaN |
NaN |
| elr |
winter 2017 |
0.977 |
0.000e+00 |
0.444 |
0.491 |
2.525 |
0.568 |
5.657 |
| baseline |
winter 2018 |
0.987 |
0.103 |
0.375 |
0.446 |
2.220 |
NaN |
NaN |
| elr |
winter 2018 |
0.980 |
0.103 |
0.367 |
0.444 |
2.387 |
0.615 |
6.464 |
| baseline |
winter 2019 |
0.985 |
0.125 |
0.262 |
0.385 |
1.789 |
NaN |
NaN |
| elr |
winter 2019 |
0.985 |
0.250 |
0.191 |
0.326 |
1.481 |
0.581 |
4.165 |
| baseline |
all |
0.980 |
0.051 |
0.369 |
0.444 |
2.798 |
NaN |
NaN |
| elr |
all |
0.980 |
0.064 |
0.342 |
0.433 |
2.525 |
0.581 |
5.487 |
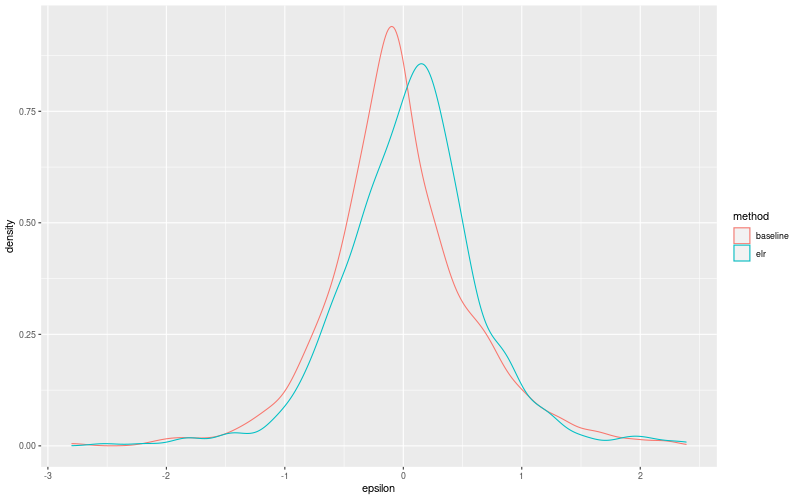
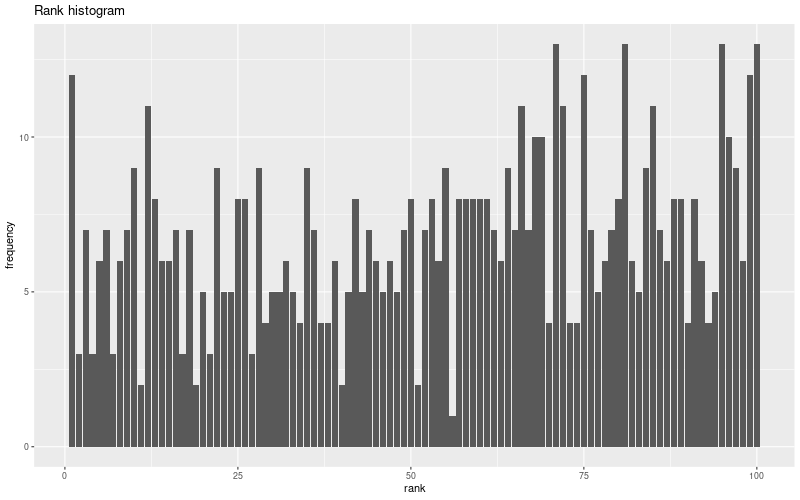
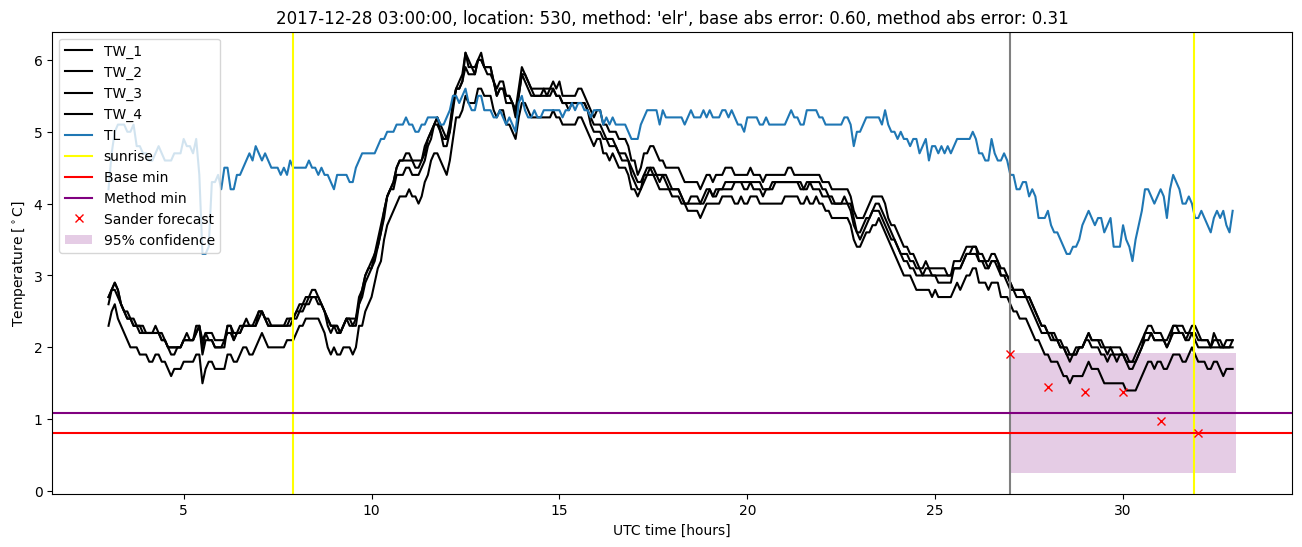
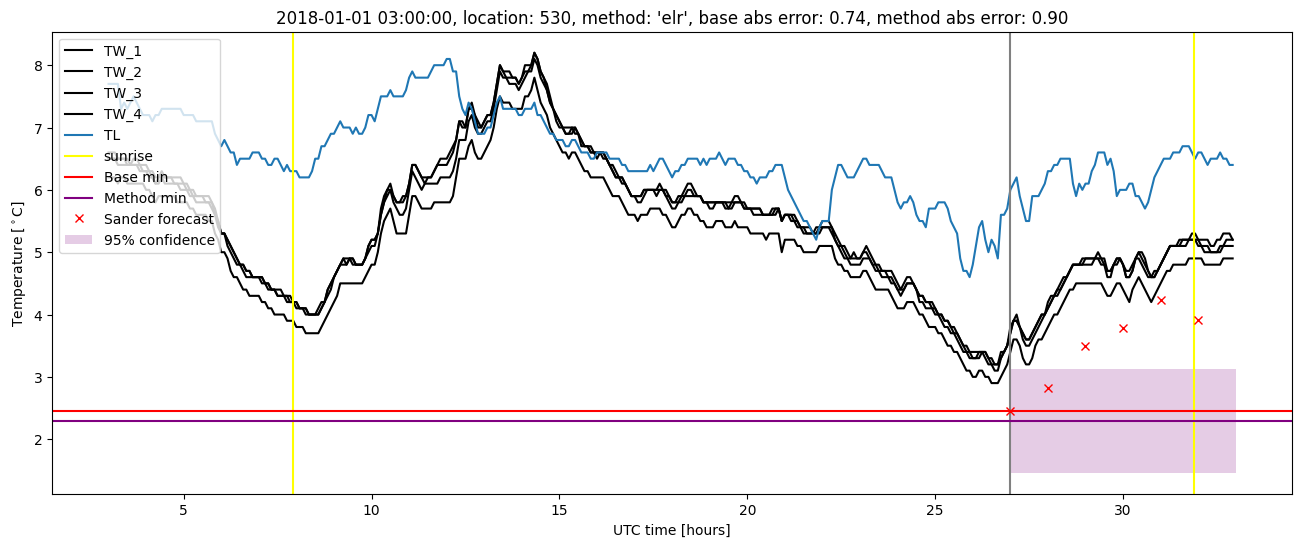
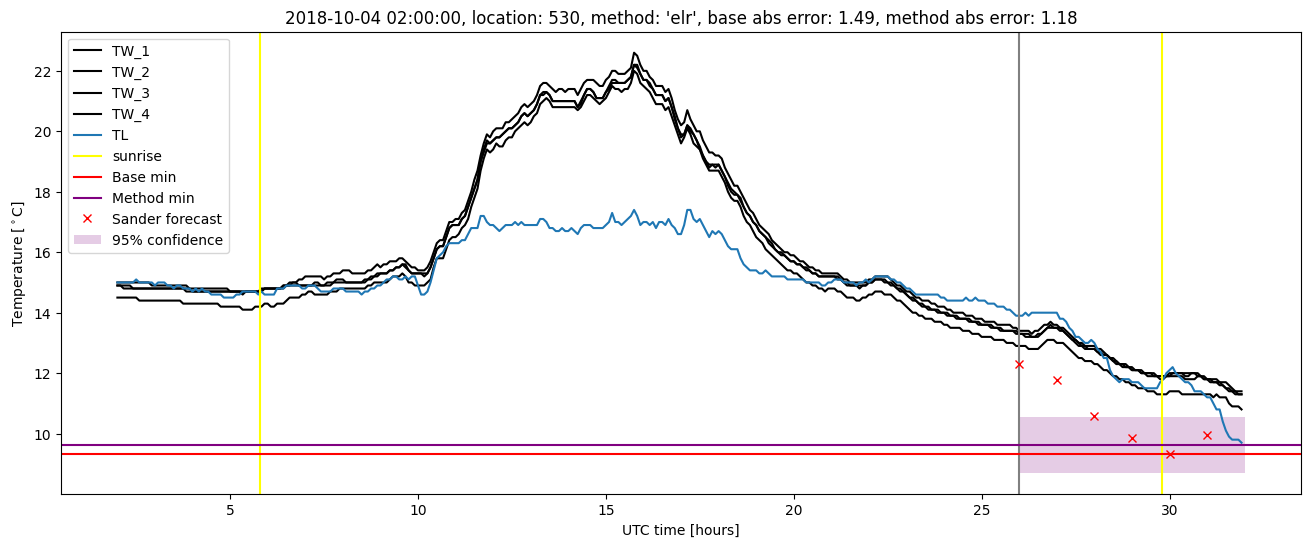
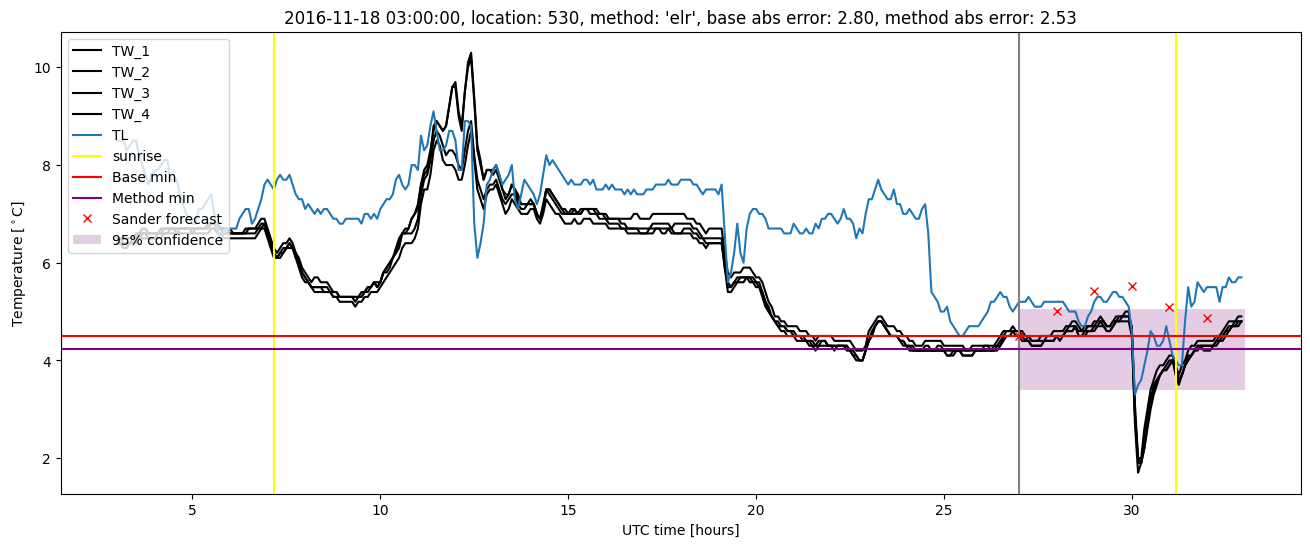
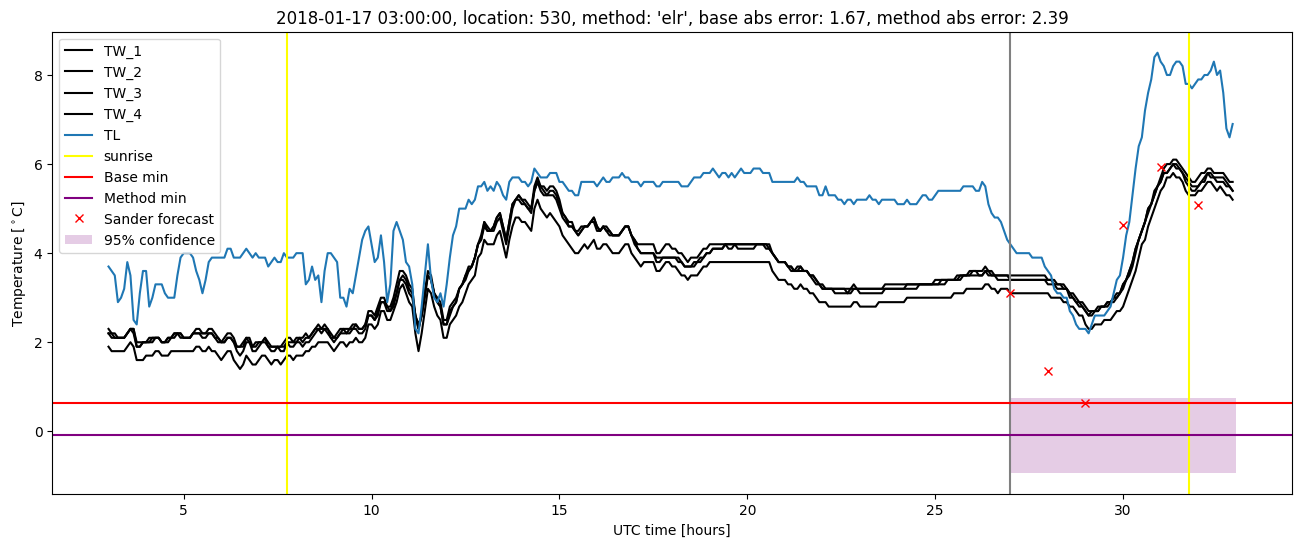
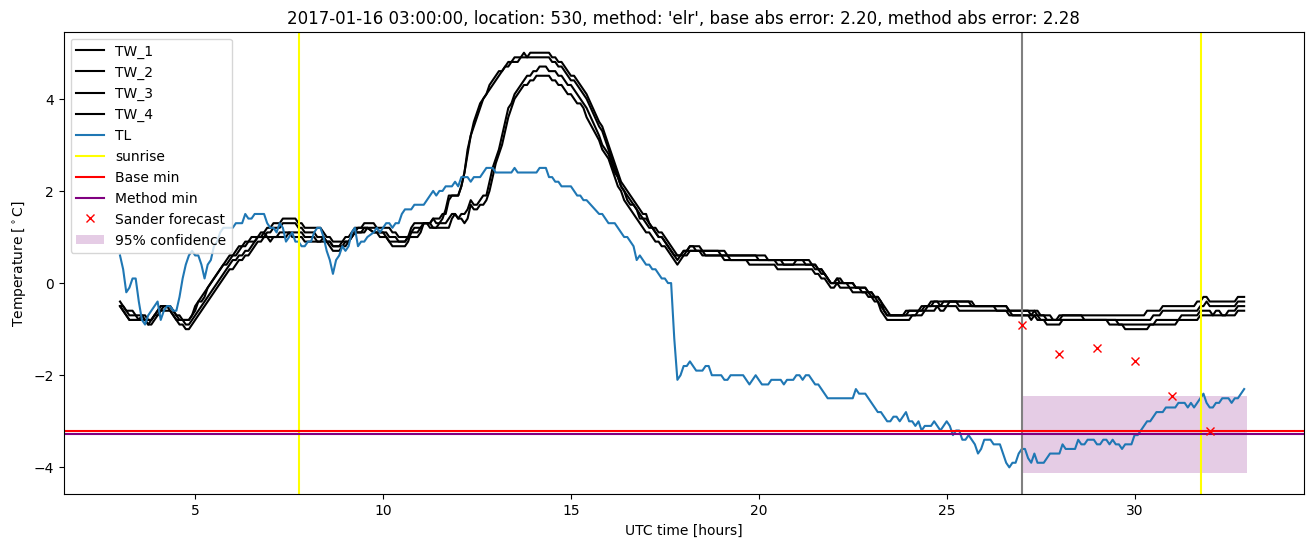
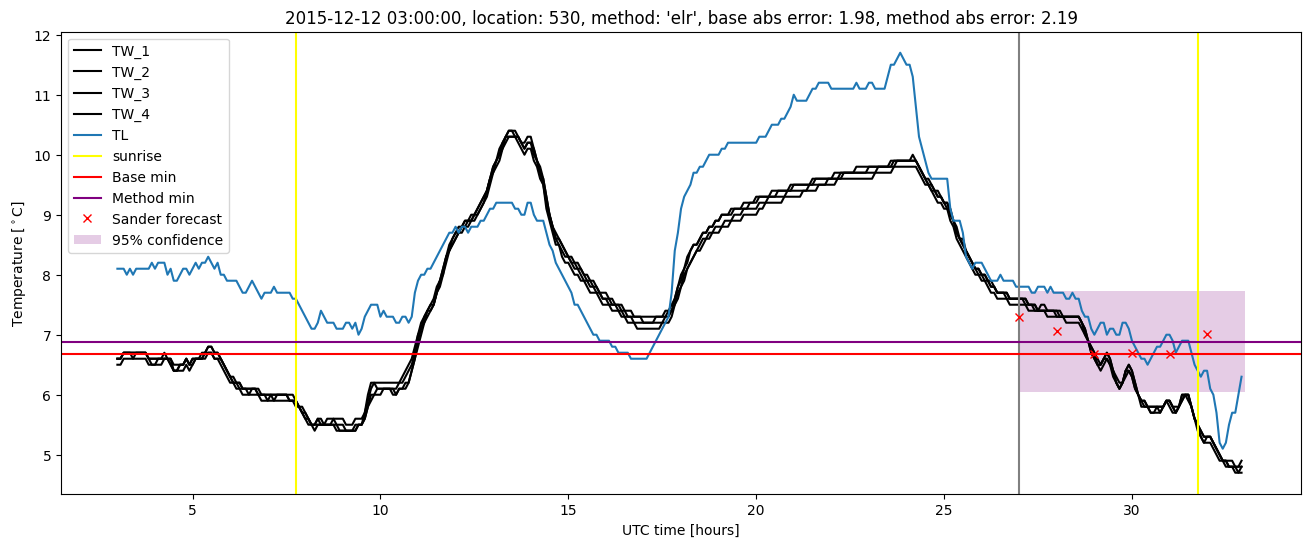
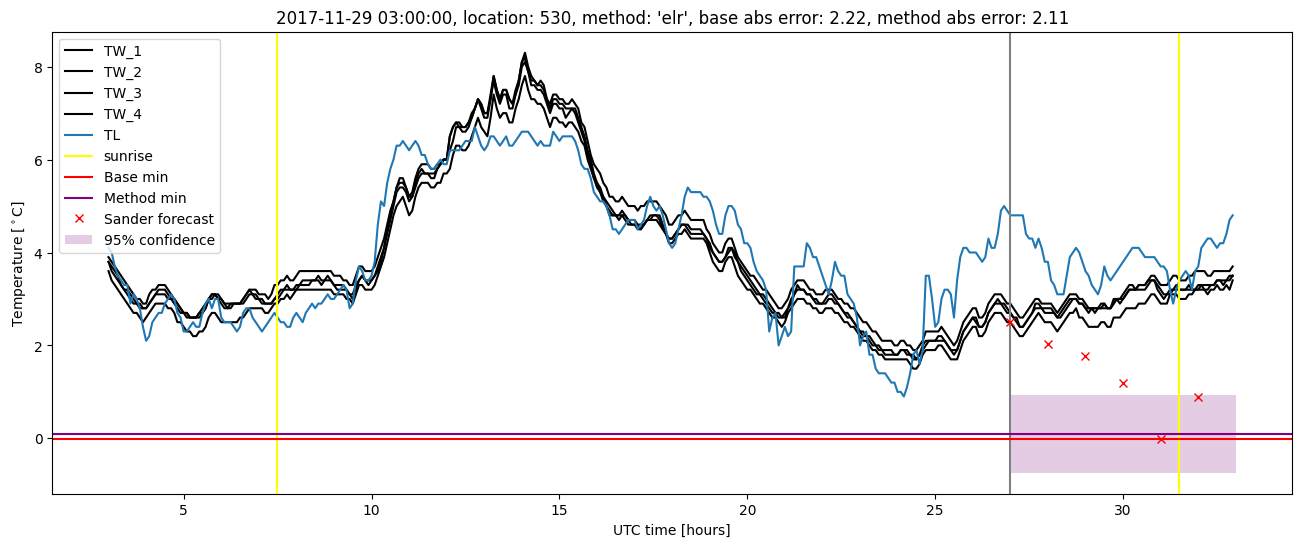
Extended logistic regression plots