GMS location: 529
Random forest results
| names |
period |
power |
significance |
meanSquareError |
absError |
maxError |
CRPS |
IGN |
| baseline |
winter 2016 |
0.994 |
0.053 |
0.305 |
0.414 |
1.980 |
NaN |
NaN |
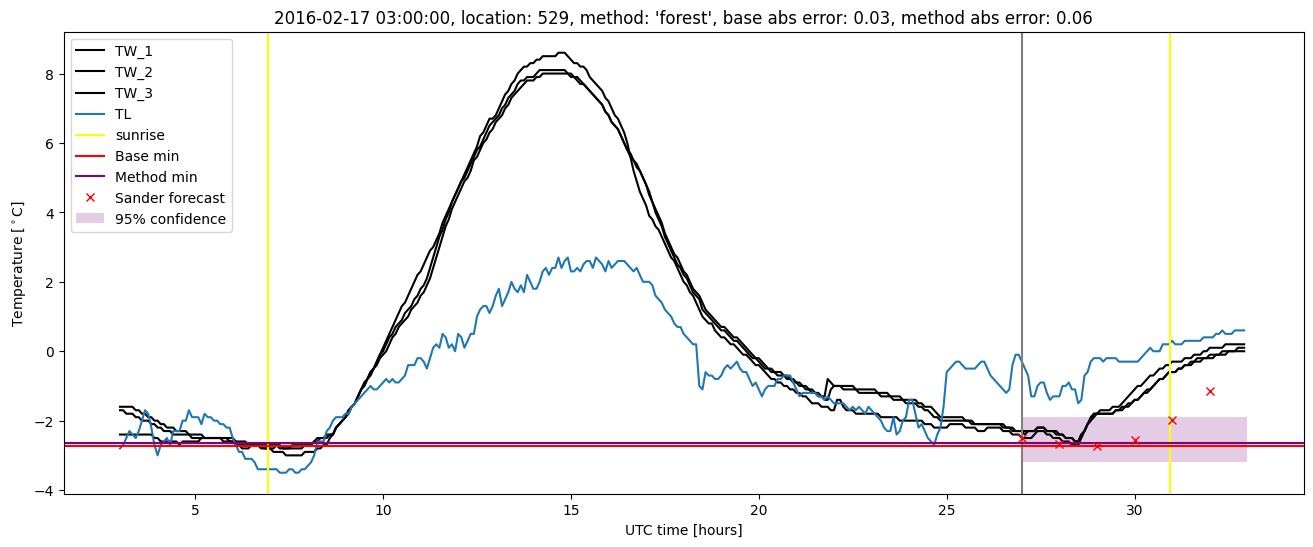
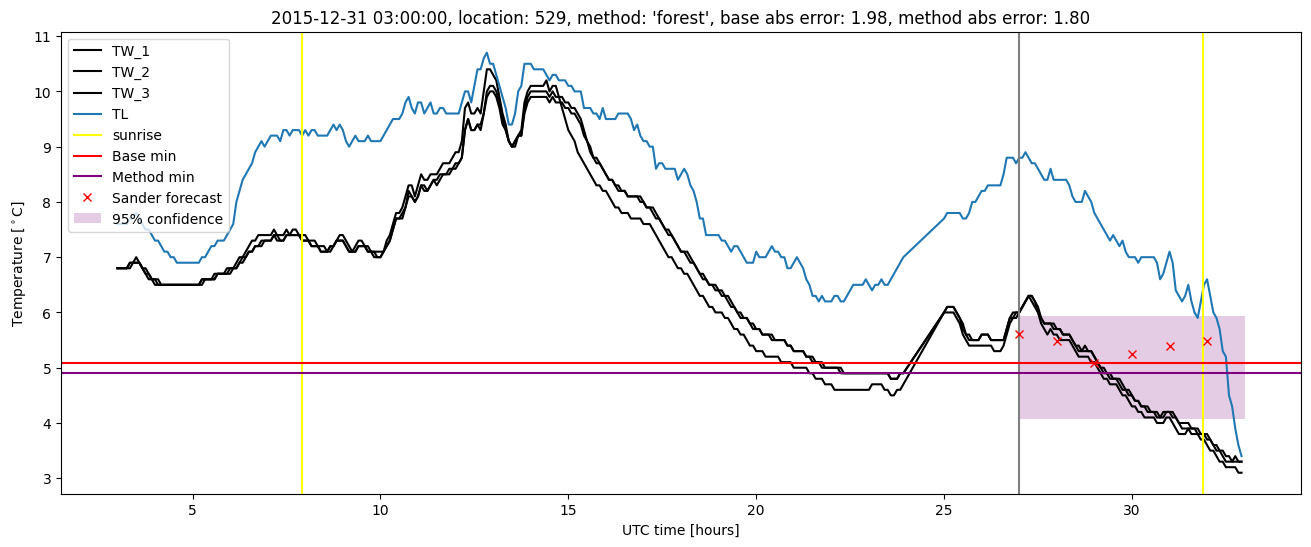
| forest |
winter 2016 |
0.994 |
0.053 |
0.242 |
0.366 |
1.803 |
0.471 |
2.842 |
| baseline |
winter 2017 |
0.976 |
0.069 |
0.367 |
0.445 |
1.998 |
NaN |
NaN |
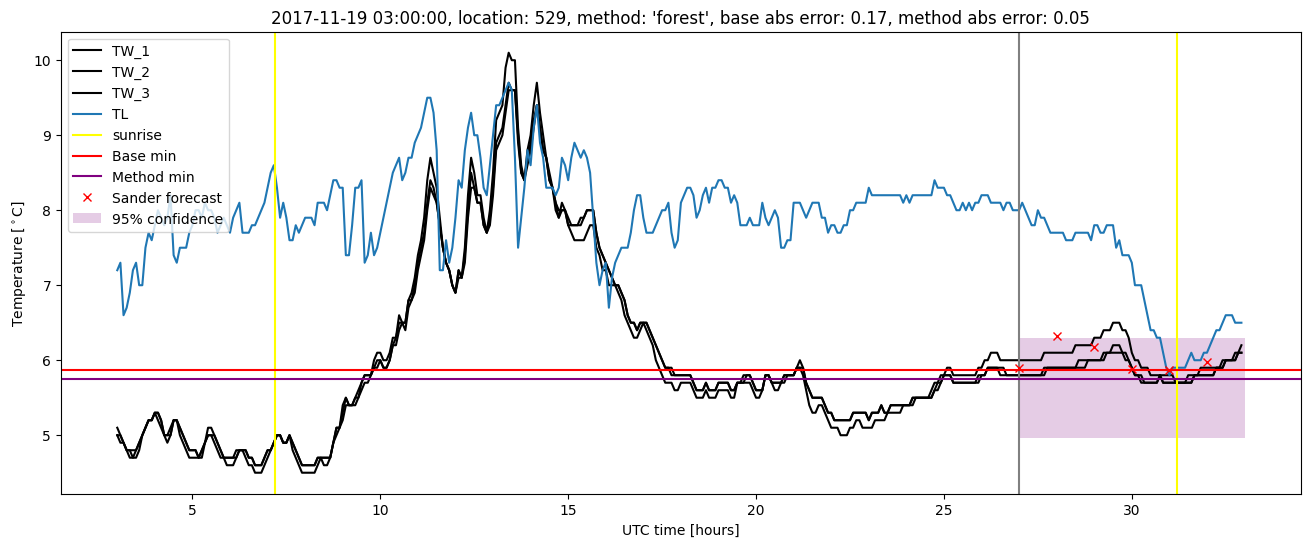
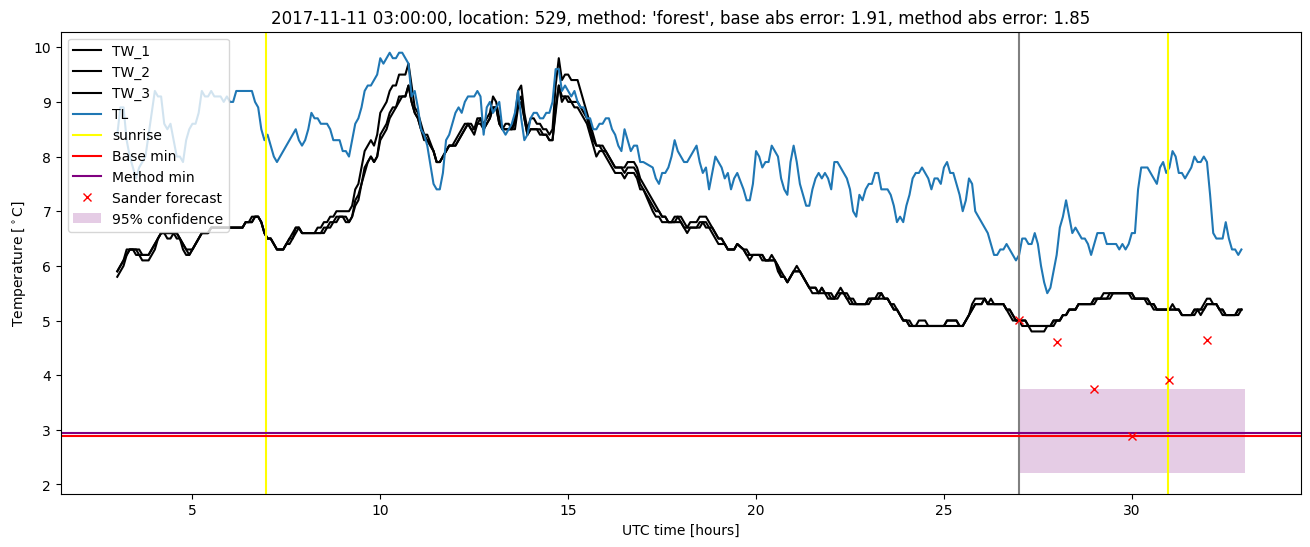
| forest |
winter 2017 |
0.976 |
0.069 |
0.280 |
0.383 |
1.783 |
0.469 |
3.860 |
| baseline |
winter 2018 |
0.986 |
0.045 |
0.405 |
0.435 |
3.191 |
NaN |
NaN |
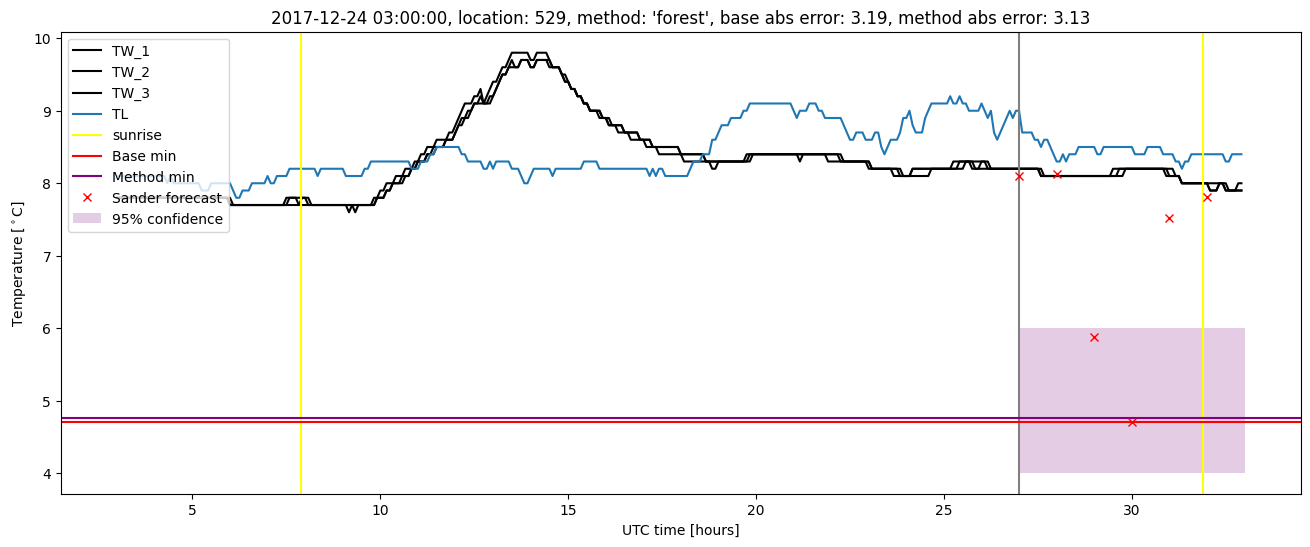
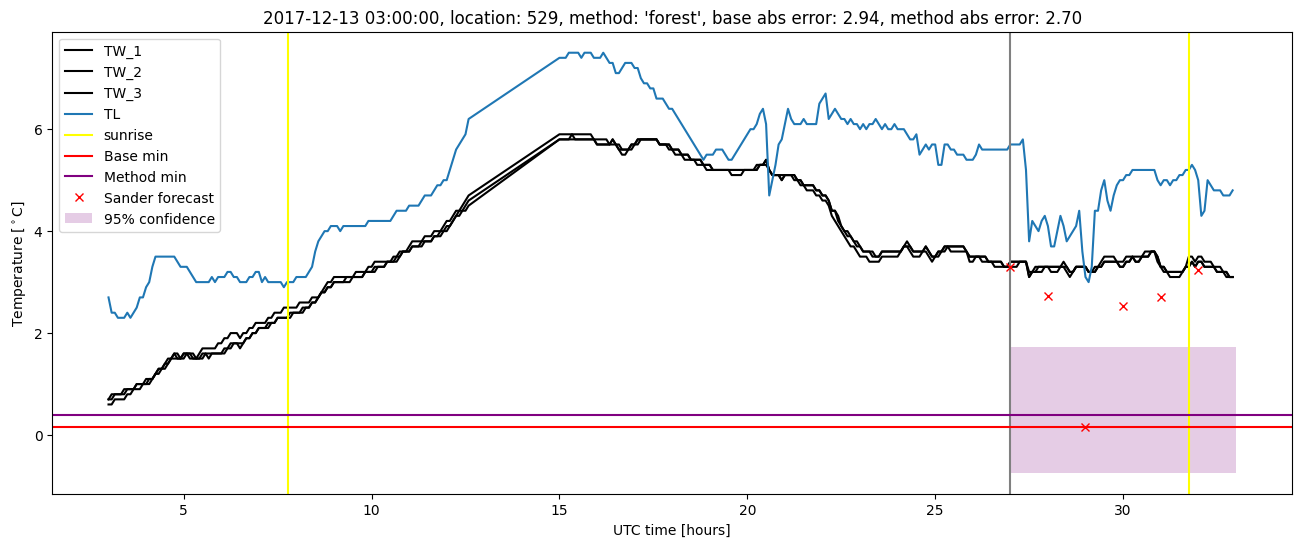
| forest |
winter 2018 |
0.993 |
0.091 |
0.347 |
0.405 |
3.133 |
0.473 |
3.890 |
| baseline |
winter 2019 |
0.986 |
0.000e+00 |
0.277 |
0.366 |
1.900 |
NaN |
NaN |
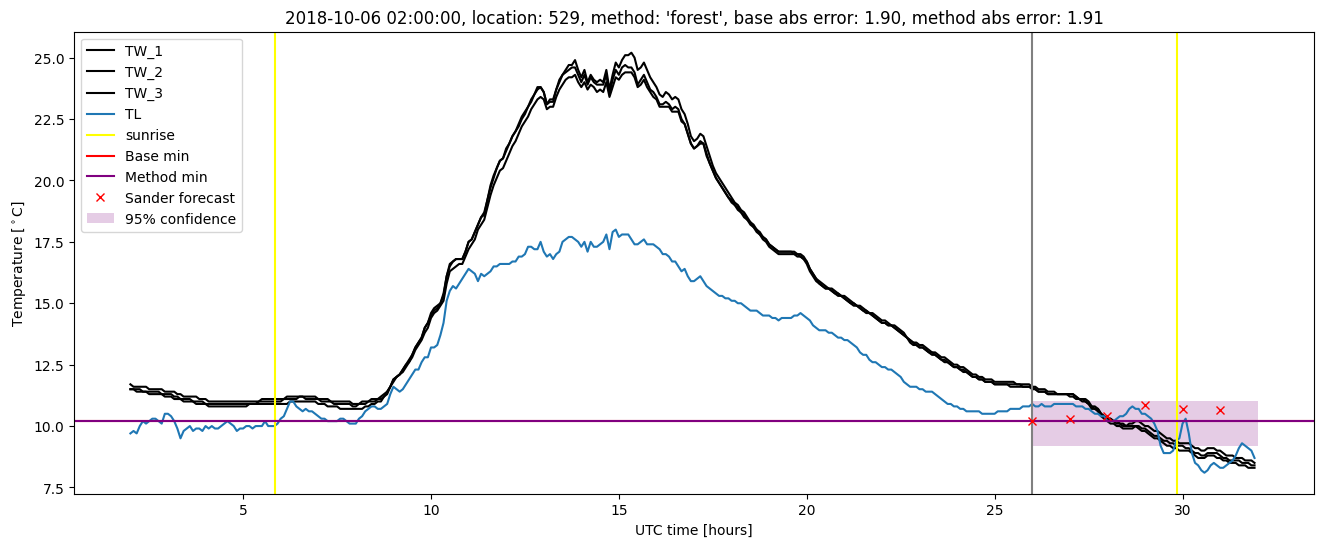
| forest |
winter 2019 |
0.993 |
0.000e+00 |
0.237 |
0.344 |
1.909 |
0.473 |
3.833 |
| baseline |
all |
0.986 |
0.049 |
0.337 |
0.415 |
3.191 |
NaN |
NaN |
| forest |
all |
0.990 |
0.061 |
0.276 |
0.374 |
3.133 |
0.472 |
3.565 |
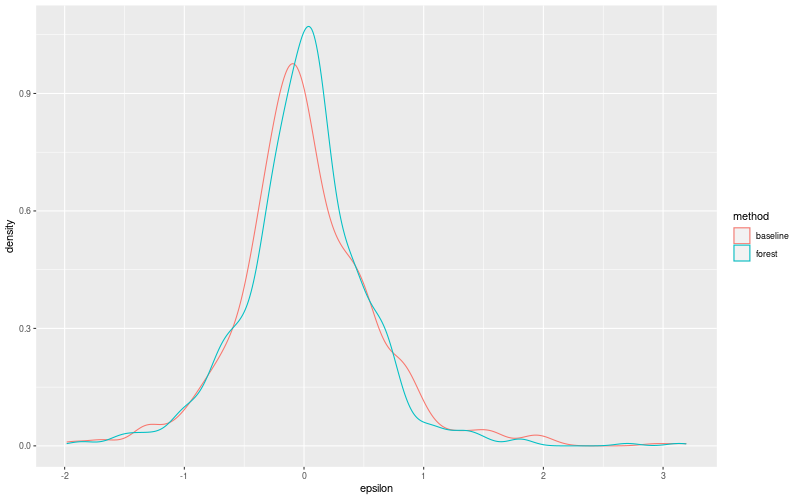
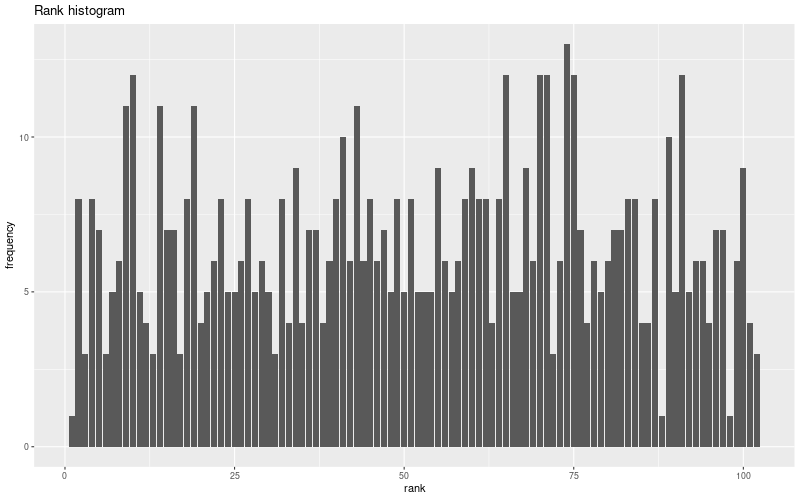
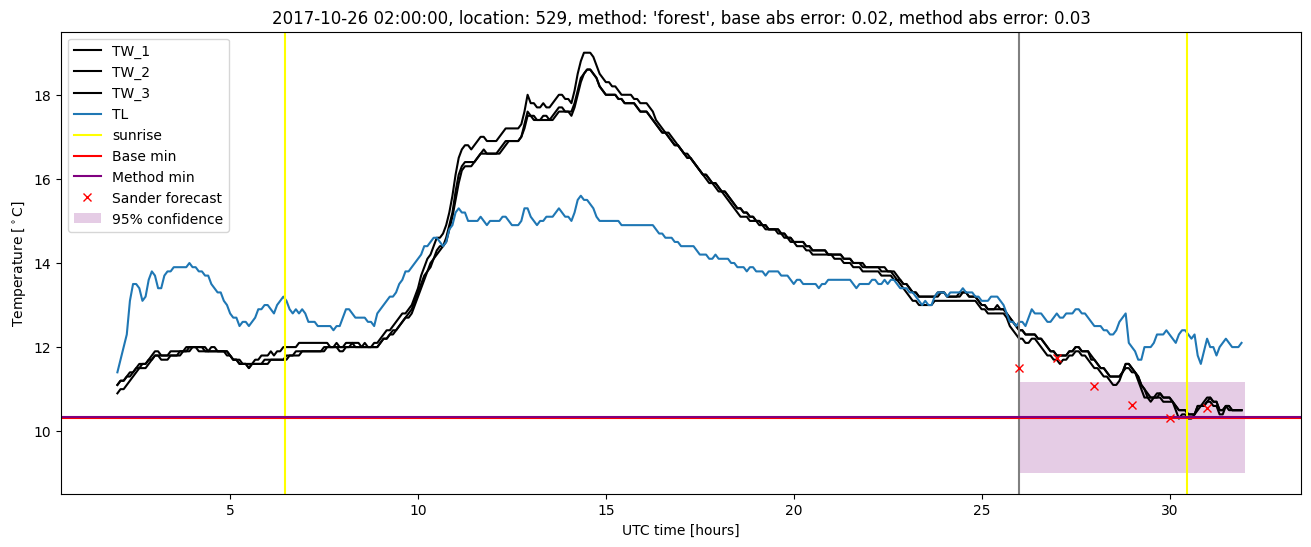
Random forest plots
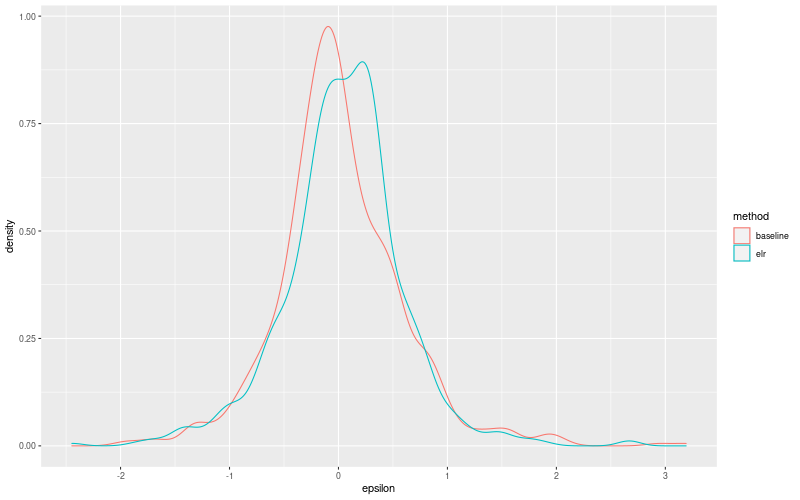
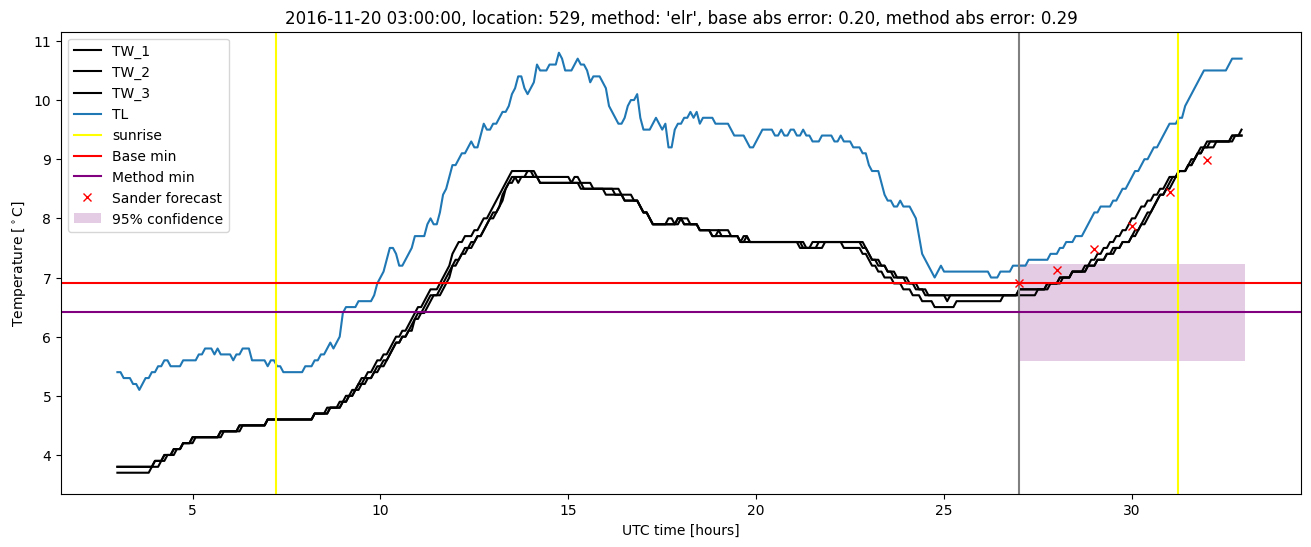
Extended logistic regression results
| names |
period |
power |
significance |
meanSquareError |
absError |
maxError |
CRPS |
IGN |
| baseline |
winter 2016 |
0.994 |
0.053 |
0.305 |
0.414 |
1.980 |
NaN |
NaN |
| elr |
winter 2016 |
0.989 |
0.000e+00 |
0.287 |
0.410 |
1.857 |
0.529 |
5.005 |
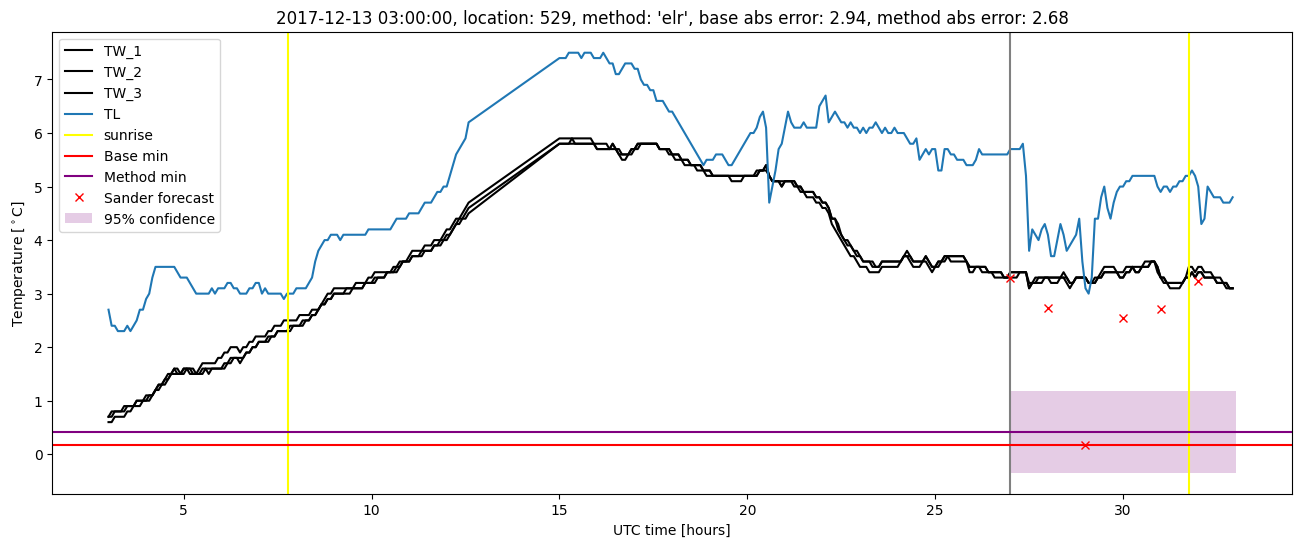
| baseline |
winter 2017 |
0.976 |
0.069 |
0.367 |
0.445 |
1.998 |
NaN |
NaN |
| elr |
winter 2017 |
0.968 |
0.069 |
0.321 |
0.425 |
1.898 |
0.534 |
5.423 |
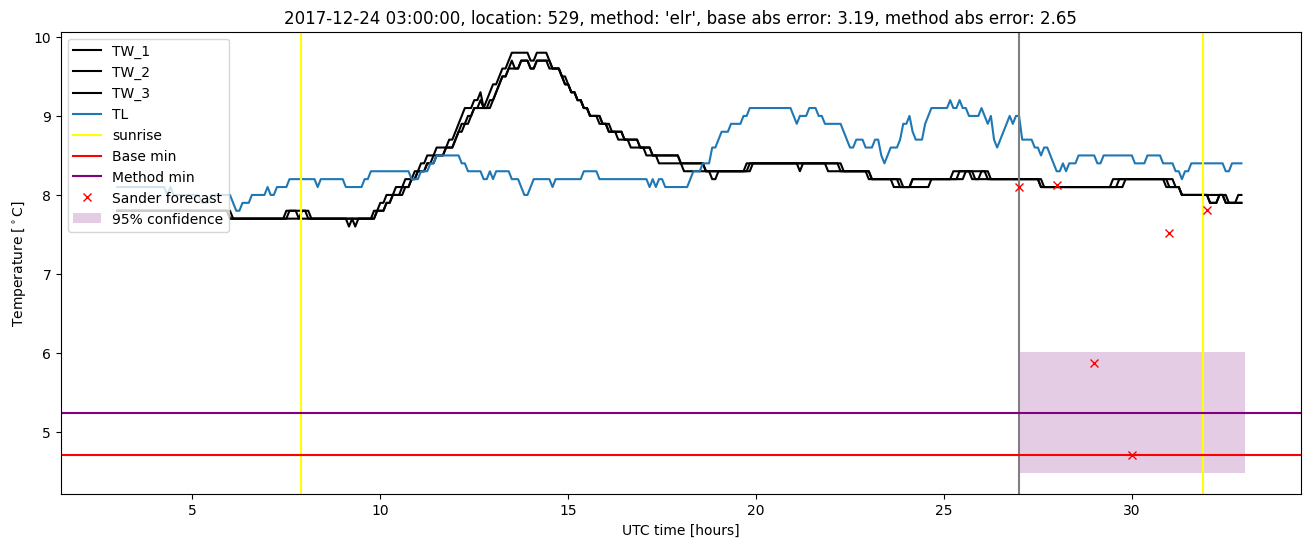
| baseline |
winter 2018 |
0.986 |
0.045 |
0.405 |
0.435 |
3.191 |
NaN |
NaN |
| elr |
winter 2018 |
0.986 |
0.091 |
0.343 |
0.418 |
2.681 |
0.566 |
7.635 |
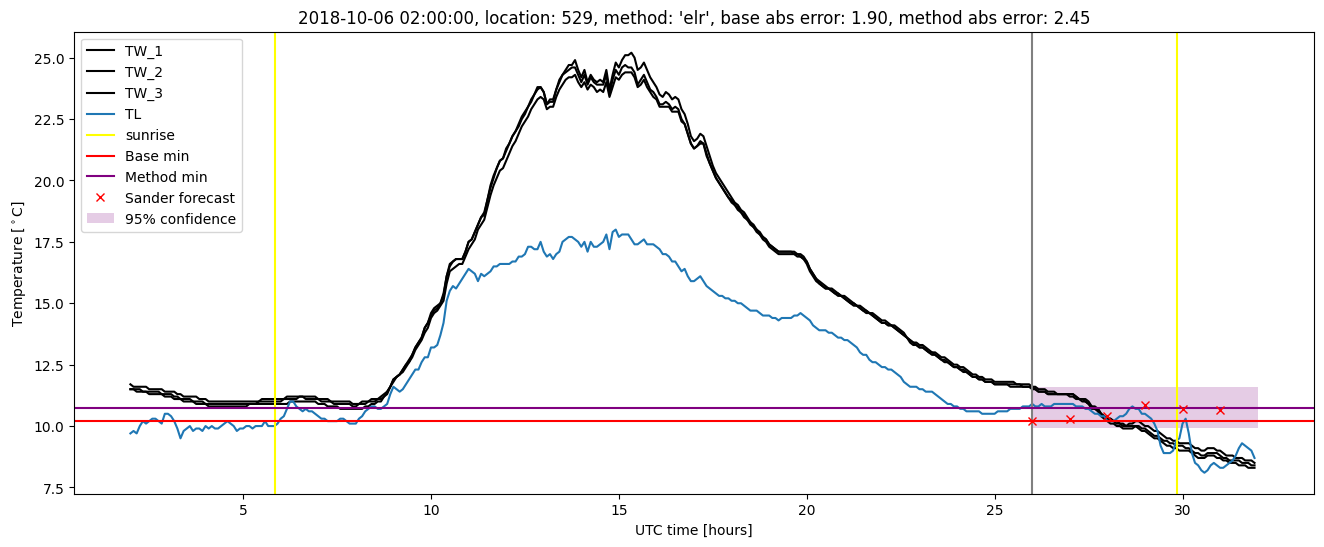
| baseline |
winter 2019 |
0.986 |
0.000e+00 |
0.277 |
0.366 |
1.900 |
NaN |
NaN |
| elr |
winter 2019 |
0.993 |
0.000e+00 |
0.265 |
0.358 |
2.447 |
0.544 |
5.136 |
| baseline |
all |
0.986 |
0.049 |
0.337 |
0.415 |
3.191 |
NaN |
NaN |
| elr |
all |
0.985 |
0.049 |
0.303 |
0.404 |
2.681 |
0.543 |
5.786 |
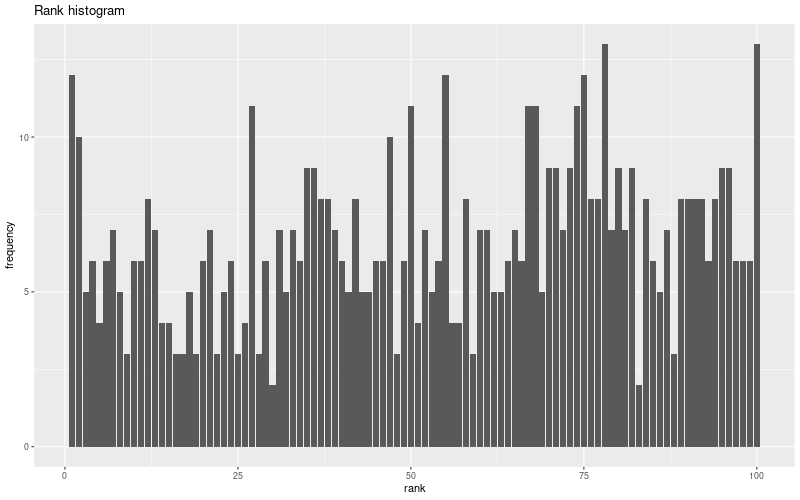
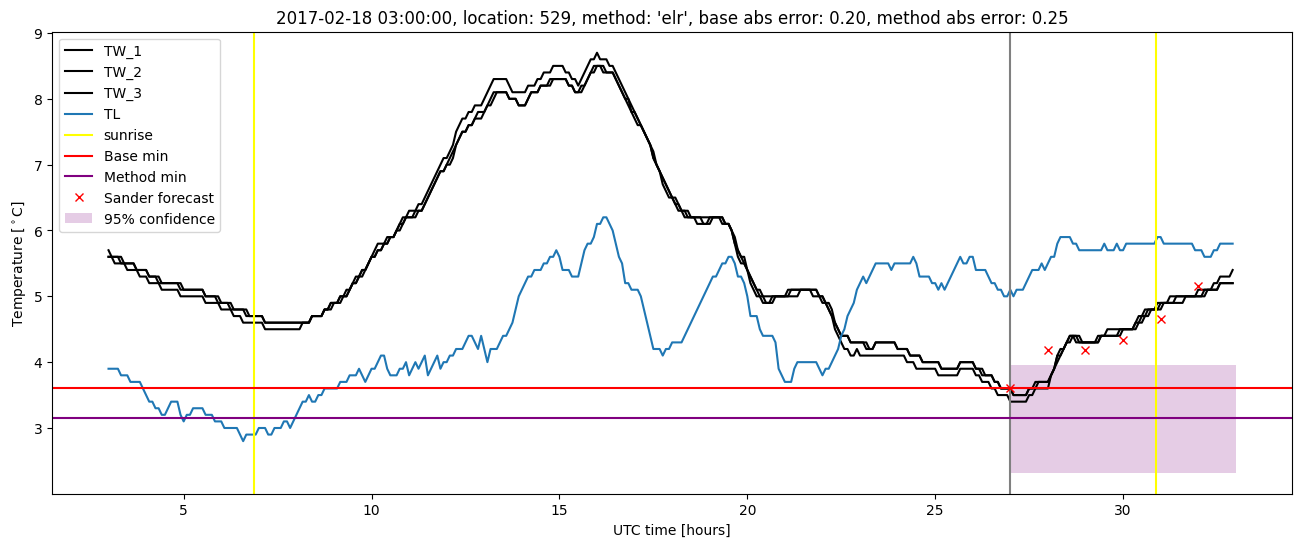
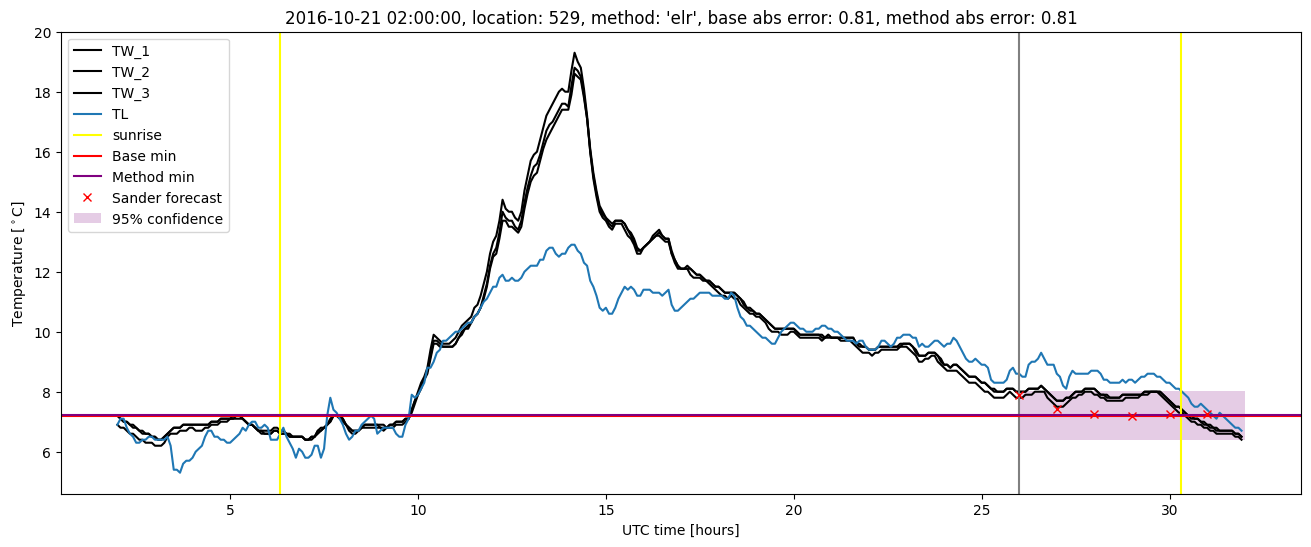
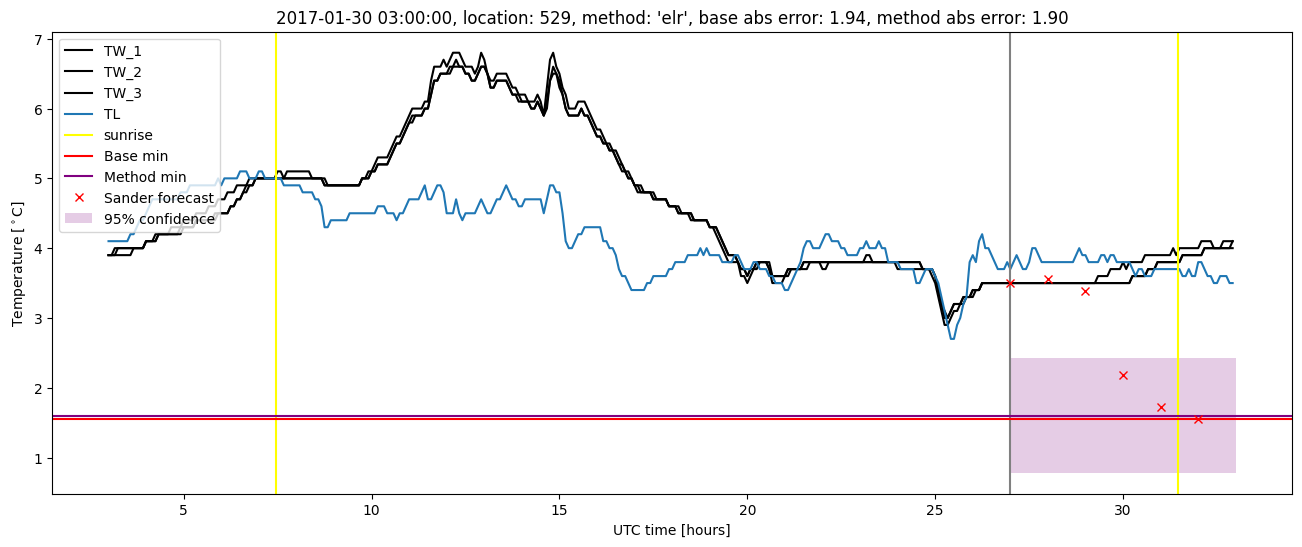
Extended logistic regression plots