GMS location: 524
Random forest results
| names |
period |
power |
significance |
meanSquareError |
absError |
maxError |
CRPS |
IGN |
| baseline |
winter 2016 |
0.994 |
0.000e+00 |
0.353 |
0.475 |
2.100 |
NaN |
NaN |
| forest |
winter 2016 |
0.994 |
0.050 |
0.263 |
0.392 |
1.919 |
0.484 |
4.306 |
| baseline |
winter 2017 |
0.950 |
0.062 |
0.339 |
0.455 |
1.577 |
NaN |
NaN |
| forest |
winter 2017 |
0.992 |
0.094 |
0.232 |
0.369 |
1.466 |
0.469 |
3.504 |
| baseline |
winter 2018 |
0.980 |
0.138 |
0.393 |
0.469 |
1.967 |
NaN |
NaN |
| forest |
winter 2018 |
0.987 |
0.172 |
0.293 |
0.402 |
1.872 |
0.479 |
3.429 |
| baseline |
winter 2019 |
0.993 |
0.000e+00 |
0.256 |
0.379 |
1.625 |
NaN |
NaN |
| forest |
winter 2019 |
0.993 |
0.000e+00 |
0.217 |
0.353 |
1.948 |
0.474 |
3.703 |
| baseline |
all |
0.981 |
0.065 |
0.339 |
0.448 |
2.100 |
NaN |
NaN |
| forest |
all |
0.991 |
0.098 |
0.254 |
0.381 |
1.948 |
0.477 |
3.756 |
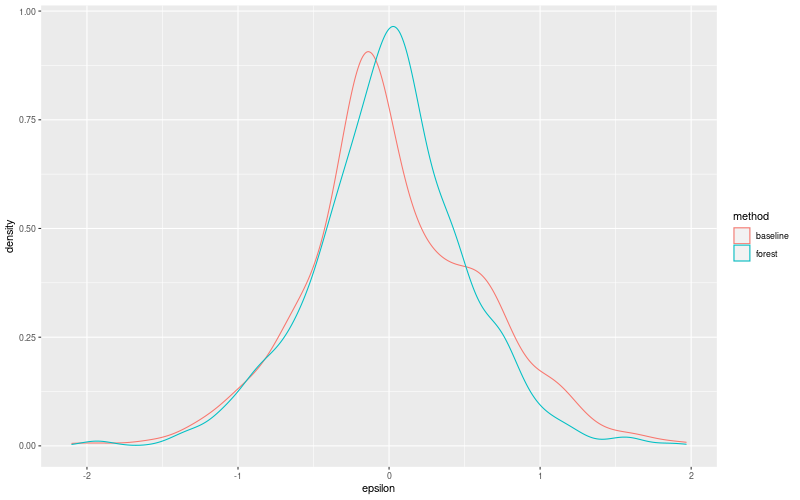
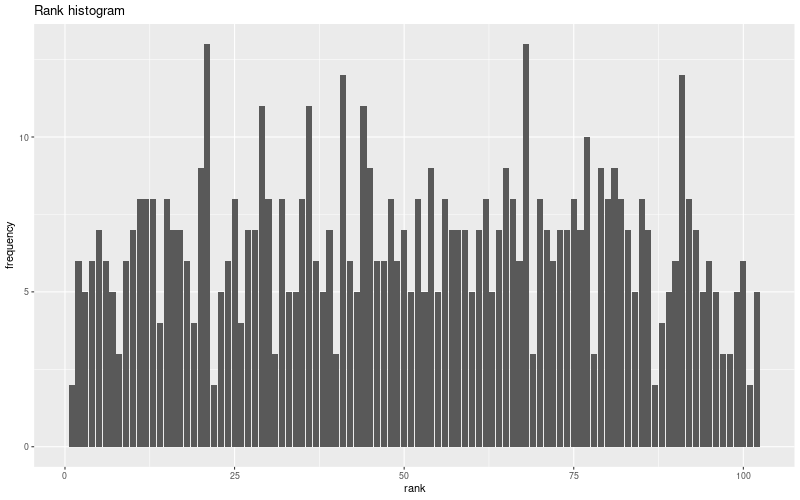
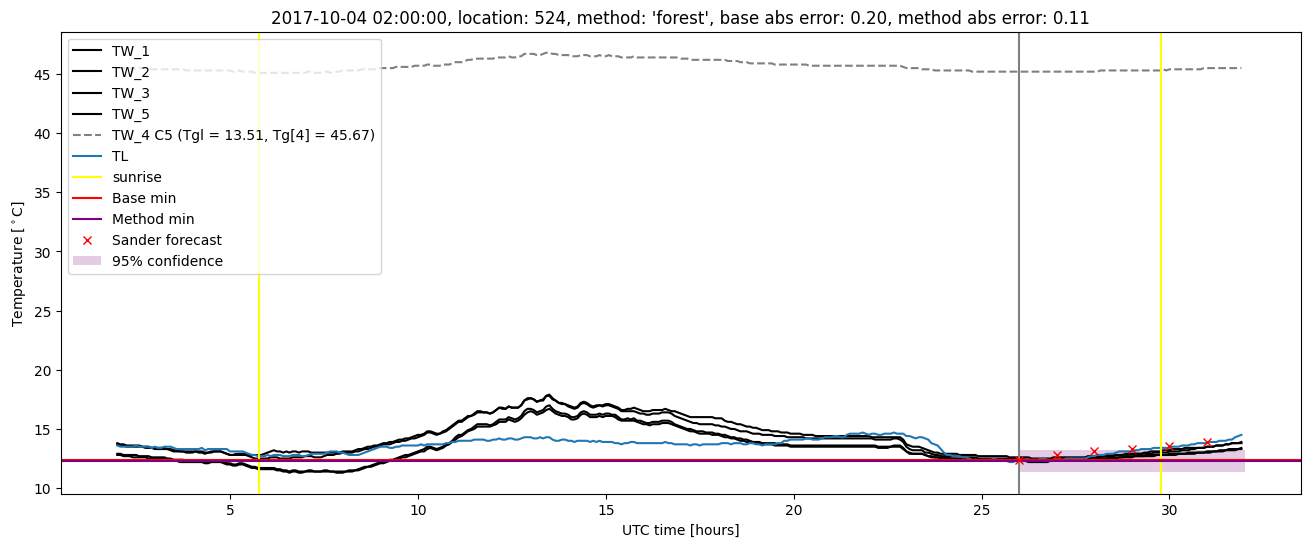
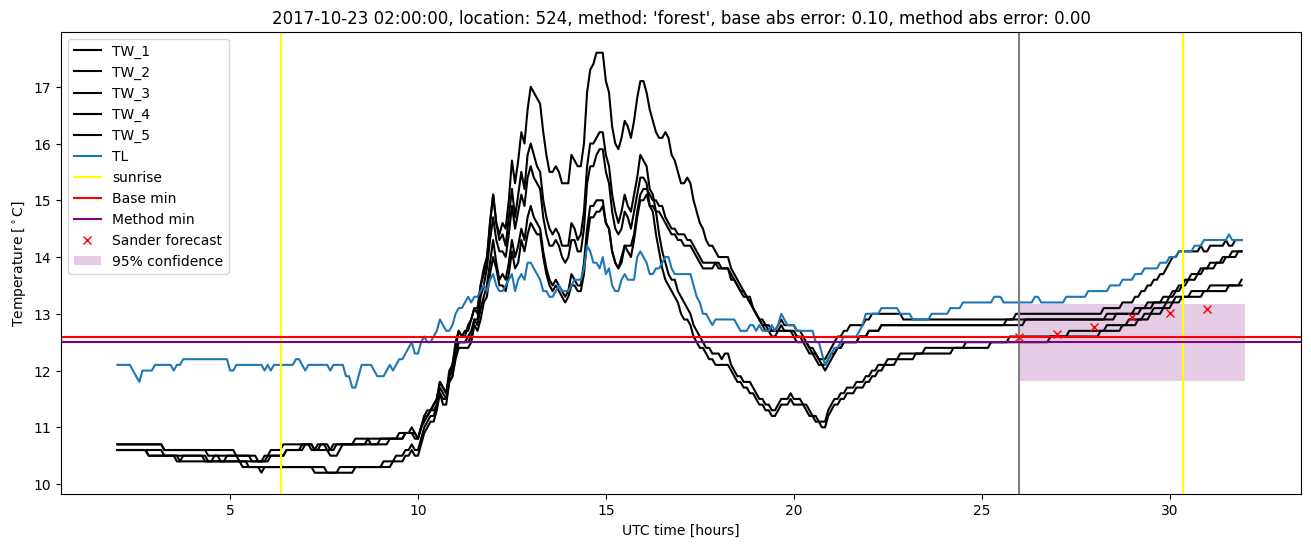
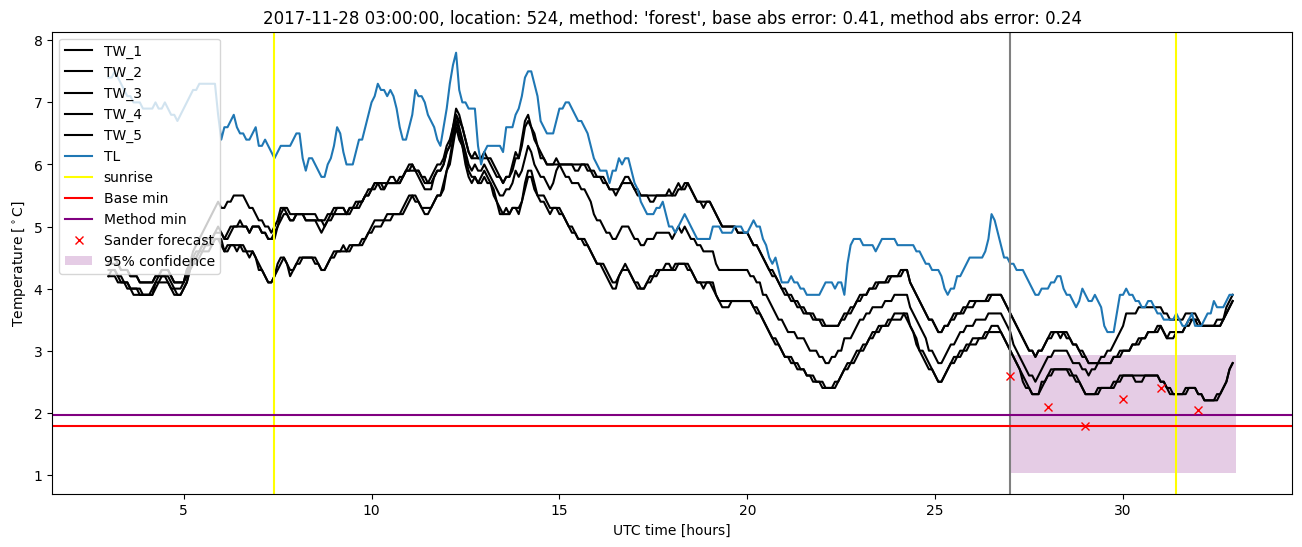
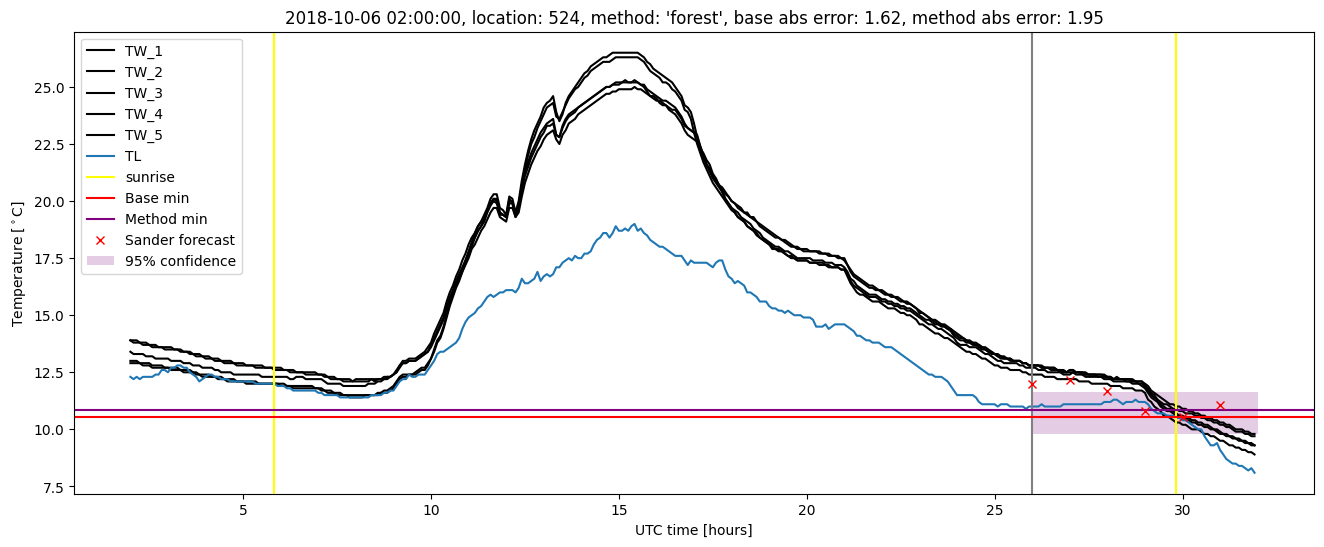
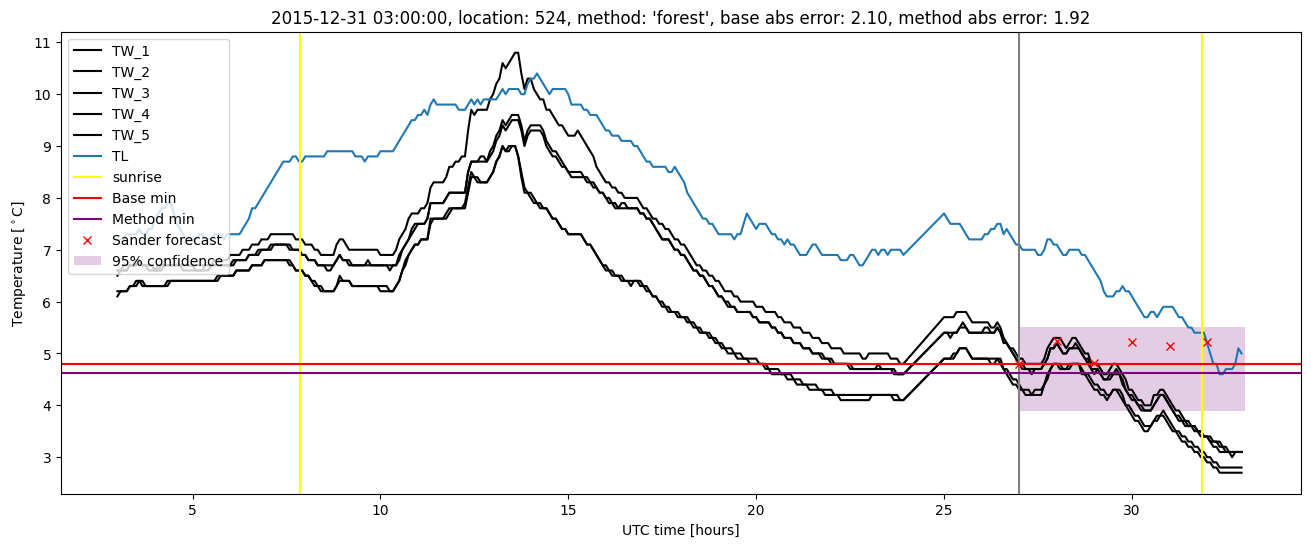
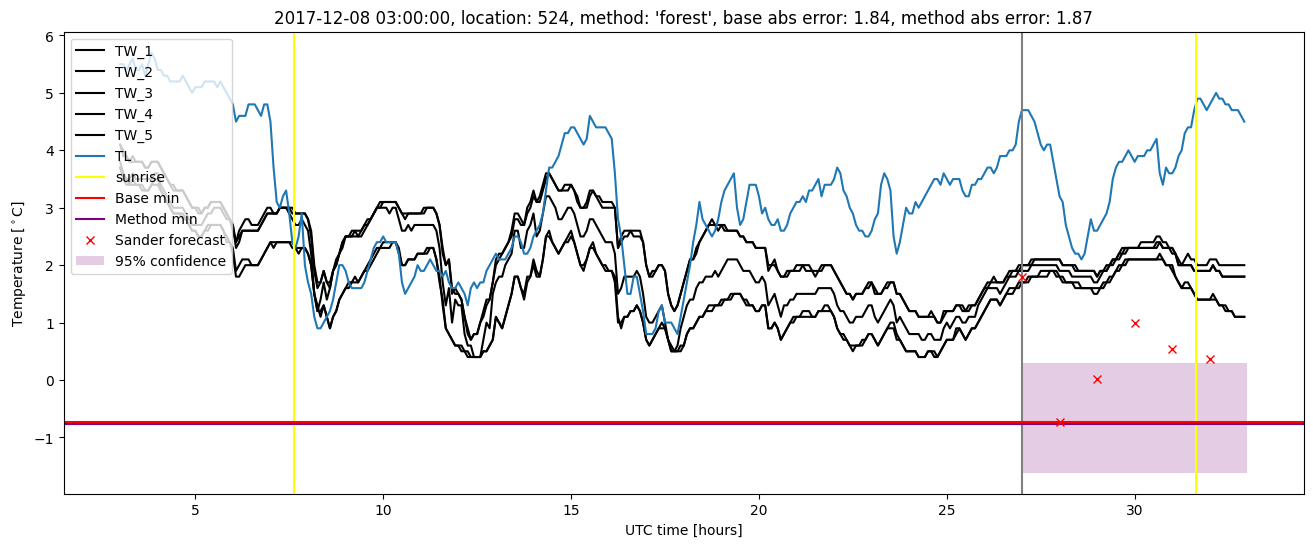
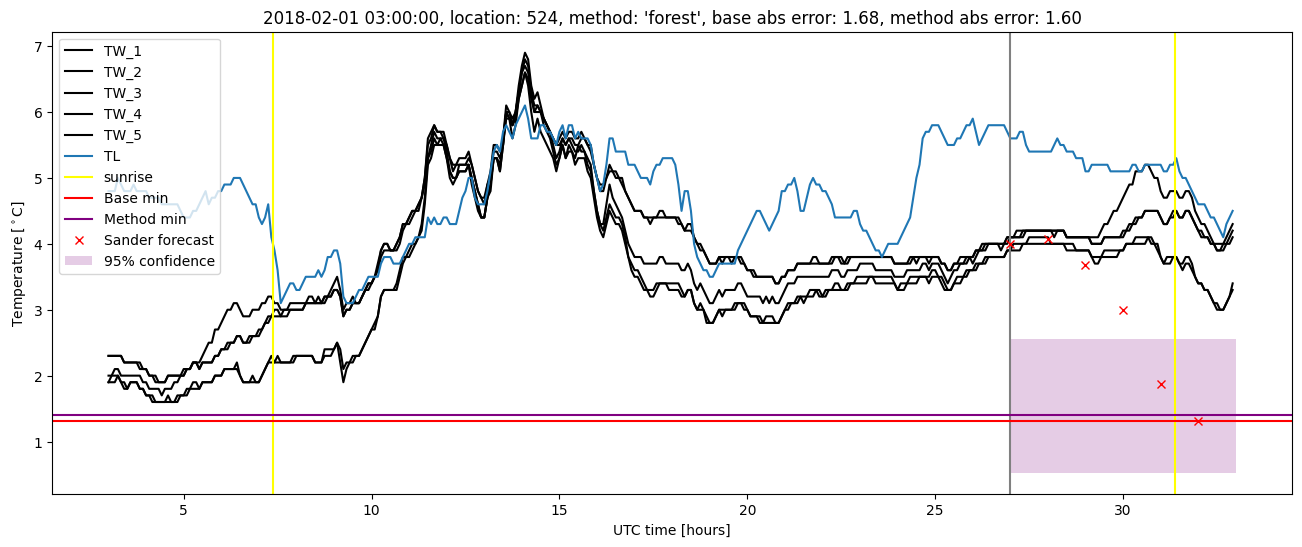
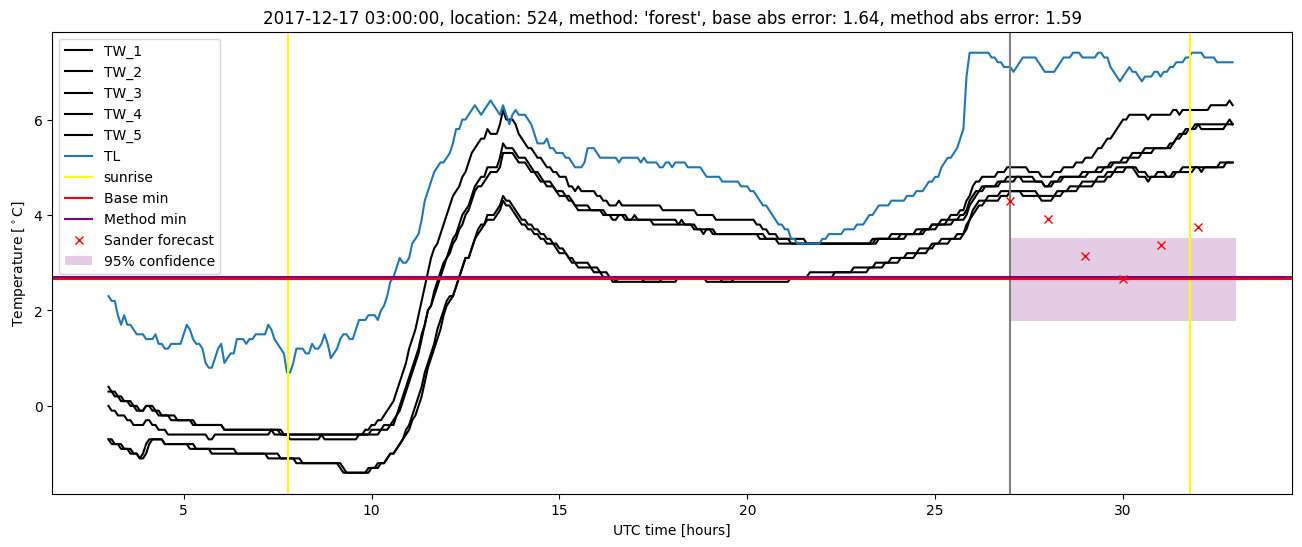
Random forest plots
Extended logistic regression results
| names |
period |
power |
significance |
meanSquareError |
absError |
maxError |
CRPS |
IGN |
| baseline |
winter 2016 |
0.994 |
0.000e+00 |
0.353 |
0.475 |
2.100 |
NaN |
NaN |
| elr |
winter 2016 |
0.994 |
0.100 |
0.324 |
0.440 |
1.870 |
0.534 |
4.434 |
| baseline |
winter 2017 |
0.950 |
0.062 |
0.339 |
0.455 |
1.577 |
NaN |
NaN |
| elr |
winter 2017 |
0.967 |
0.094 |
0.289 |
0.417 |
1.493 |
0.494 |
3.720 |
| baseline |
winter 2018 |
0.980 |
0.138 |
0.393 |
0.469 |
1.967 |
NaN |
NaN |
| elr |
winter 2018 |
0.987 |
0.138 |
0.337 |
0.448 |
1.657 |
0.533 |
4.559 |
| baseline |
winter 2019 |
0.993 |
0.000e+00 |
0.256 |
0.379 |
1.625 |
NaN |
NaN |
| elr |
winter 2019 |
0.993 |
0.000e+00 |
0.283 |
0.410 |
1.848 |
0.515 |
3.698 |
| baseline |
all |
0.981 |
0.065 |
0.339 |
0.448 |
2.100 |
NaN |
NaN |
| elr |
all |
0.986 |
0.098 |
0.310 |
0.430 |
1.870 |
0.520 |
4.143 |
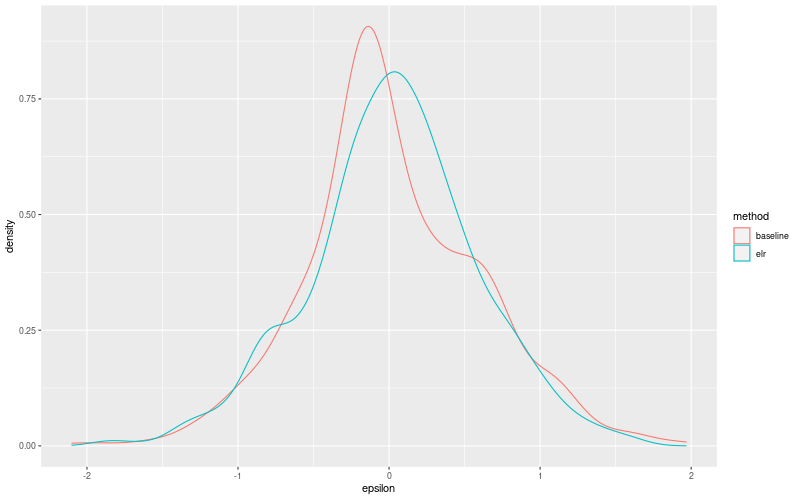
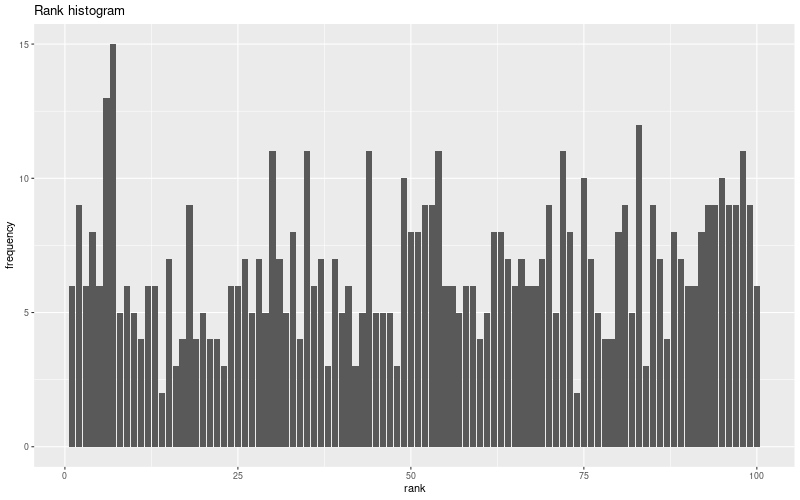
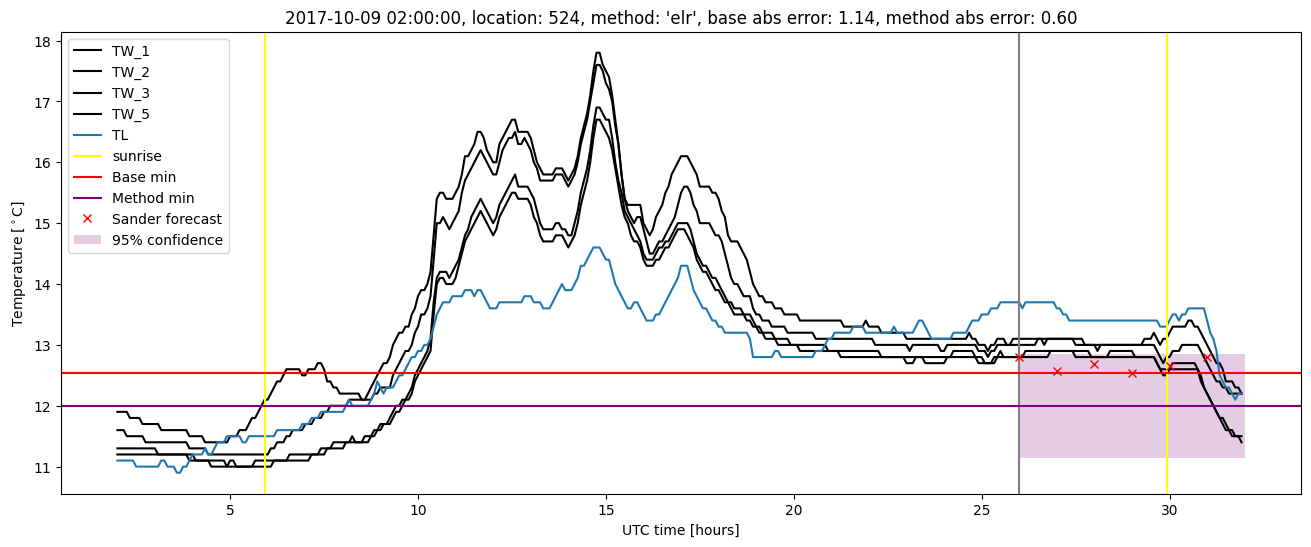
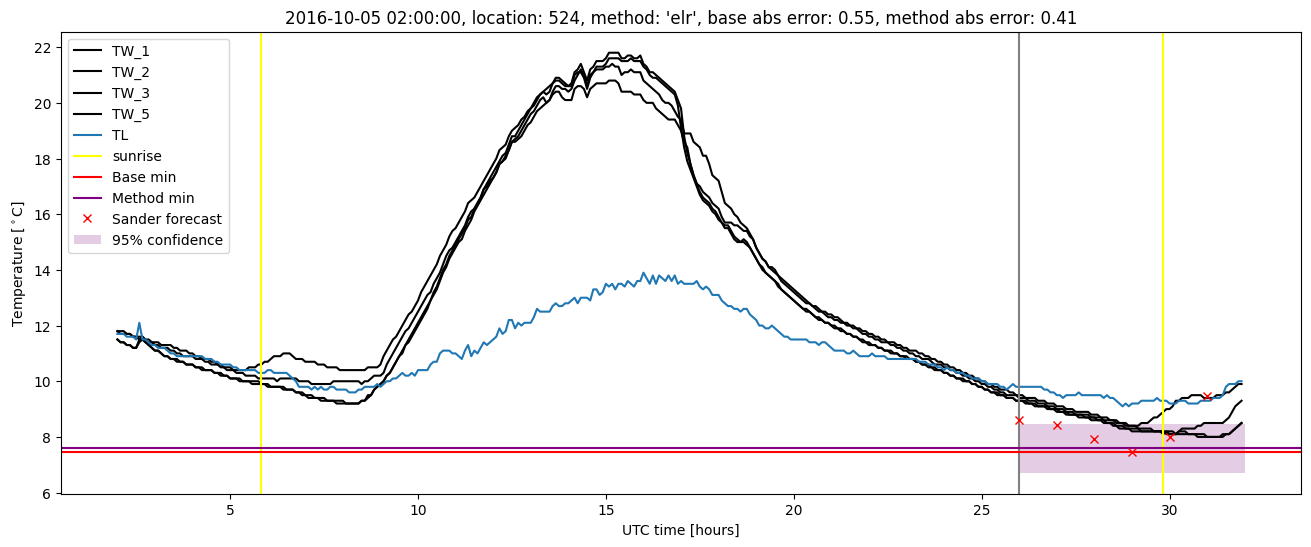
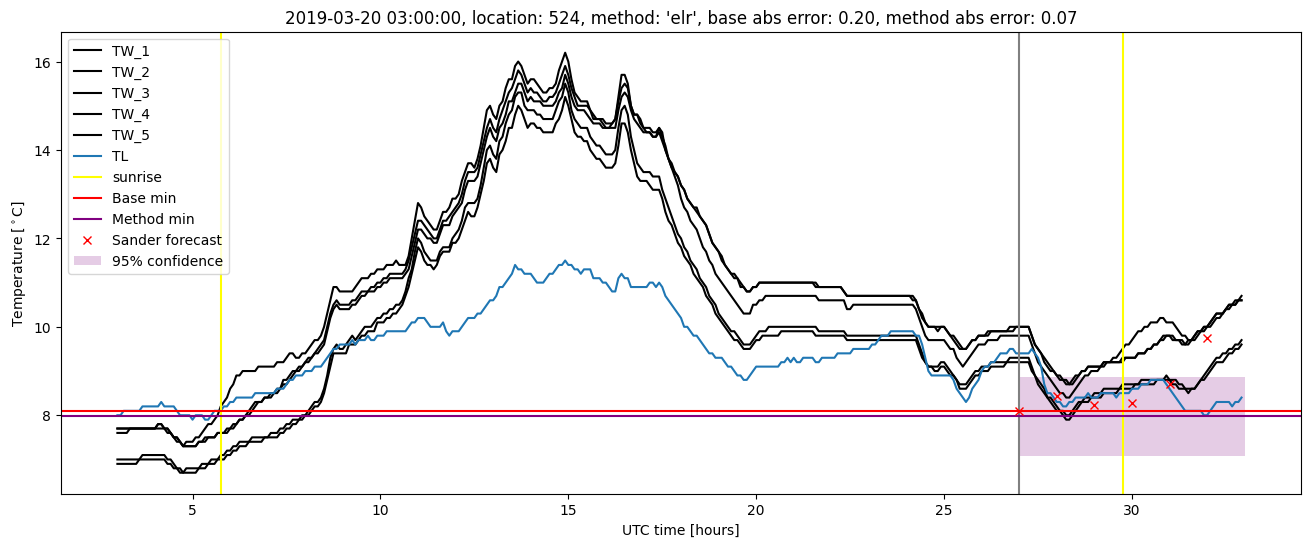
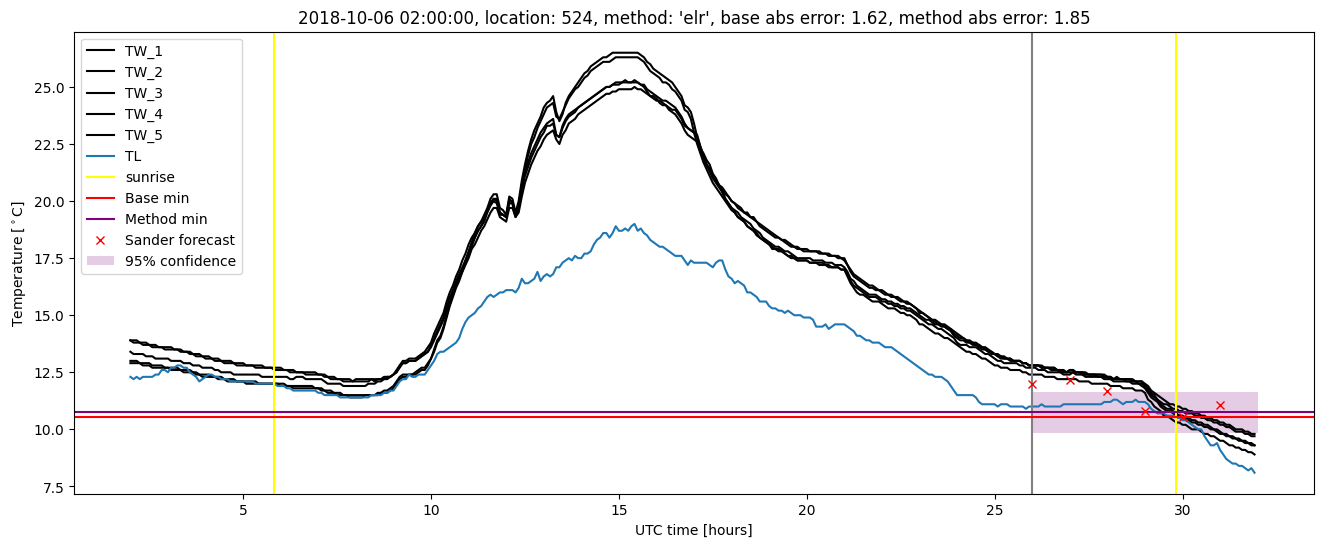
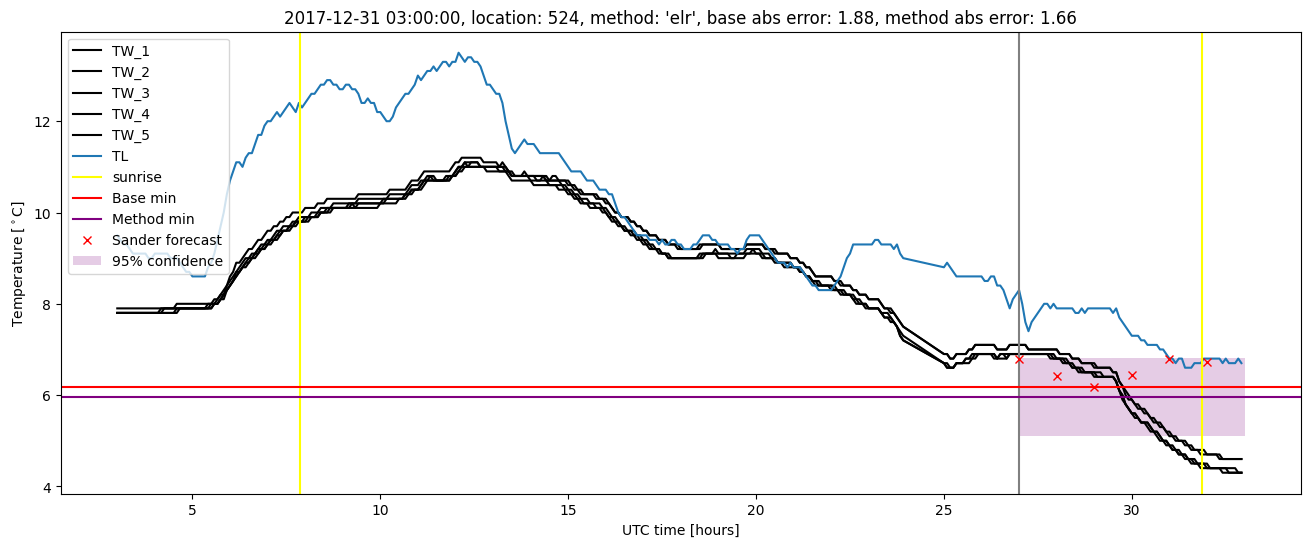
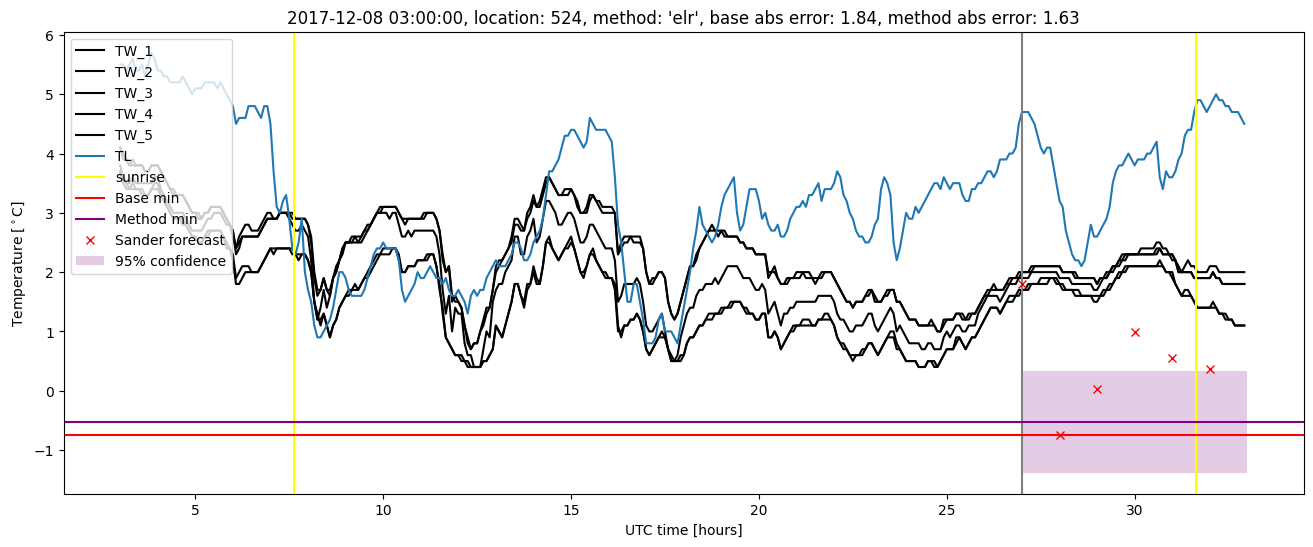
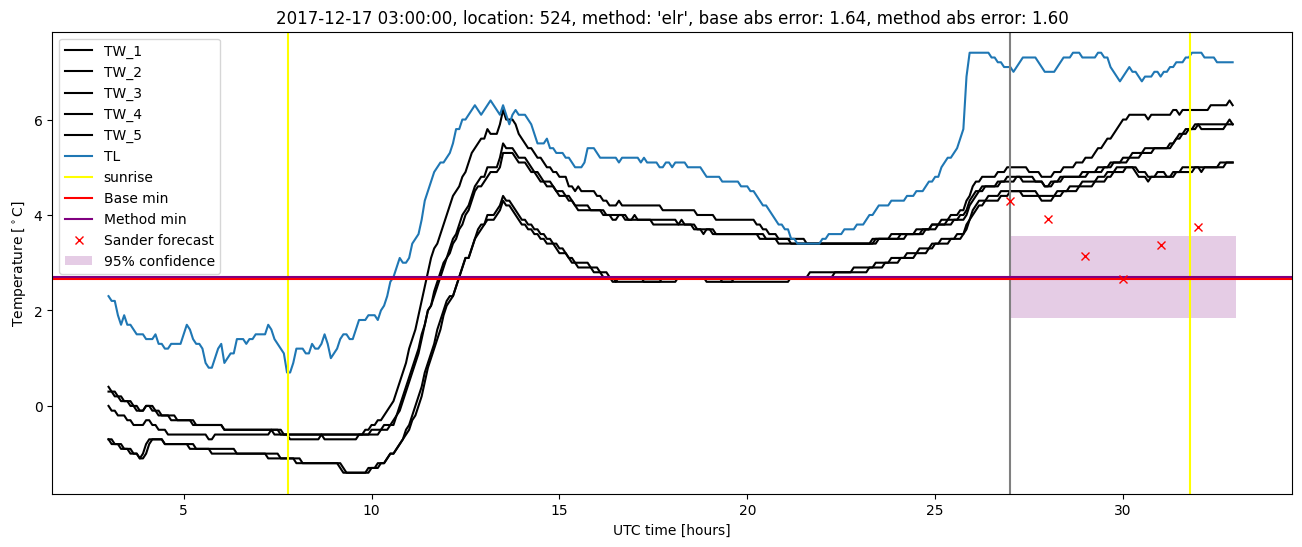
Extended logistic regression plots