GMS location: 523
Random forest results
| names |
period |
power |
significance |
meanSquareError |
absError |
maxError |
CRPS |
IGN |
| baseline |
winter 2016 |
0.994 |
0.045 |
0.400 |
0.462 |
2.501 |
NaN |
NaN |
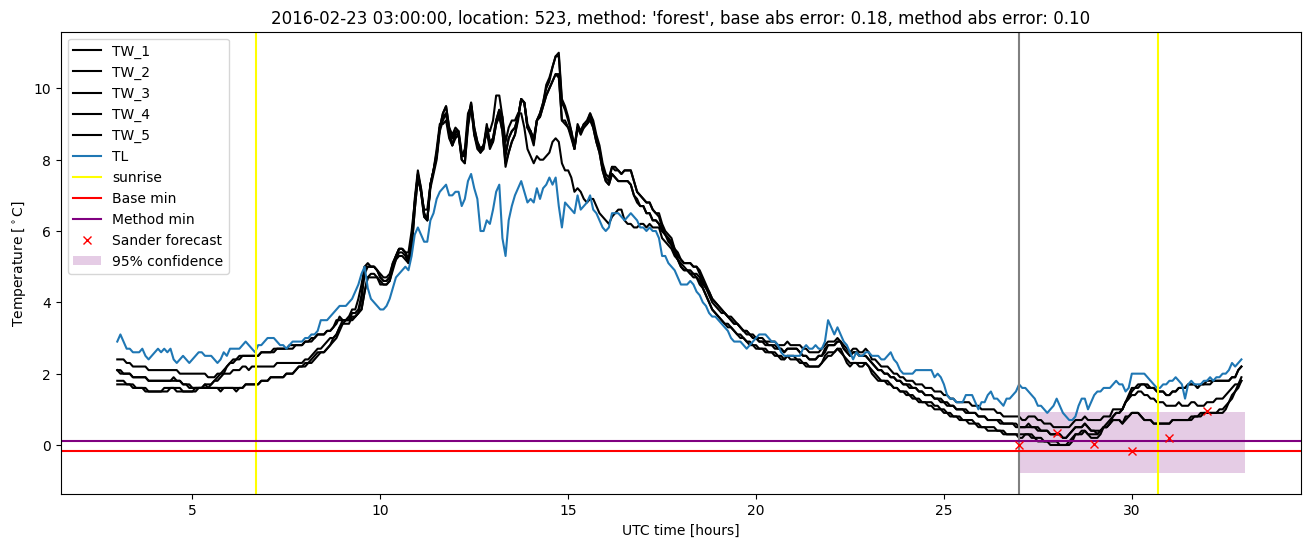
| forest |
winter 2016 |
1.000 |
0.045 |
0.312 |
0.381 |
2.583 |
0.458 |
3.672 |
| baseline |
winter 2017 |
0.960 |
0.071 |
0.350 |
0.449 |
2.482 |
NaN |
NaN |
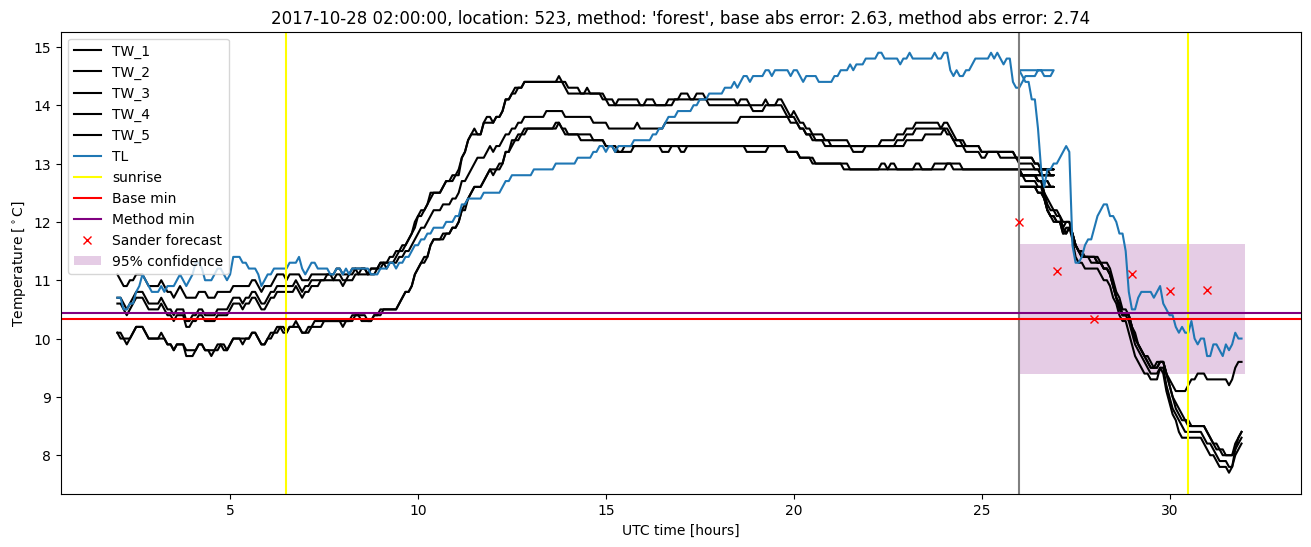
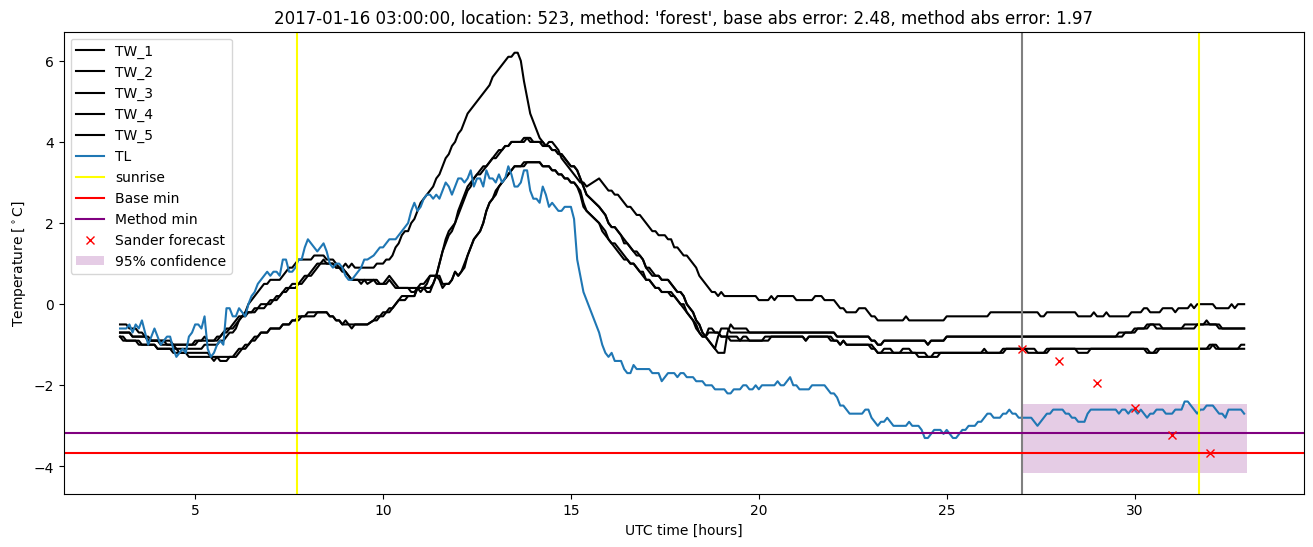
| forest |
winter 2017 |
0.968 |
0.071 |
0.229 |
0.363 |
1.975 |
0.446 |
2.457 |
| baseline |
winter 2018 |
1.000 |
0.037 |
0.365 |
0.437 |
2.635 |
NaN |
NaN |
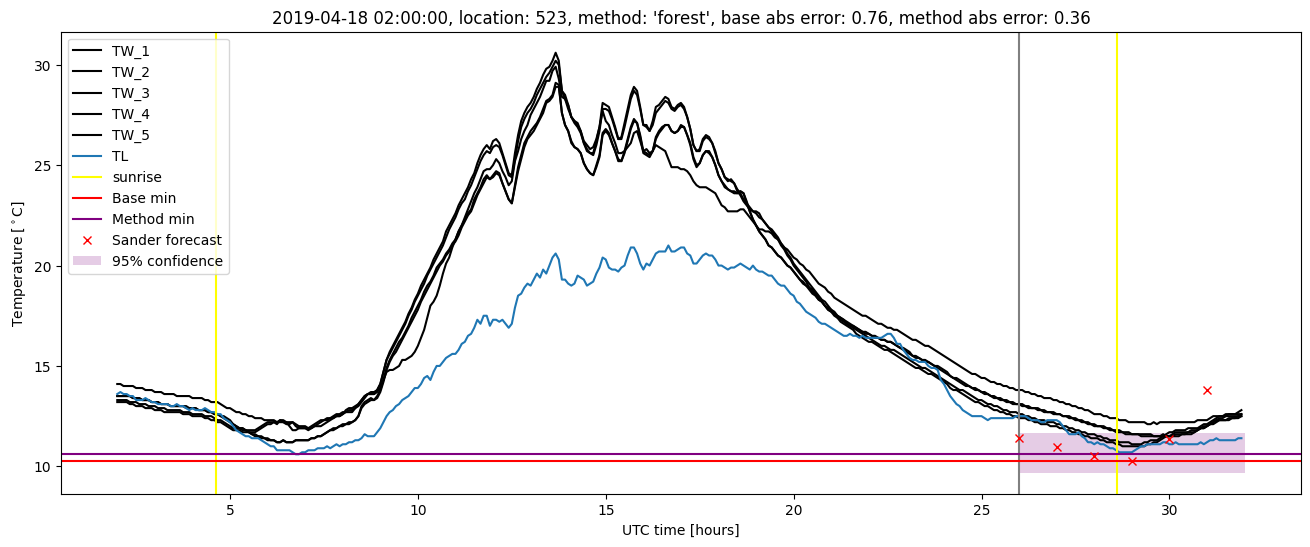
| forest |
winter 2018 |
0.991 |
0.037 |
0.314 |
0.397 |
2.743 |
0.455 |
2.564 |
| baseline |
winter 2019 |
0.983 |
0.000e+00 |
0.291 |
0.417 |
1.739 |
NaN |
NaN |
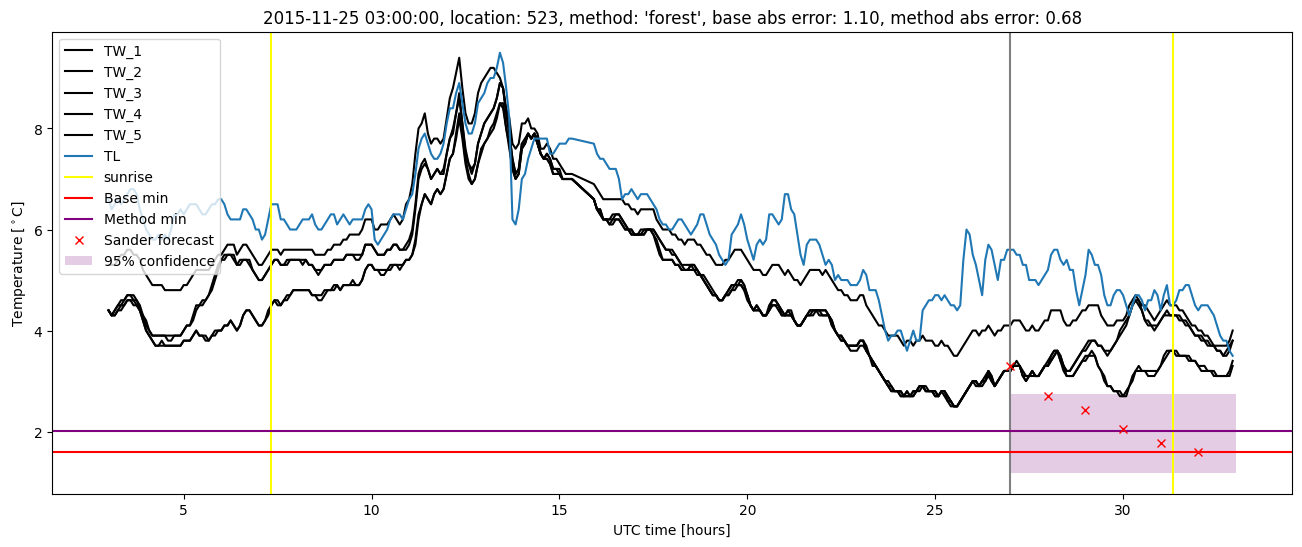
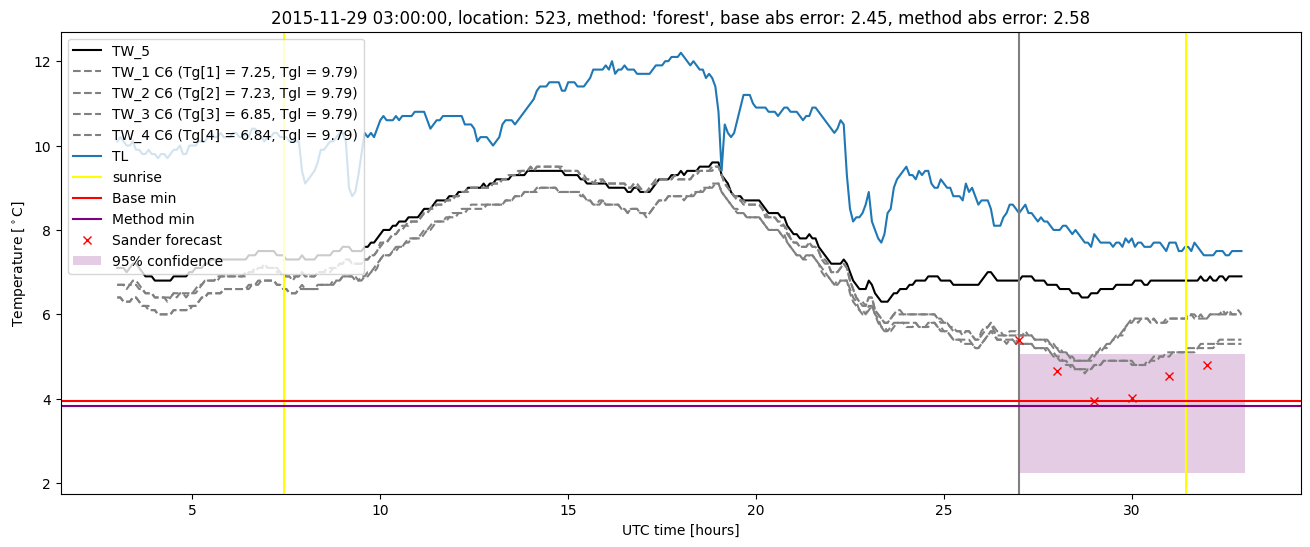
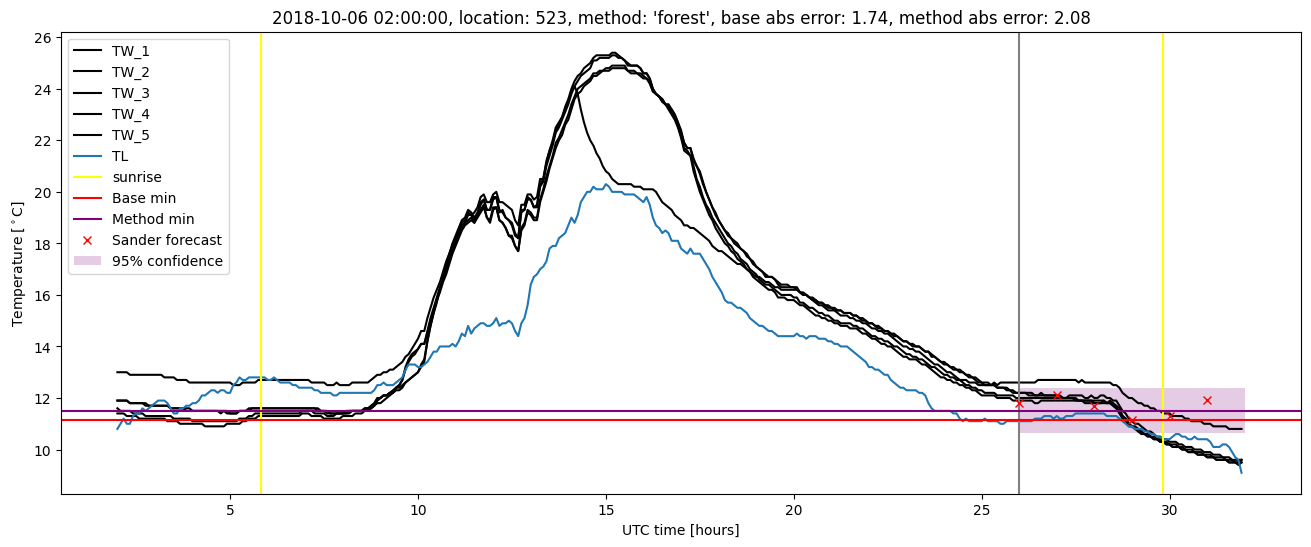
| forest |
winter 2019 |
0.983 |
0.000e+00 |
0.260 |
0.373 |
2.082 |
0.418 |
2.409 |
| baseline |
all |
0.985 |
0.049 |
0.364 |
0.447 |
2.635 |
NaN |
NaN |
| forest |
all |
0.987 |
0.049 |
0.283 |
0.379 |
2.743 |
0.449 |
2.899 |
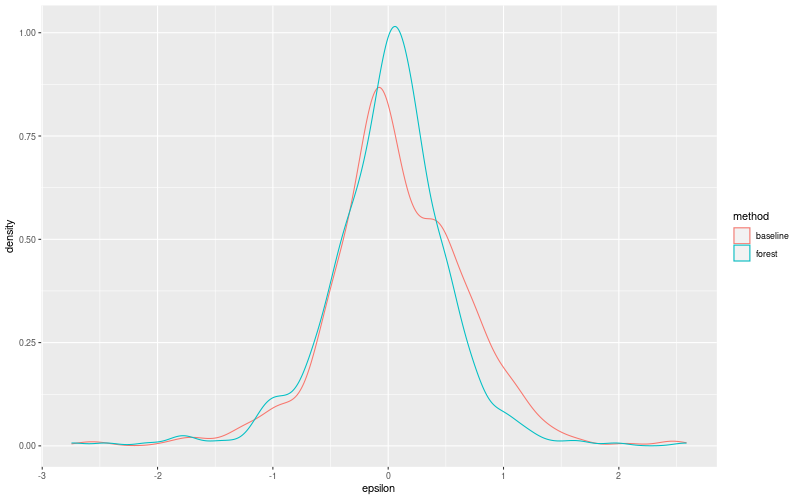
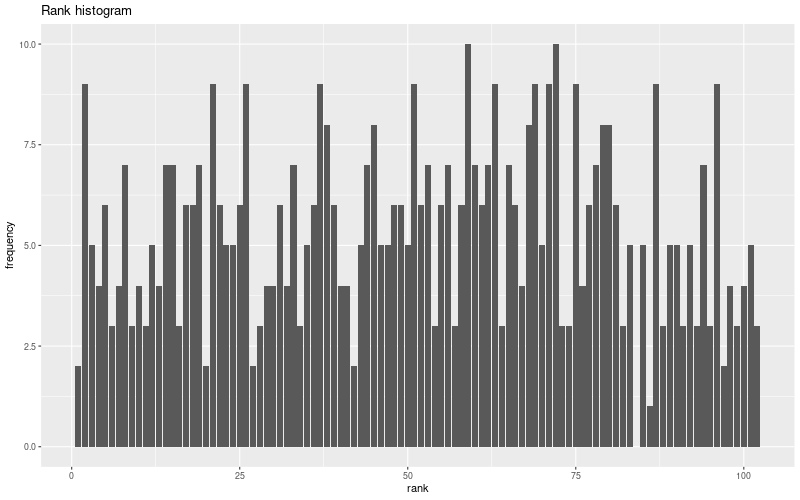
Random forest plots

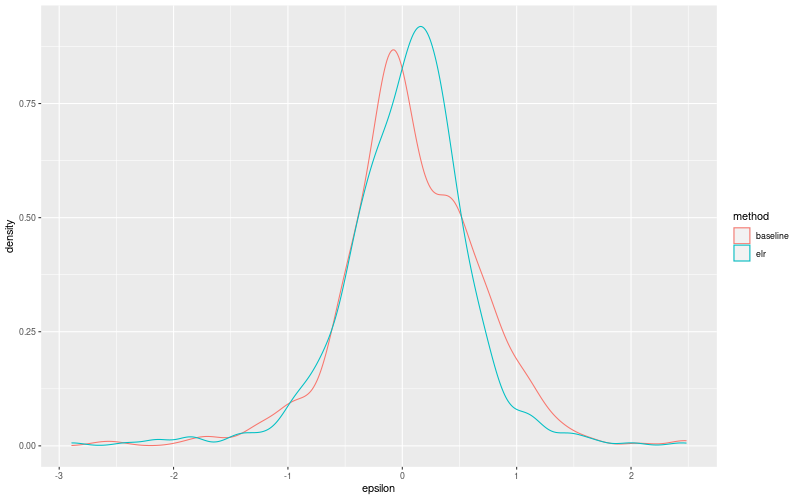
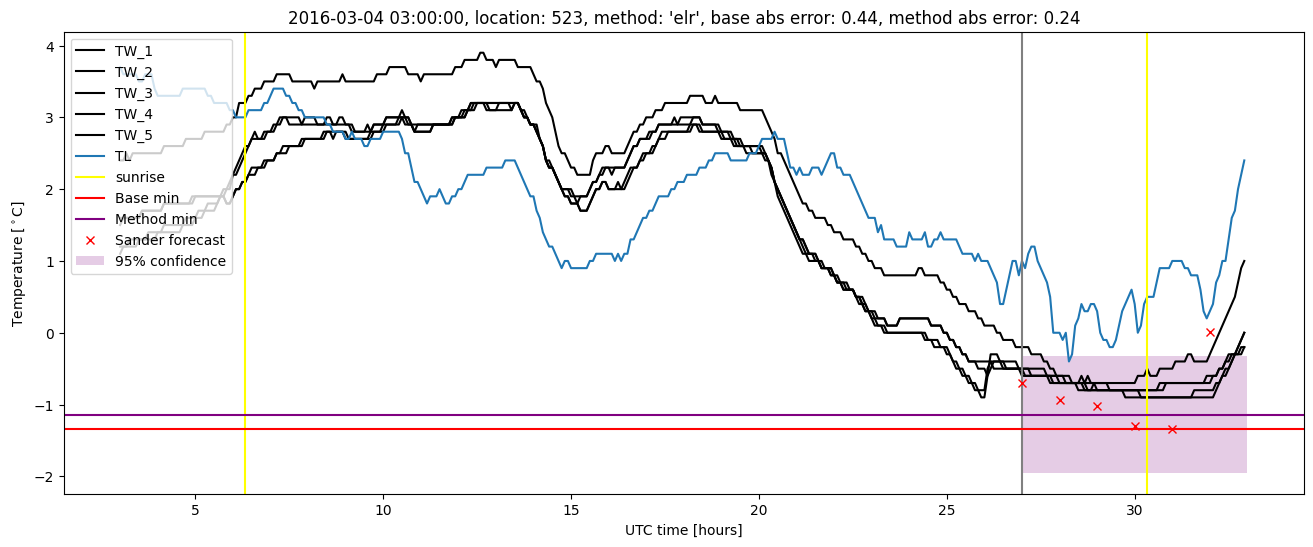
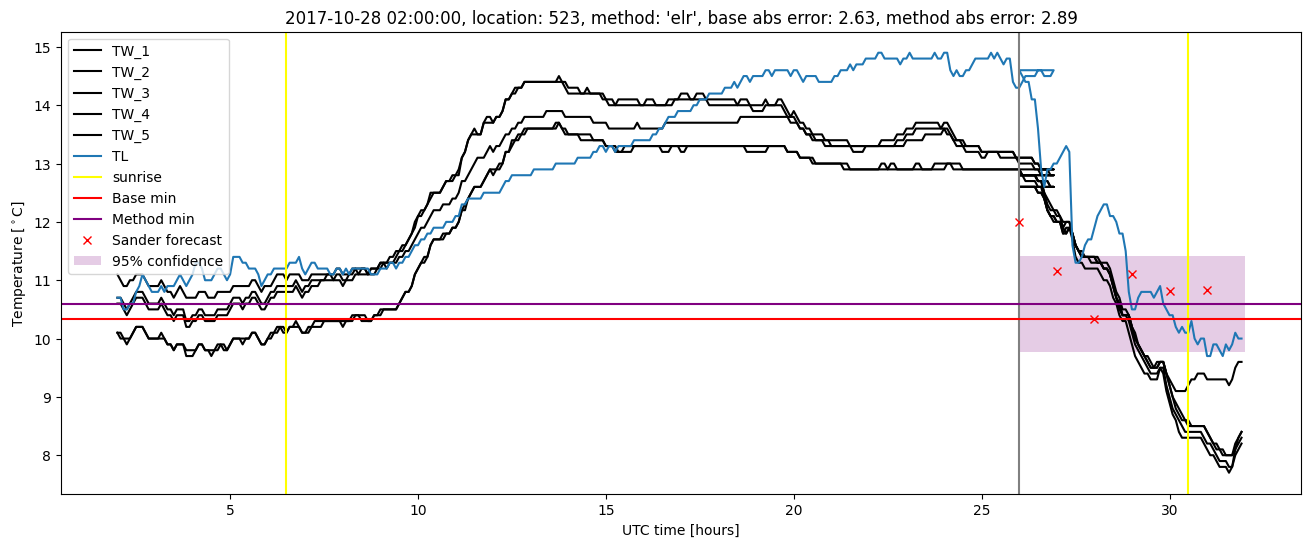
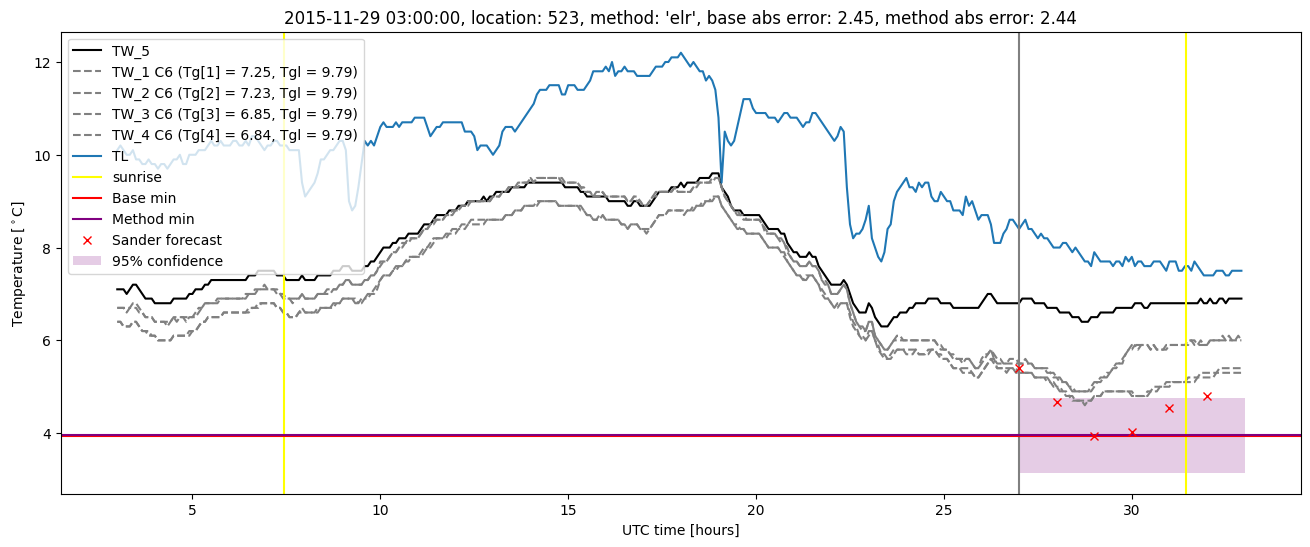
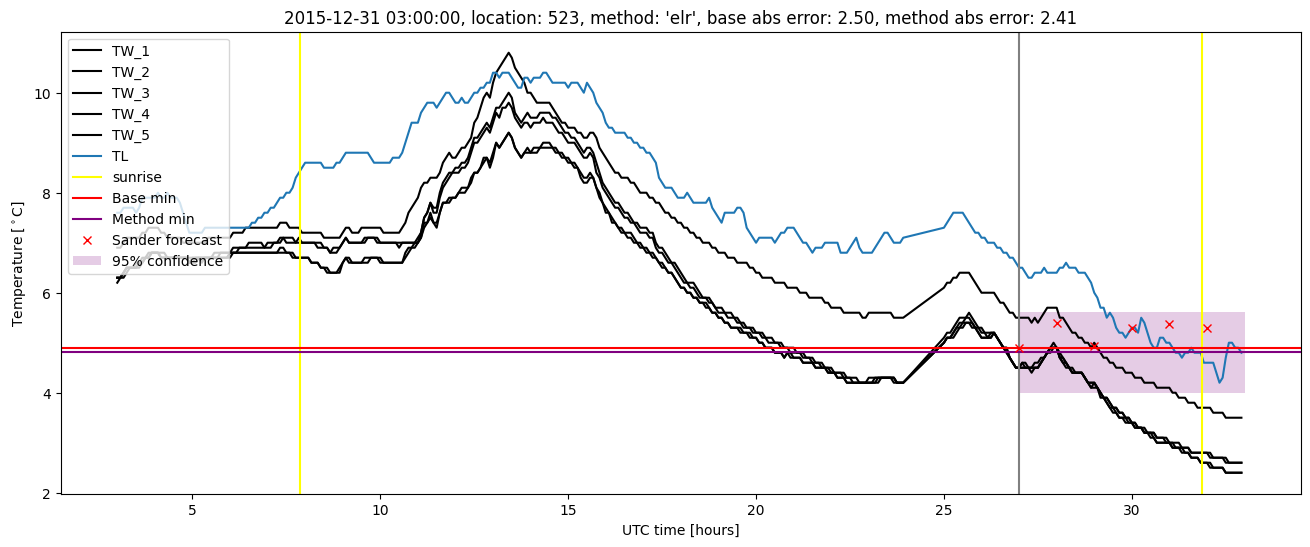
Extended logistic regression results
| names |
period |
power |
significance |
meanSquareError |
absError |
maxError |
CRPS |
IGN |
| baseline |
winter 2016 |
0.994 |
0.045 |
0.400 |
0.462 |
2.501 |
NaN |
NaN |
| elr |
winter 2016 |
0.988 |
0.045 |
0.328 |
0.403 |
2.444 |
0.531 |
5.528 |
| baseline |
winter 2017 |
0.960 |
0.071 |
0.350 |
0.449 |
2.482 |
NaN |
NaN |
| elr |
winter 2017 |
0.968 |
0.107 |
0.247 |
0.377 |
2.007 |
0.492 |
3.492 |
| baseline |
winter 2018 |
1.000 |
0.037 |
0.365 |
0.437 |
2.635 |
NaN |
NaN |
| elr |
winter 2018 |
0.991 |
0.037 |
0.347 |
0.423 |
2.889 |
0.521 |
4.938 |
| baseline |
winter 2019 |
0.983 |
0.000e+00 |
0.291 |
0.417 |
1.739 |
NaN |
NaN |
| elr |
winter 2019 |
0.983 |
0.000e+00 |
0.293 |
0.410 |
2.148 |
0.482 |
3.523 |
| baseline |
all |
0.985 |
0.049 |
0.364 |
0.447 |
2.635 |
NaN |
NaN |
| elr |
all |
0.983 |
0.061 |
0.306 |
0.402 |
2.889 |
0.512 |
4.572 |
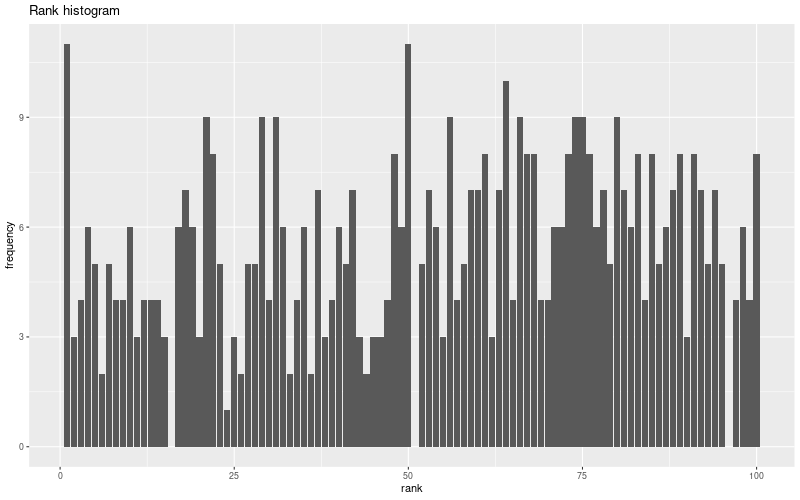
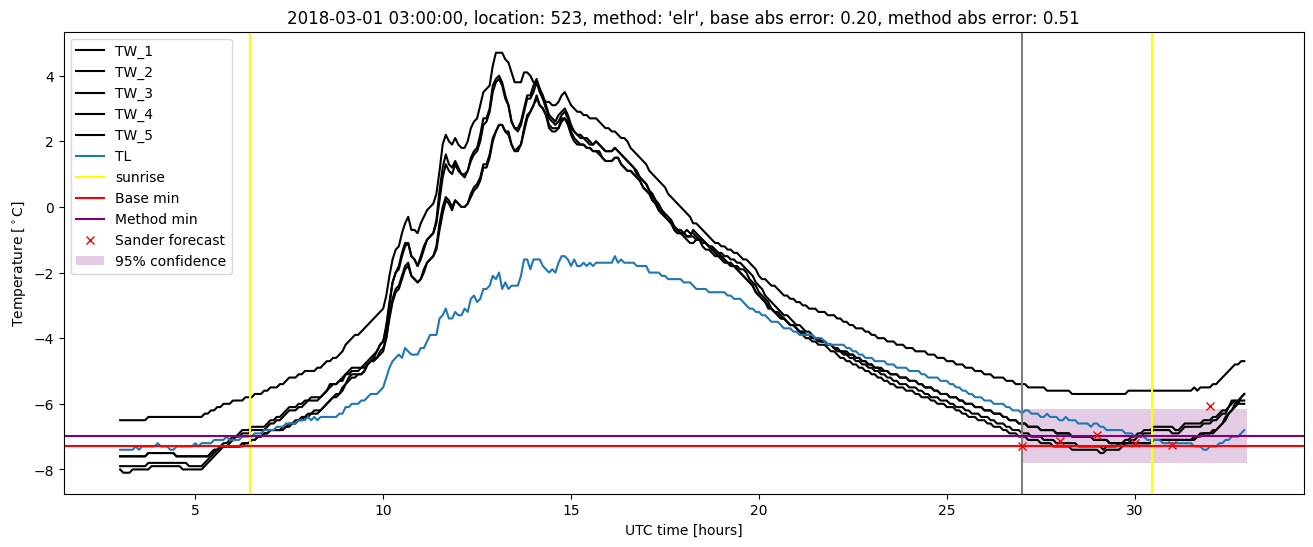
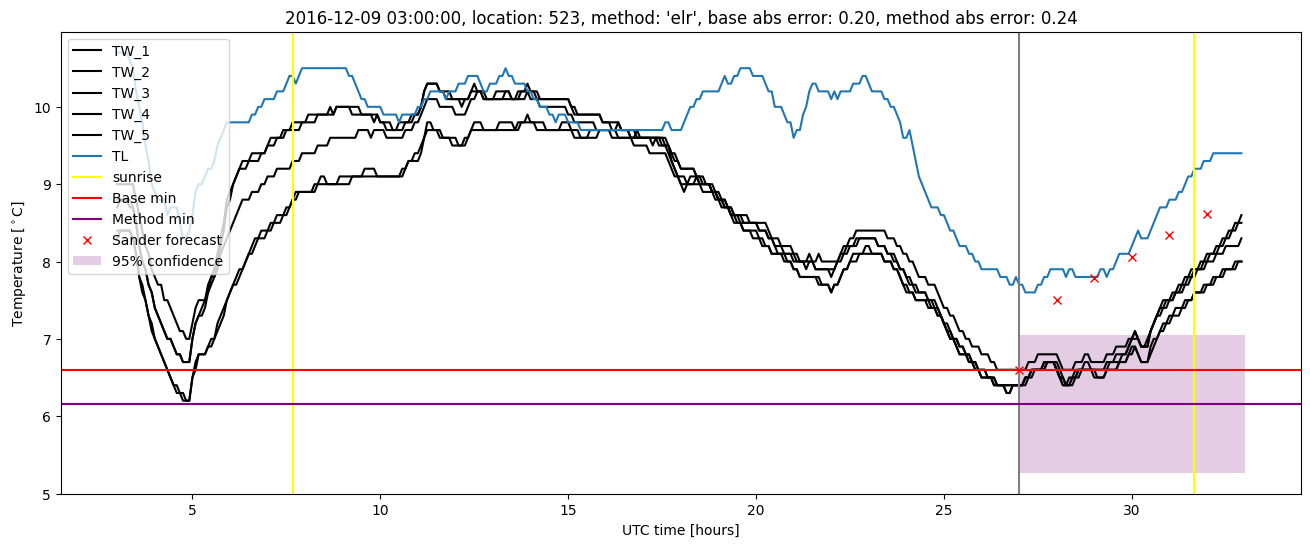
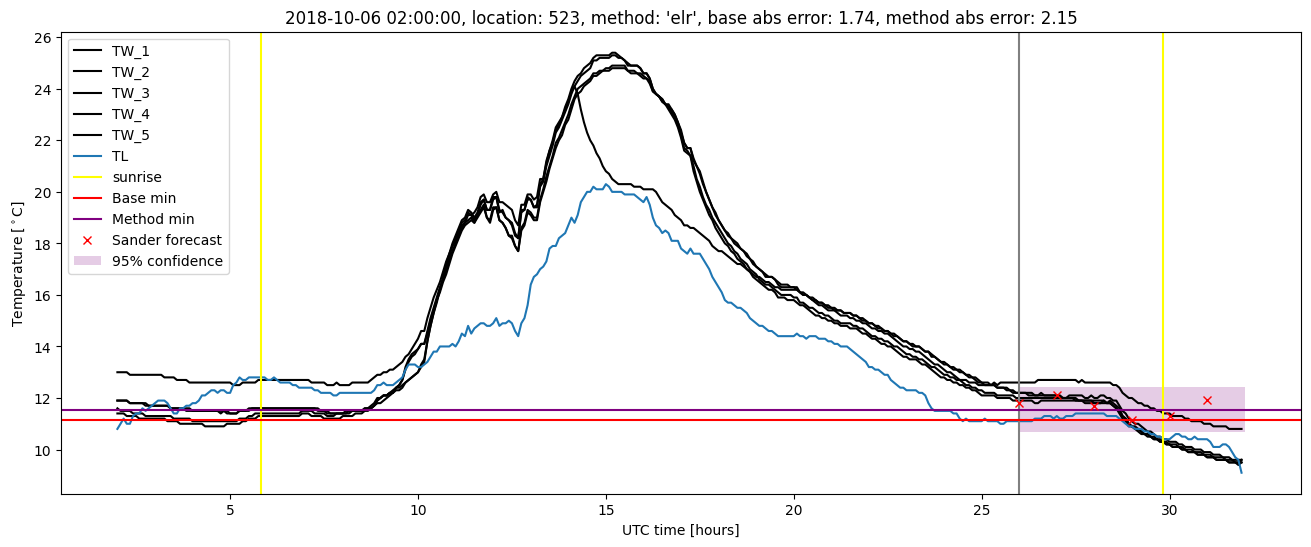
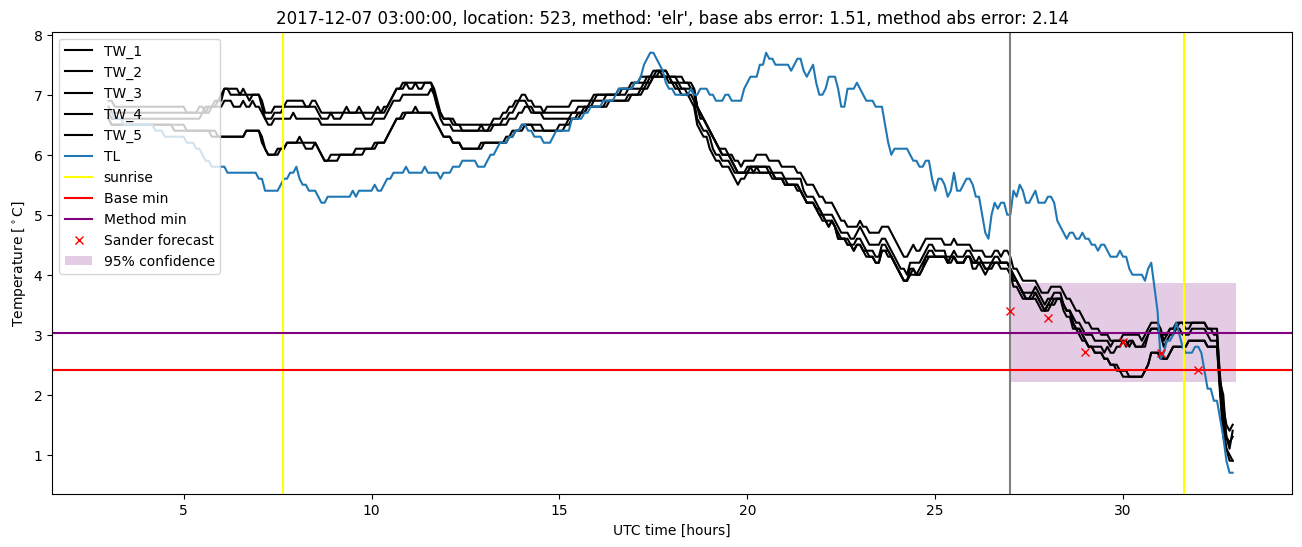
Extended logistic regression plots