GMS location: 522
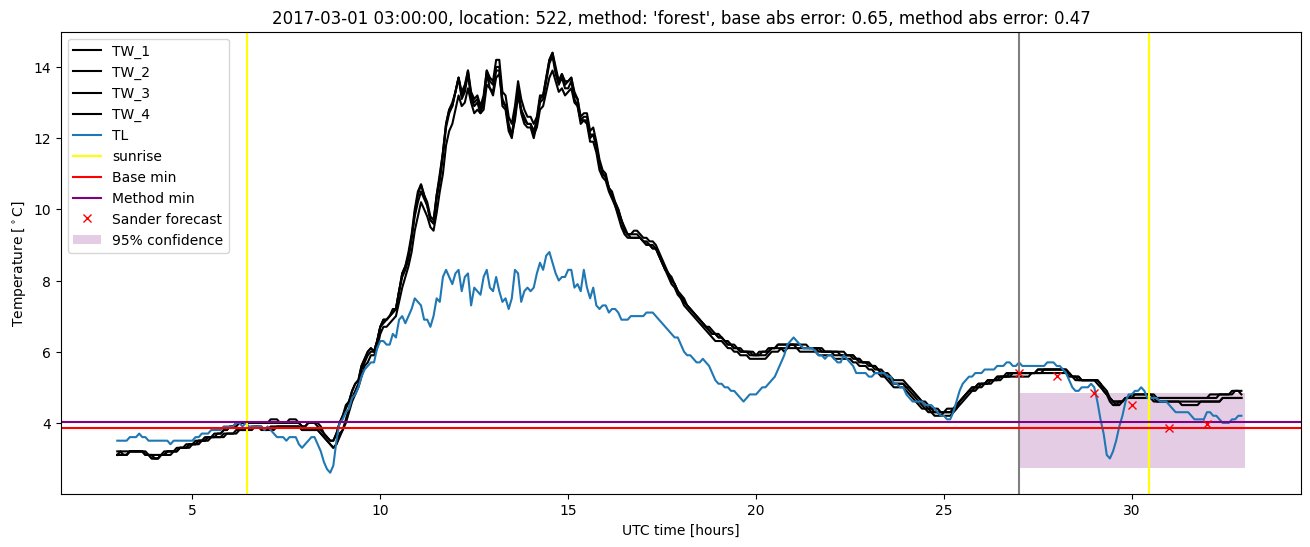
Random forest results
| names |
period |
power |
significance |
meanSquareError |
absError |
maxError |
CRPS |
IGN |
| baseline |
winter 2016 |
0.988 |
0.000e+00 |
0.577 |
0.493 |
4.795 |
NaN |
NaN |
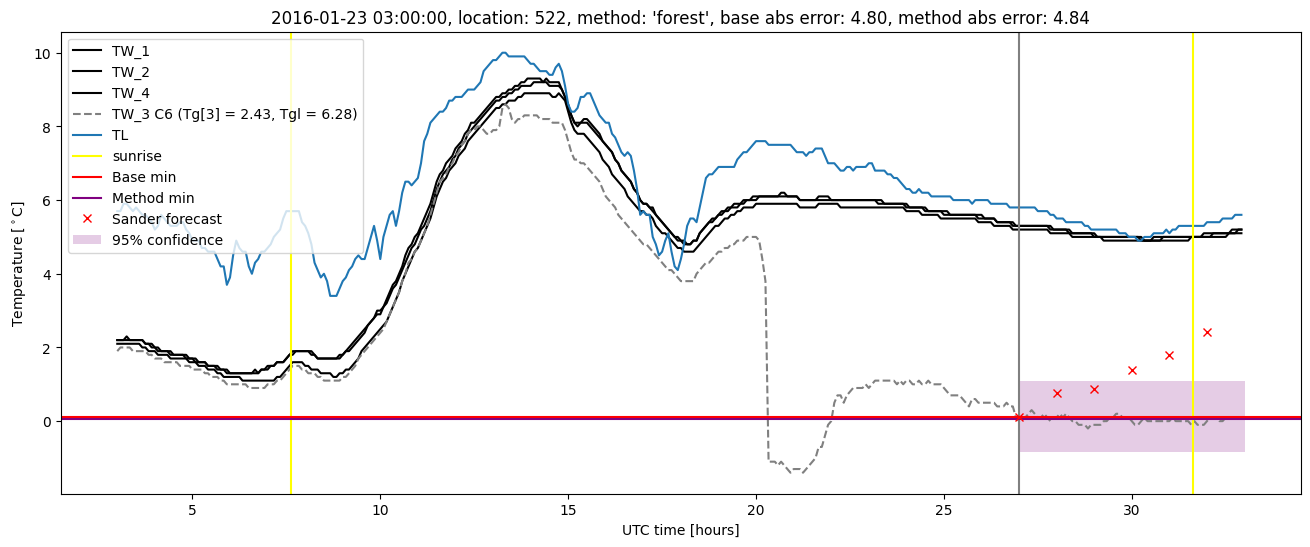
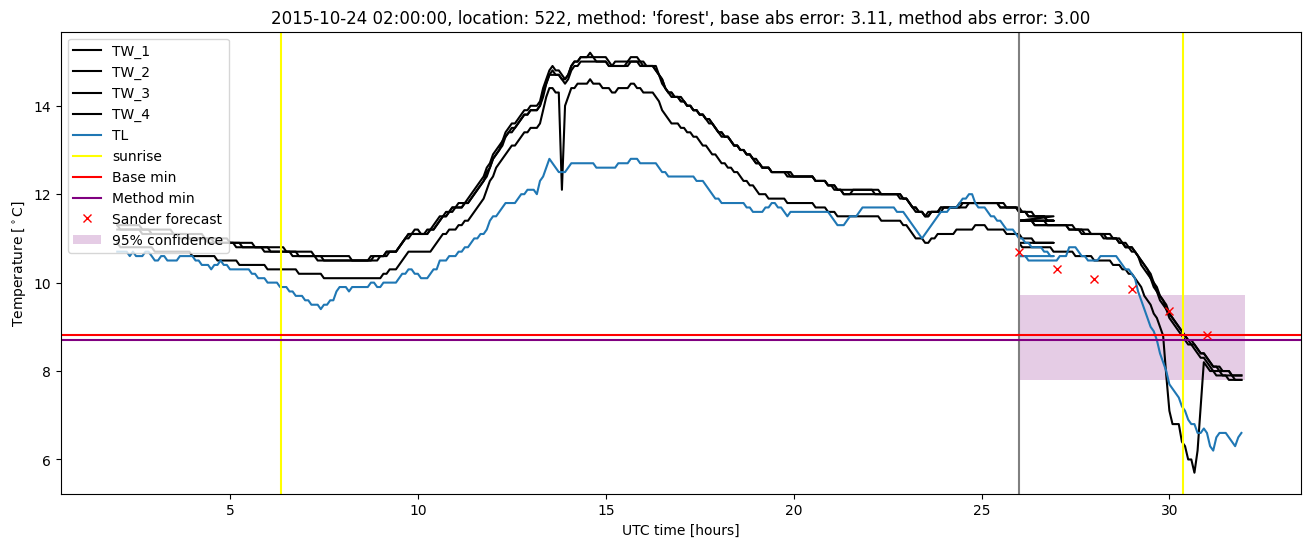
| forest |
winter 2016 |
0.994 |
0.000e+00 |
0.503 |
0.442 |
4.842 |
0.470 |
2.346 |
| baseline |
winter 2017 |
0.958 |
0.067 |
0.421 |
0.468 |
2.854 |
NaN |
NaN |
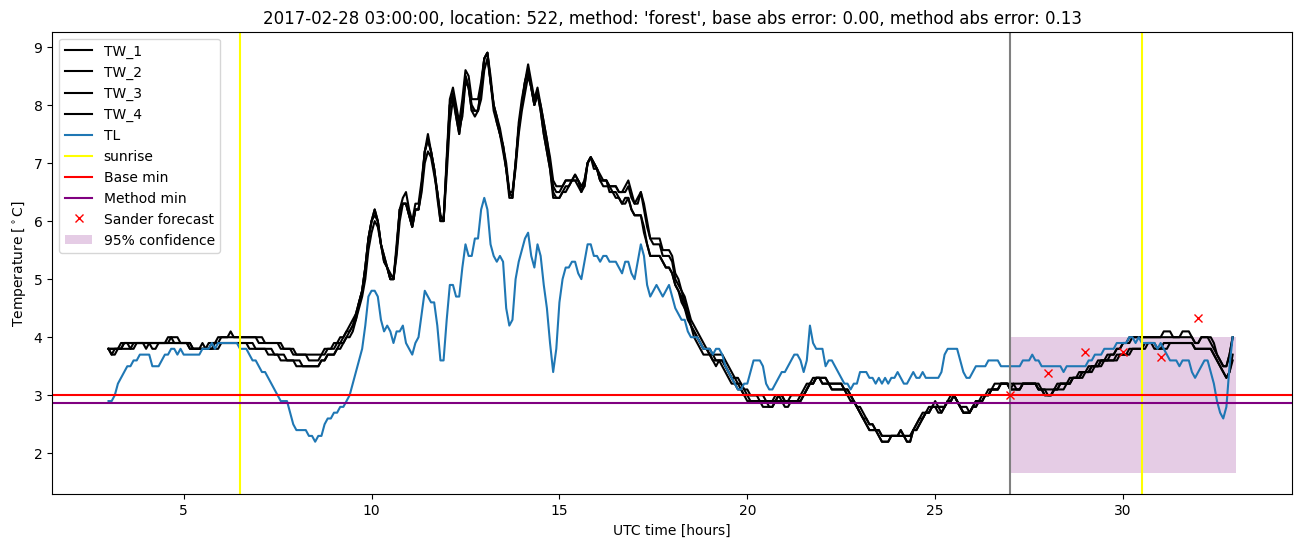
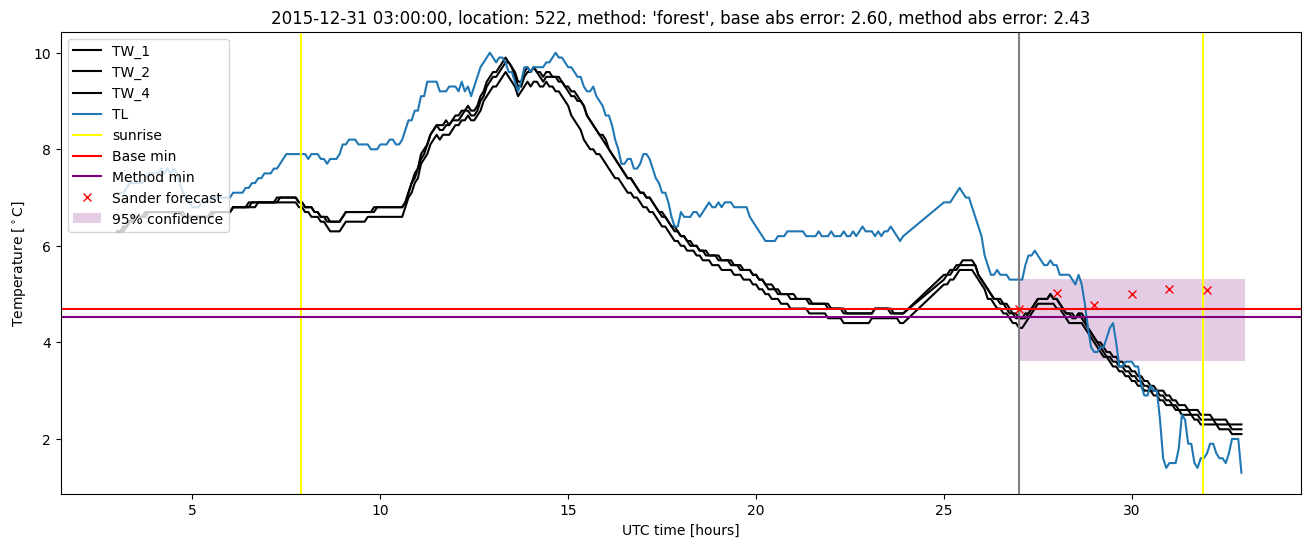
| forest |
winter 2017 |
0.983 |
0.033 |
0.340 |
0.415 |
2.352 |
0.456 |
1.470 |
| baseline |
winter 2018 |
1.000 |
0.074 |
0.376 |
0.455 |
2.233 |
NaN |
NaN |
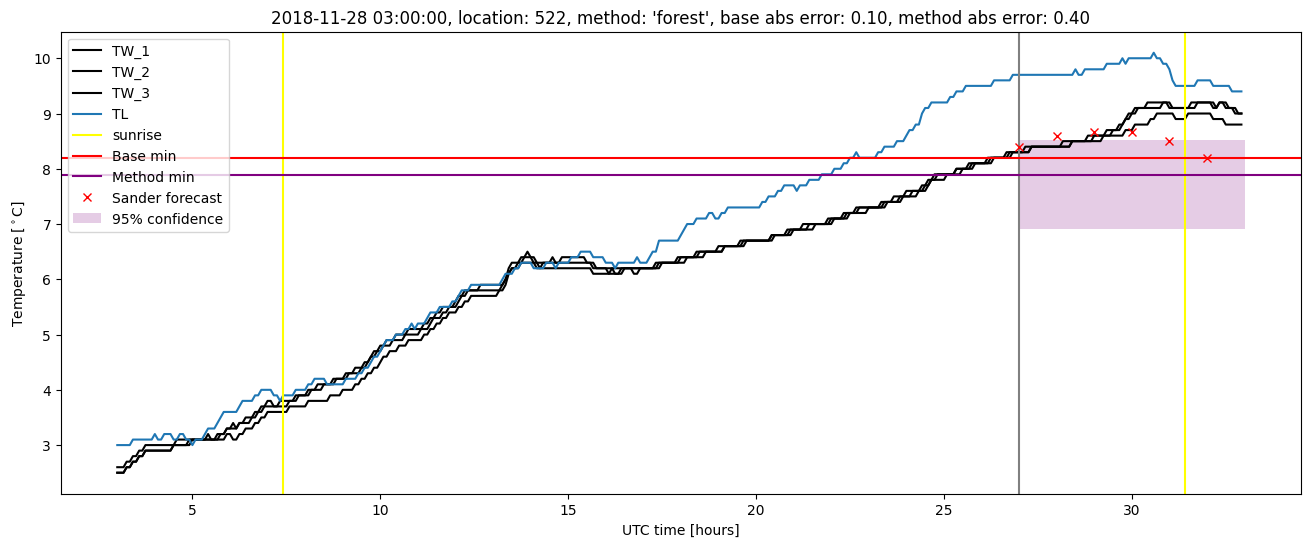
| forest |
winter 2018 |
1.000 |
0.074 |
0.350 |
0.449 |
2.021 |
0.478 |
1.839 |
| baseline |
winter 2019 |
0.987 |
0.000e+00 |
0.354 |
0.405 |
3.298 |
NaN |
NaN |
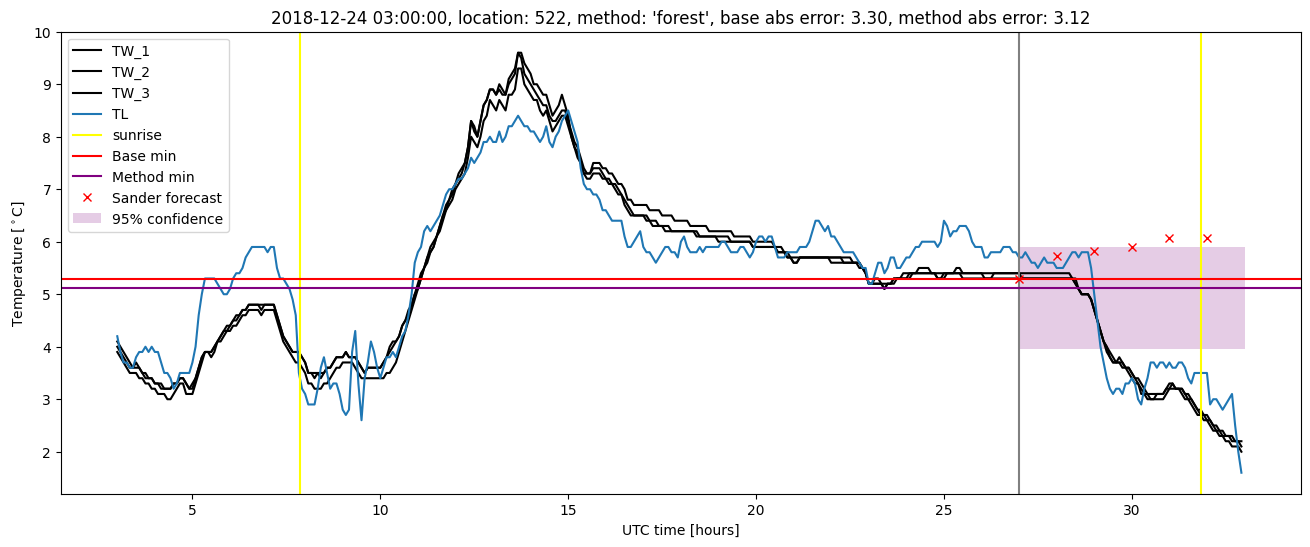
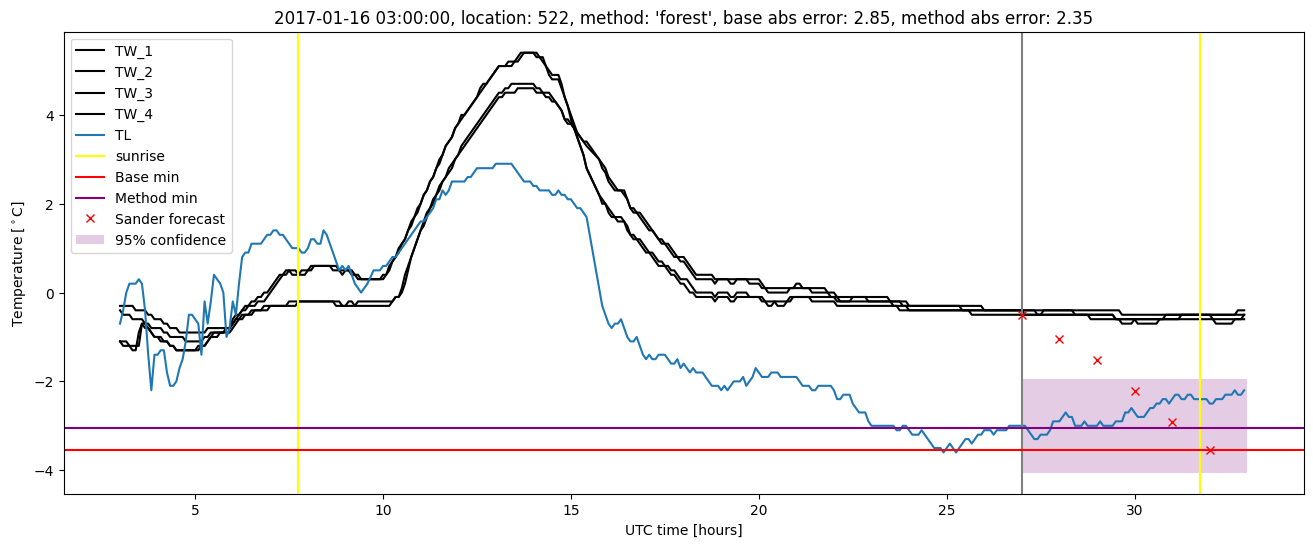
| forest |
winter 2019 |
0.993 |
0.167 |
0.304 |
0.378 |
3.125 |
0.464 |
1.751 |
| baseline |
all |
0.984 |
0.048 |
0.437 |
0.457 |
4.795 |
NaN |
NaN |
| forest |
all |
0.993 |
0.048 |
0.379 |
0.423 |
4.842 |
0.468 |
1.874 |
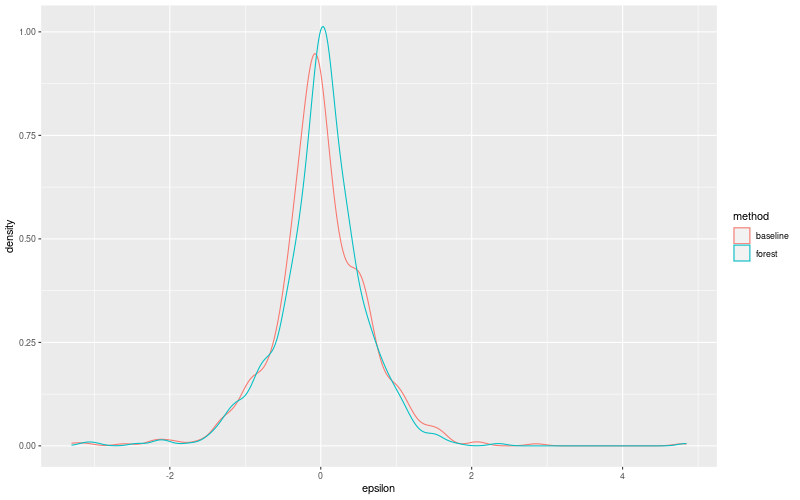
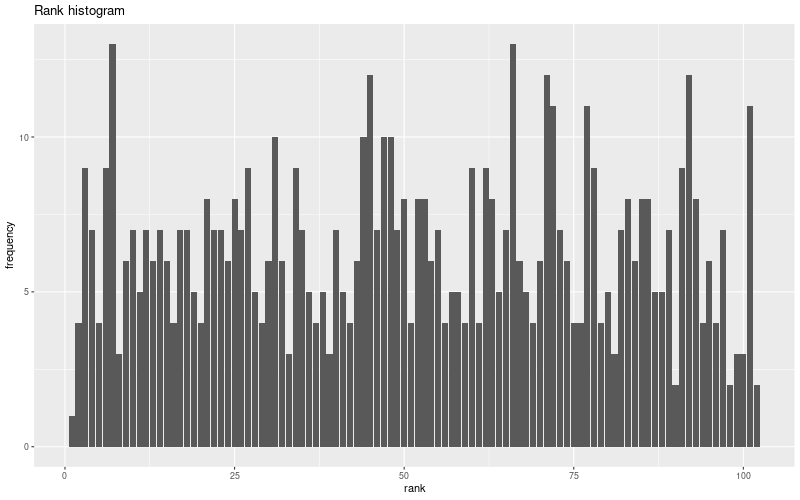
Random forest plots
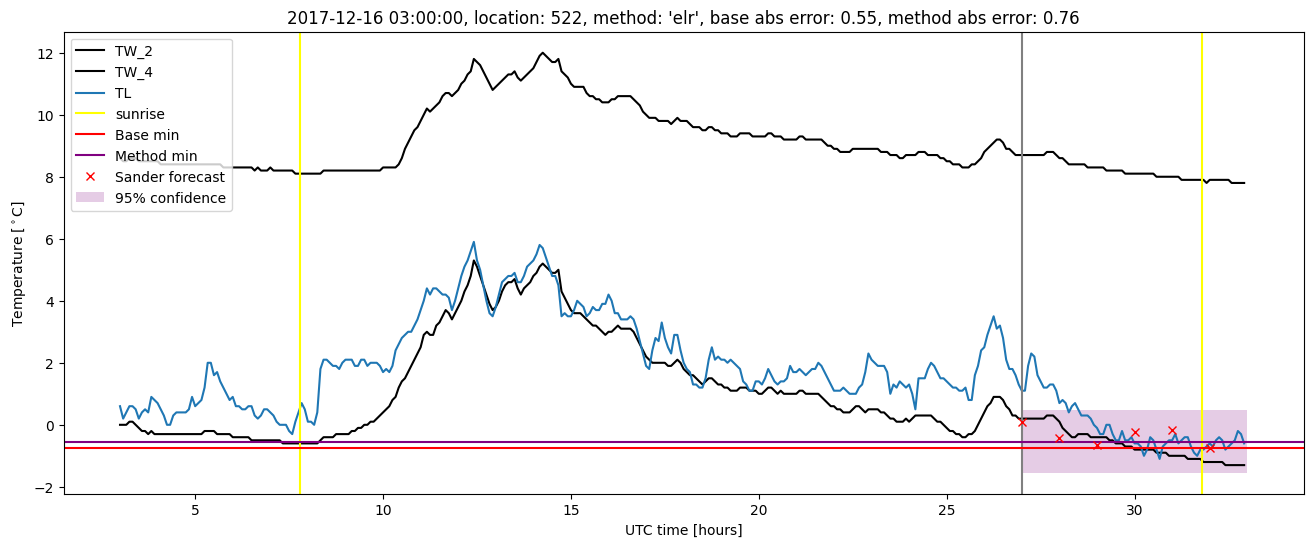
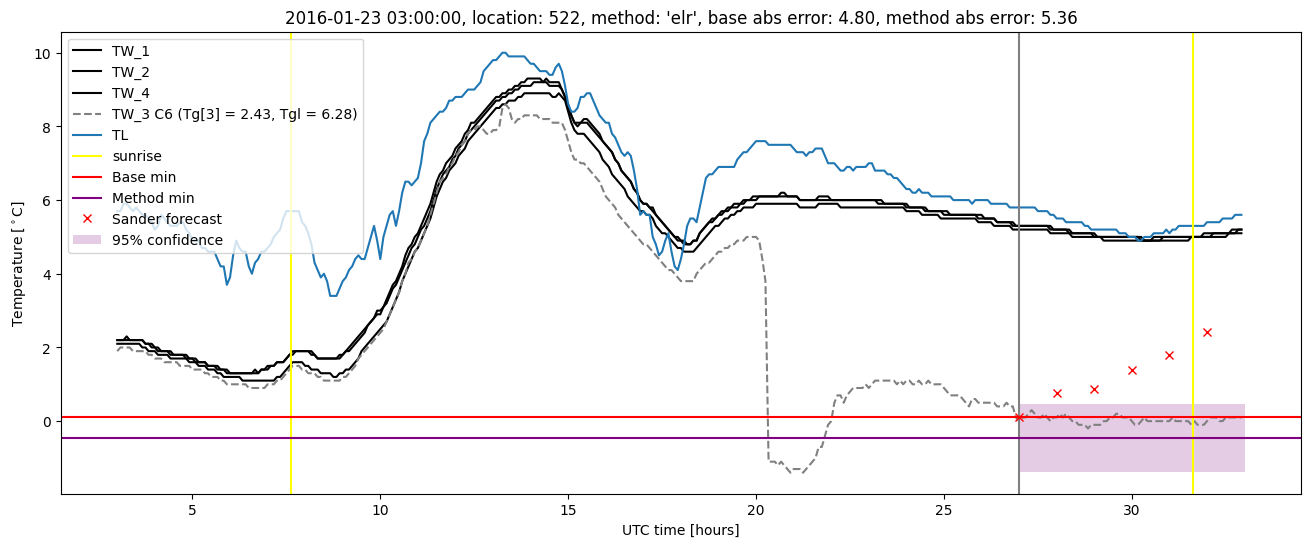
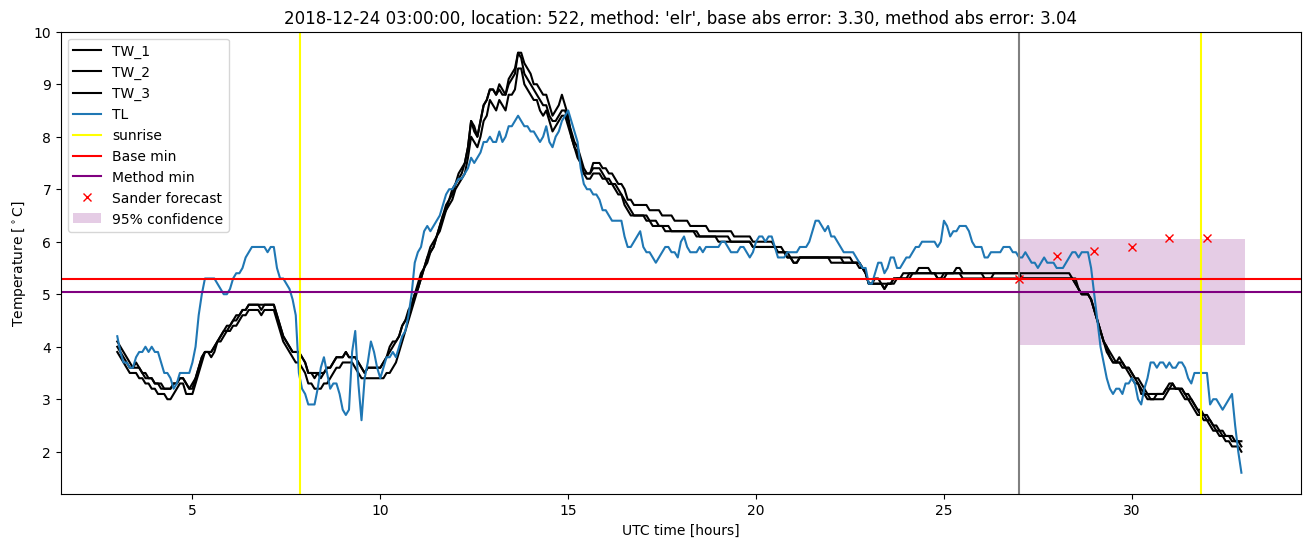
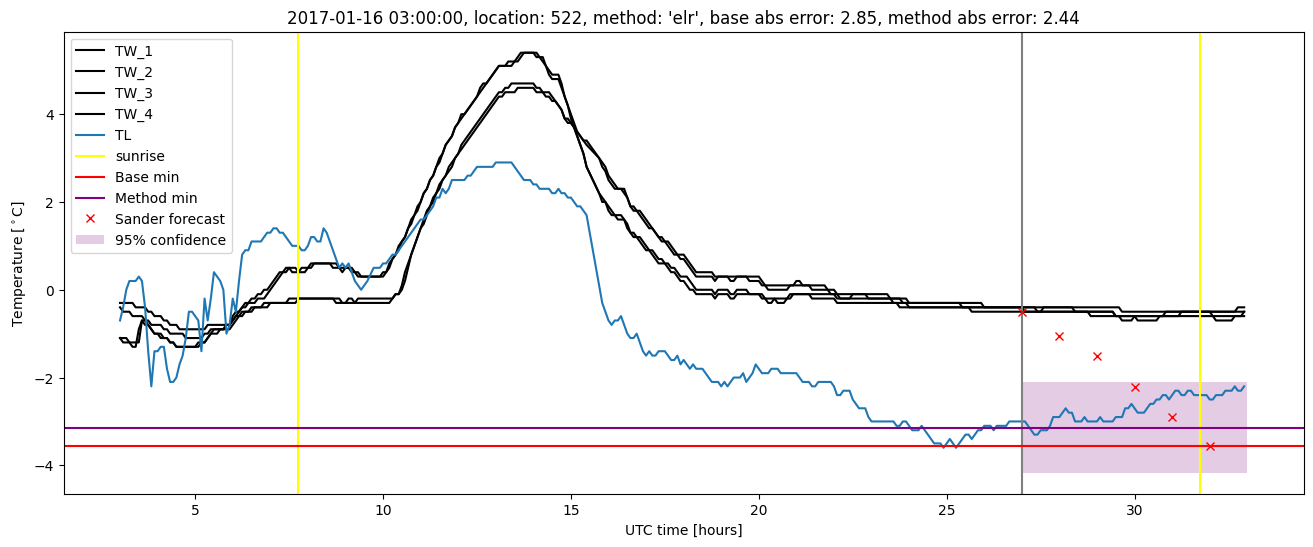
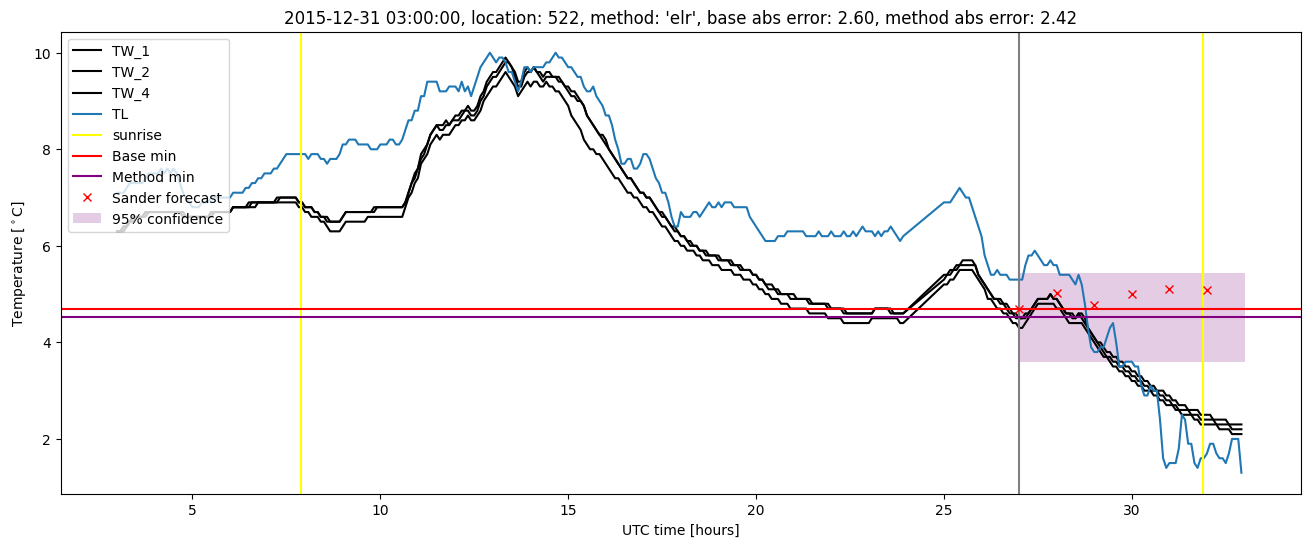
Extended logistic regression results
| names |
period |
power |
significance |
meanSquareError |
absError |
maxError |
CRPS |
IGN |
| baseline |
winter 2016 |
0.988 |
0.000e+00 |
0.577 |
0.493 |
4.795 |
NaN |
NaN |
| elr |
winter 2016 |
0.988 |
0.000e+00 |
0.538 |
0.463 |
5.362 |
0.541 |
3.665 |
| baseline |
winter 2017 |
0.958 |
0.067 |
0.421 |
0.468 |
2.854 |
NaN |
NaN |
| elr |
winter 2017 |
0.967 |
0.033 |
0.359 |
0.447 |
2.443 |
0.511 |
2.390 |
| baseline |
winter 2018 |
1.000 |
0.074 |
0.376 |
0.455 |
2.233 |
NaN |
NaN |
| elr |
winter 2018 |
1.000 |
0.074 |
0.374 |
0.480 |
2.221 |
0.556 |
2.943 |
| baseline |
winter 2019 |
0.987 |
0.000e+00 |
0.354 |
0.405 |
3.298 |
NaN |
NaN |
| elr |
winter 2019 |
1.000 |
0.167 |
0.350 |
0.432 |
3.045 |
0.511 |
2.426 |
| baseline |
all |
0.984 |
0.048 |
0.437 |
0.457 |
4.795 |
NaN |
NaN |
| elr |
all |
0.990 |
0.048 |
0.410 |
0.457 |
5.362 |
0.531 |
2.894 |
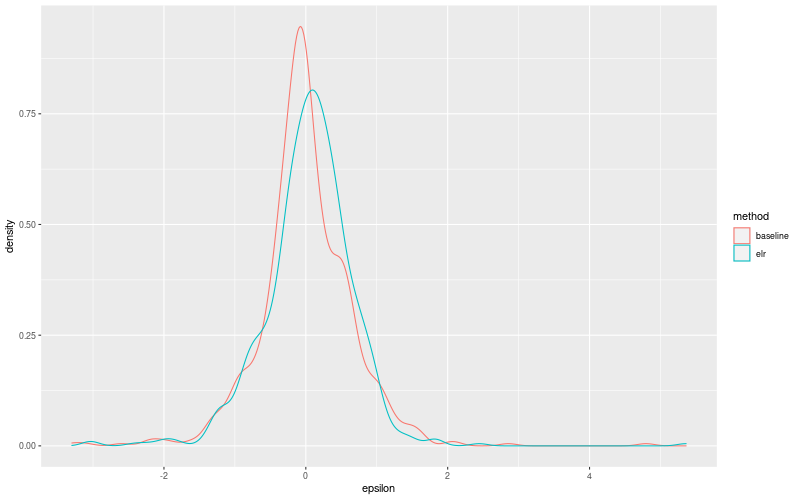
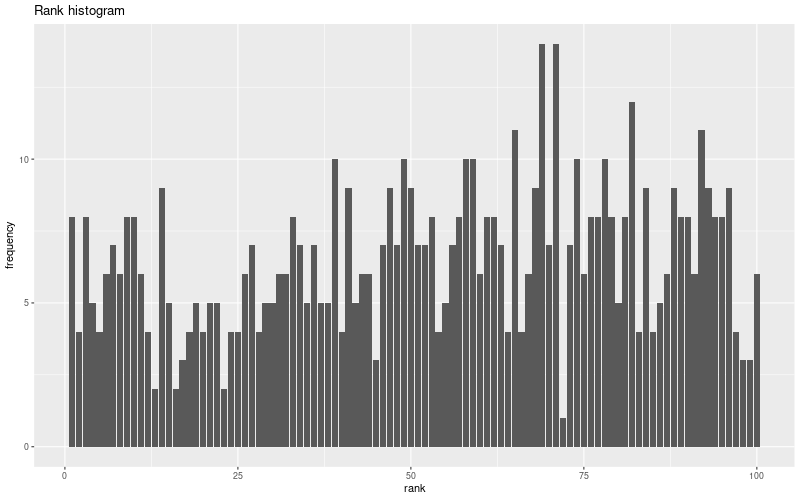
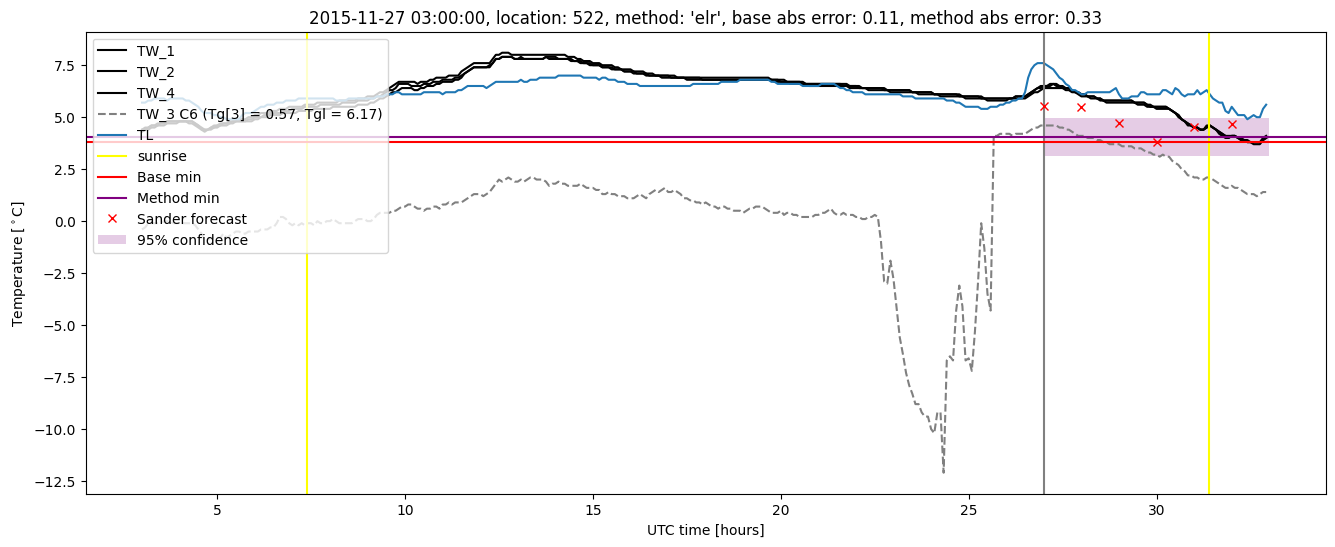
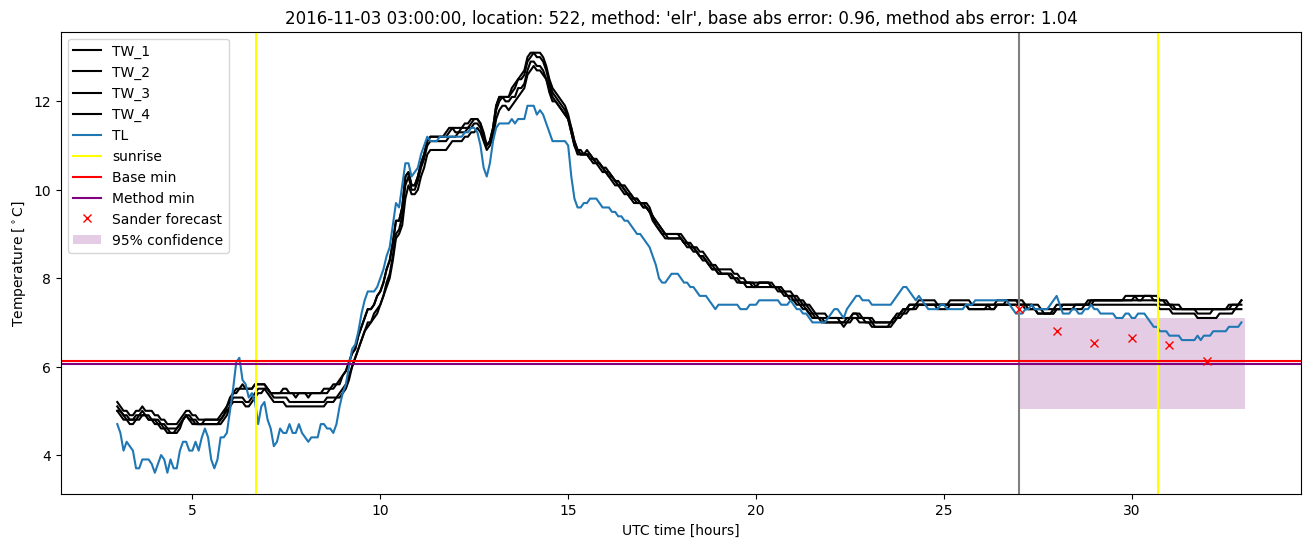
Extended logistic regression plots