GMS location: 521
Random forest results
| names |
period |
power |
significance |
meanSquareError |
absError |
maxError |
CRPS |
IGN |
| baseline |
winter 2016 |
0.982 |
0.048 |
0.391 |
0.473 |
2.601 |
NaN |
NaN |
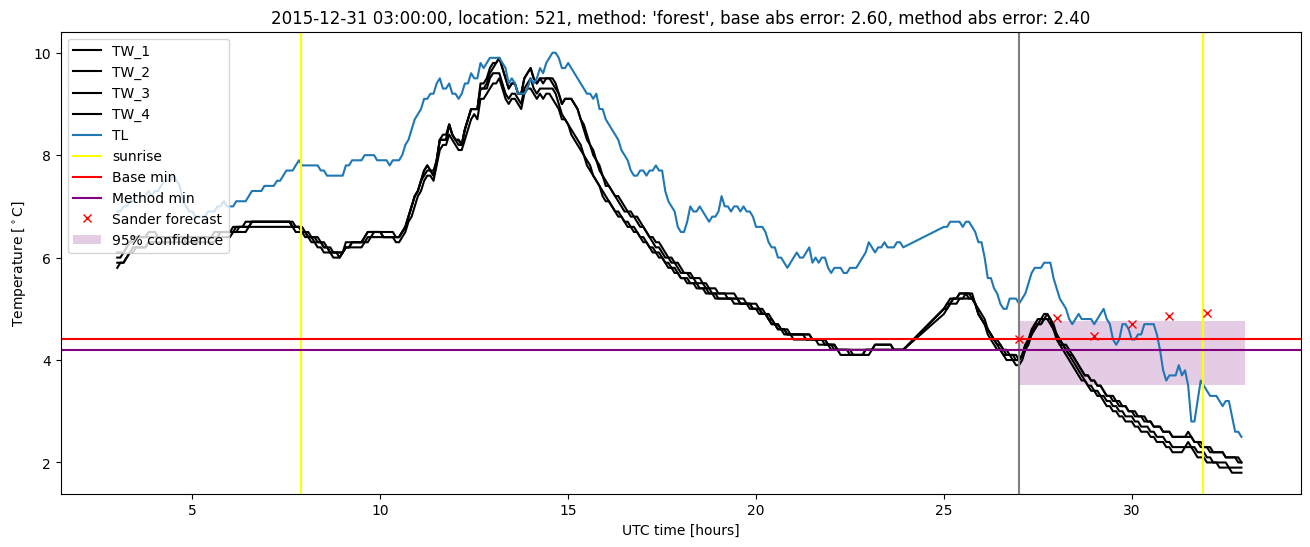
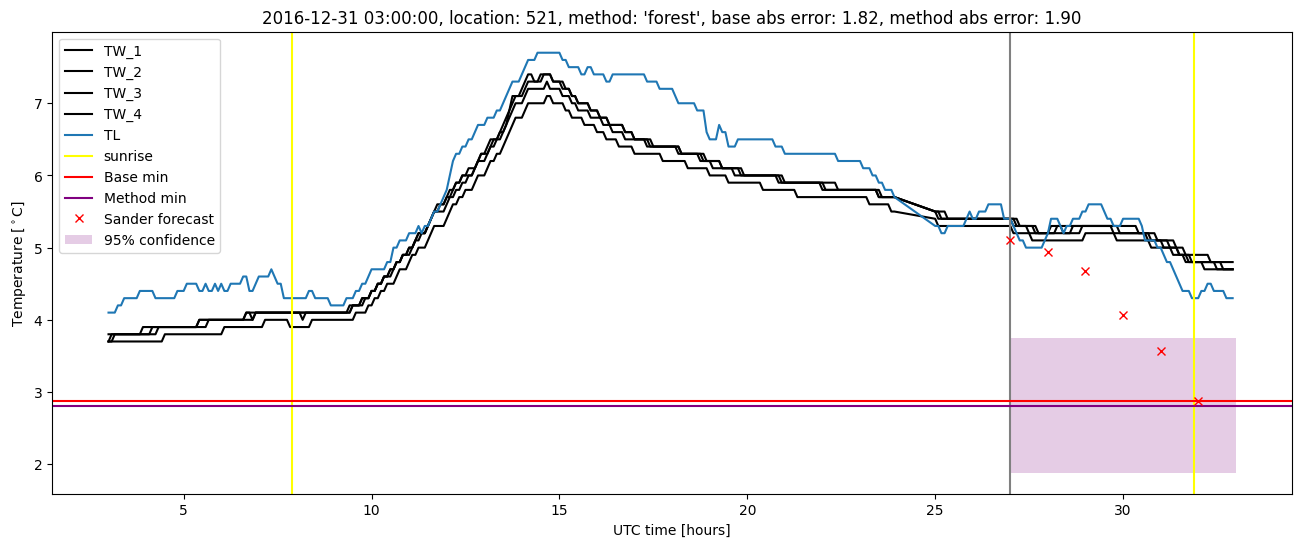
| forest |
winter 2016 |
0.994 |
0.048 |
0.296 |
0.410 |
2.404 |
0.523 |
3.943 |
| baseline |
winter 2017 |
0.983 |
0.094 |
0.420 |
0.470 |
2.738 |
NaN |
NaN |
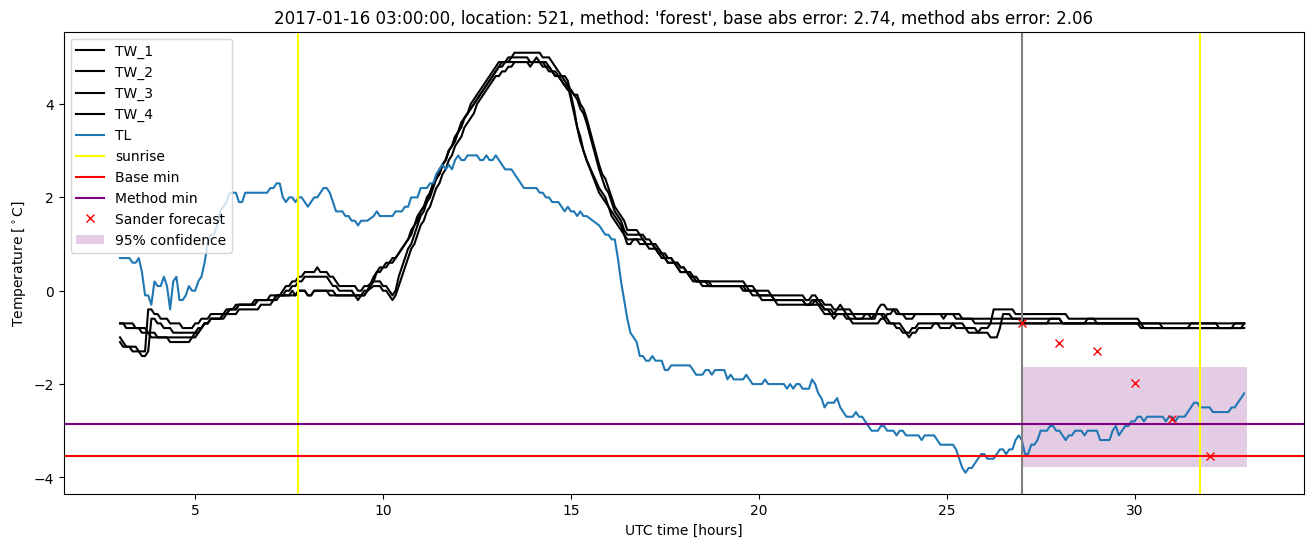
| forest |
winter 2017 |
0.983 |
0.125 |
0.316 |
0.402 |
2.063 |
0.504 |
3.814 |
| baseline |
winter 2018 |
0.993 |
0.071 |
0.354 |
0.421 |
2.344 |
NaN |
NaN |
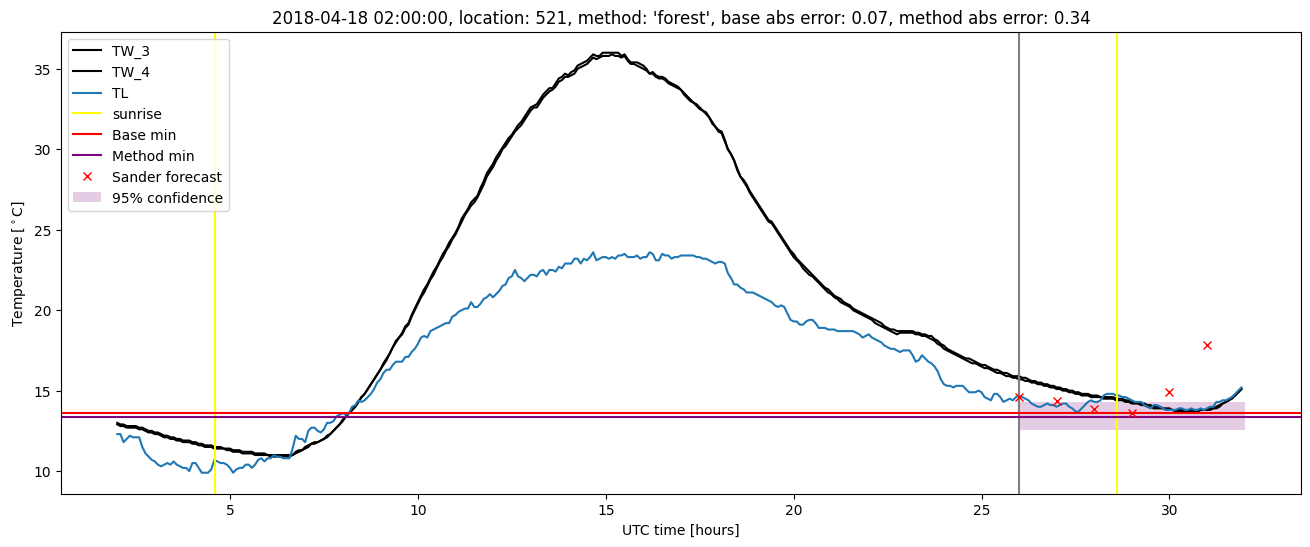
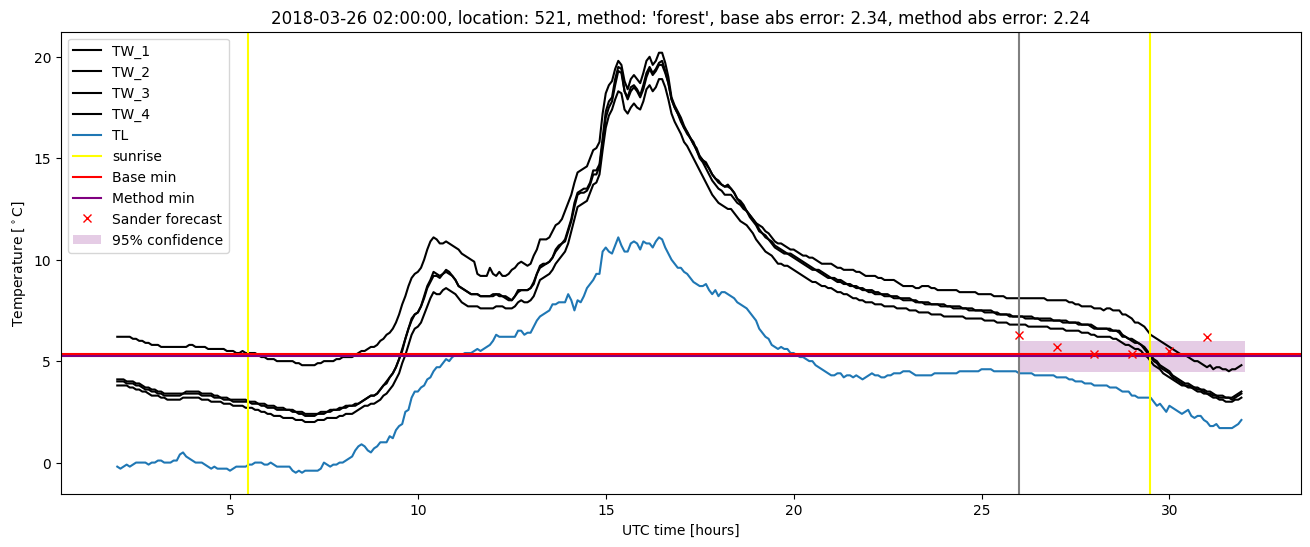
| forest |
winter 2018 |
0.993 |
0.071 |
0.310 |
0.405 |
2.238 |
0.530 |
3.433 |
| baseline |
winter 2019 |
0.993 |
0.000e+00 |
0.264 |
0.388 |
1.626 |
NaN |
NaN |
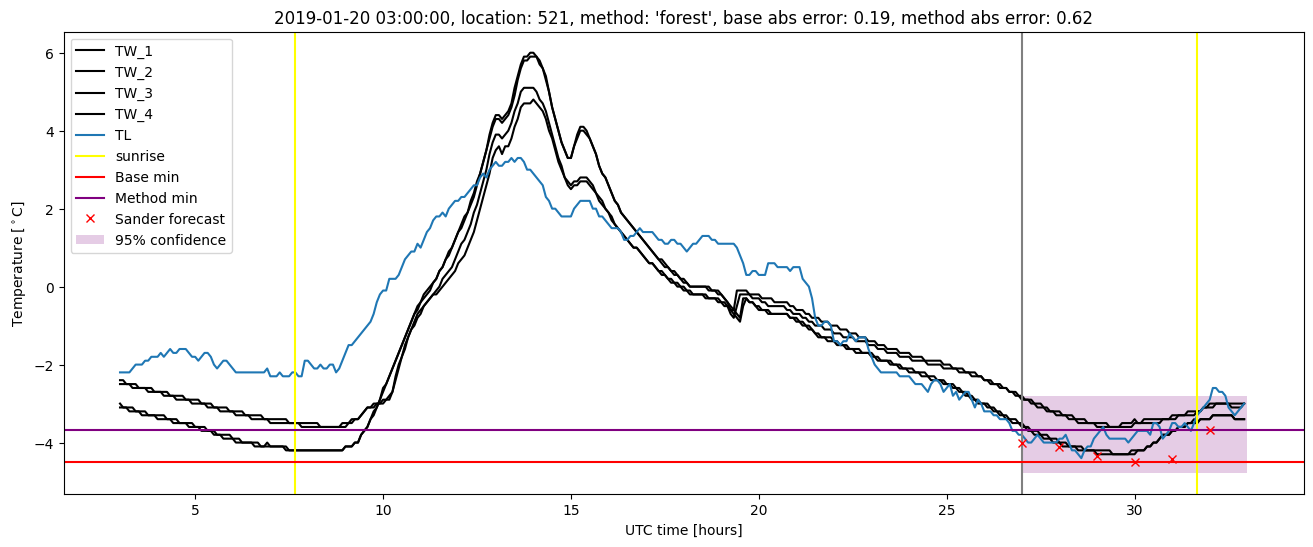
| forest |
winter 2019 |
0.993 |
0.000e+00 |
0.193 |
0.327 |
1.309 |
0.514 |
3.176 |
| baseline |
all |
0.988 |
0.065 |
0.358 |
0.439 |
2.738 |
NaN |
NaN |
| forest |
all |
0.991 |
0.076 |
0.280 |
0.387 |
2.404 |
0.518 |
3.603 |
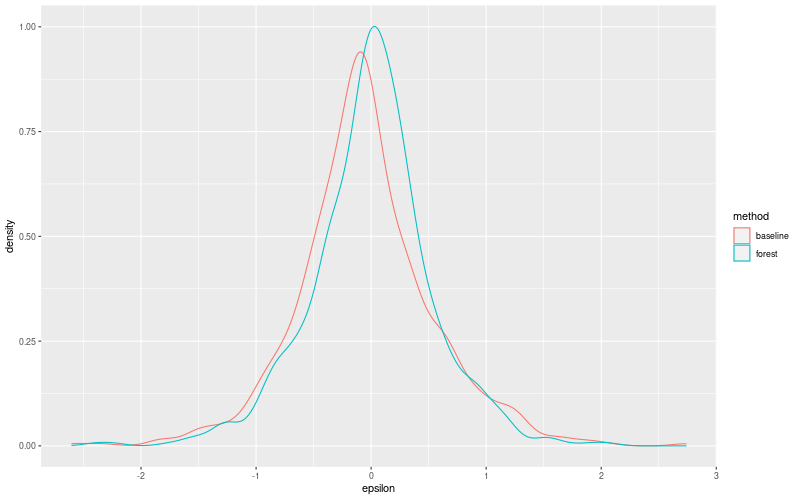
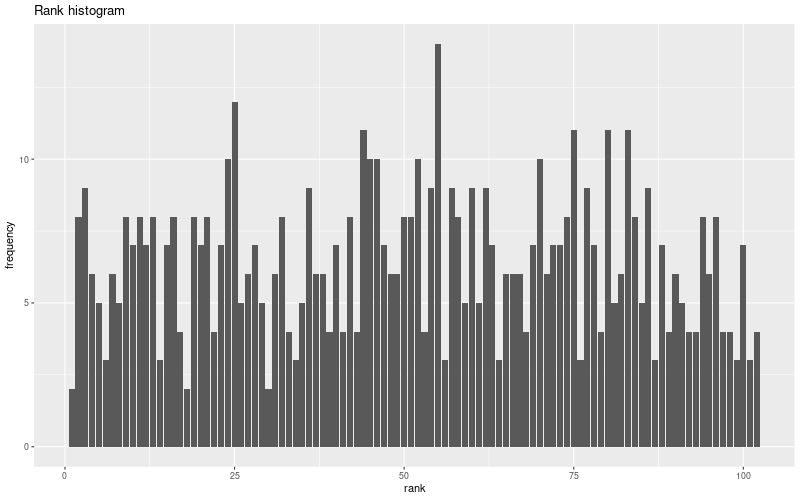
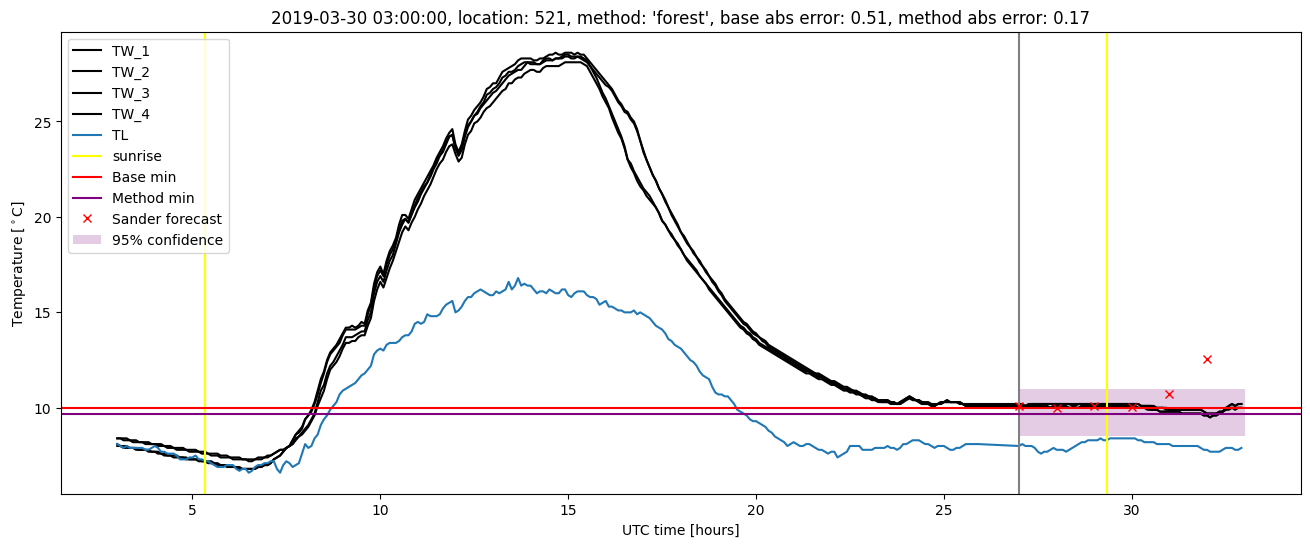
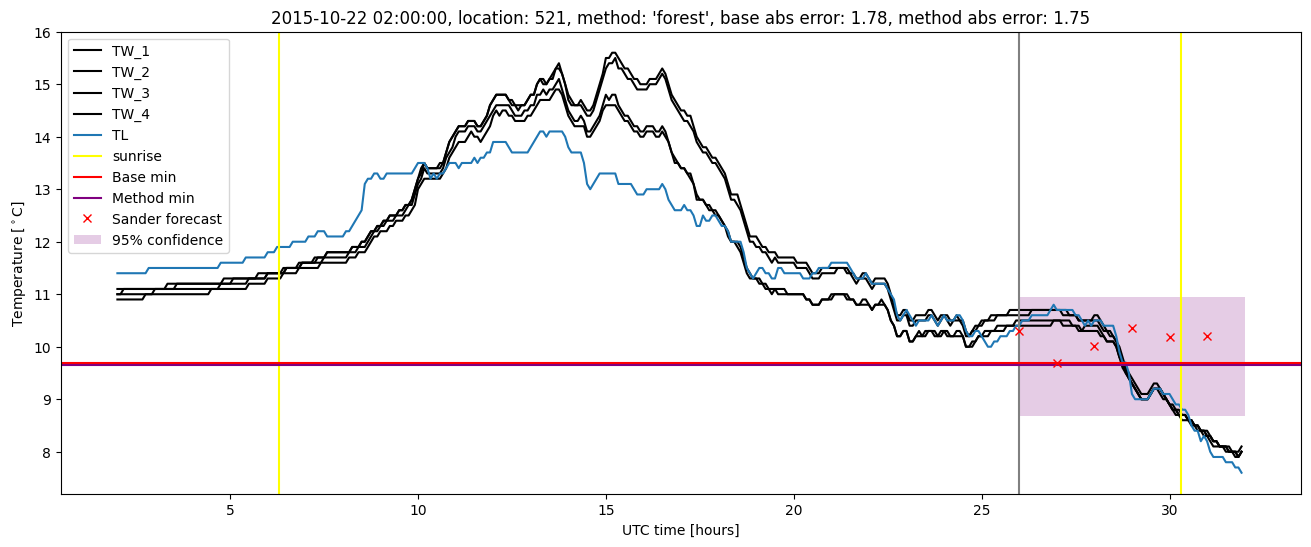
Random forest plots
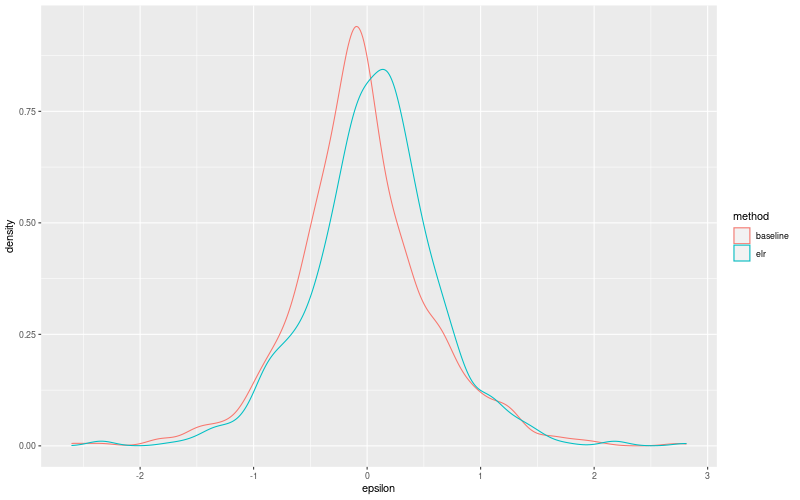
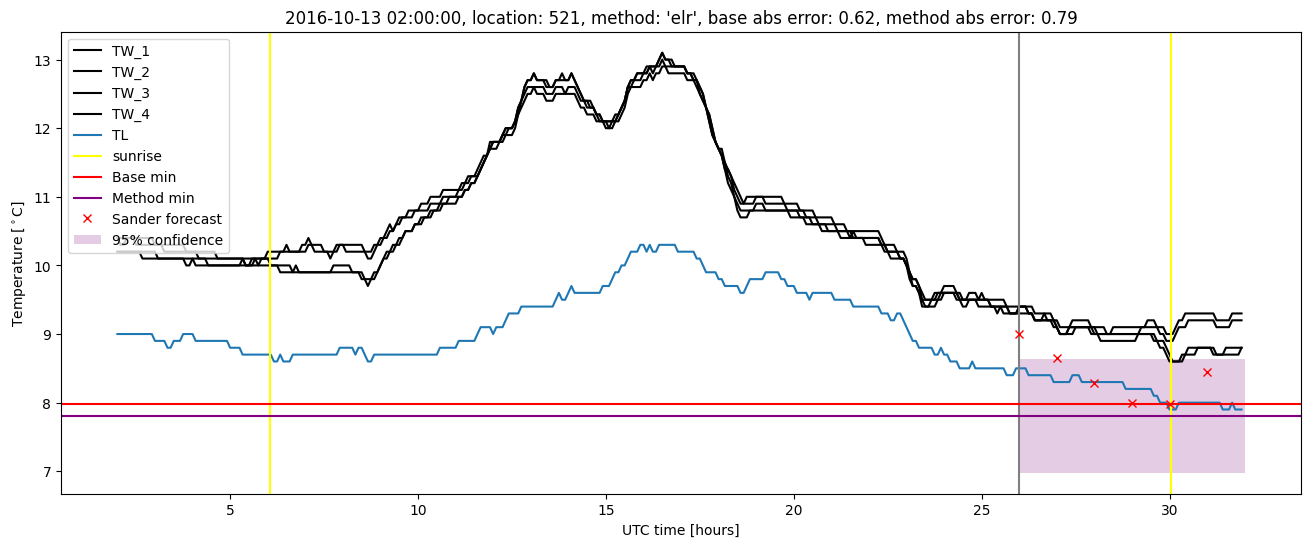
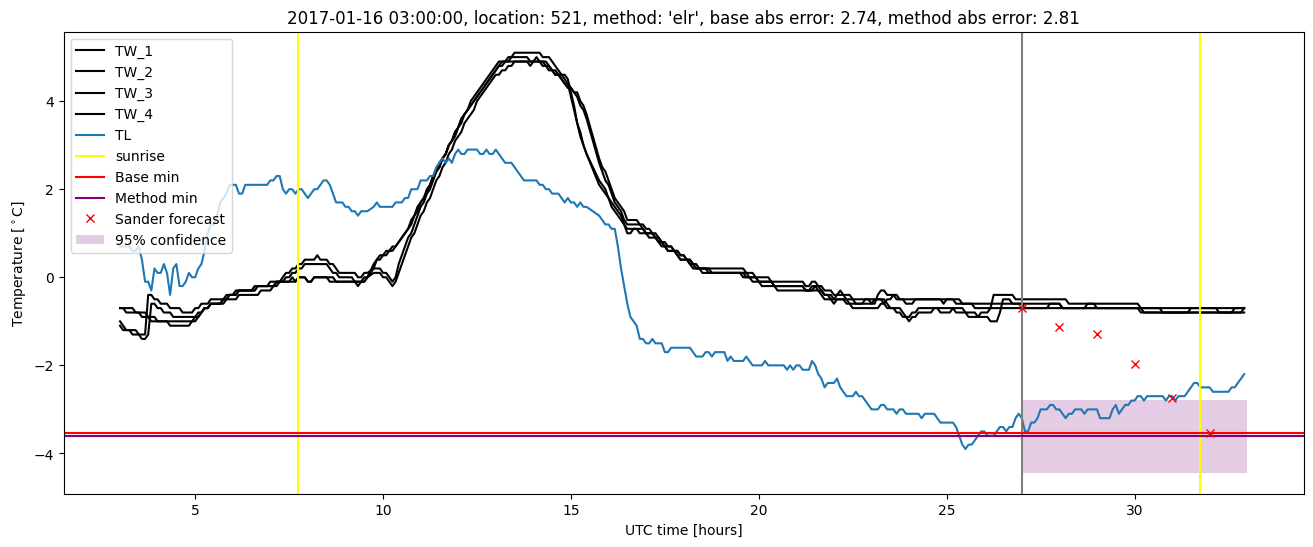
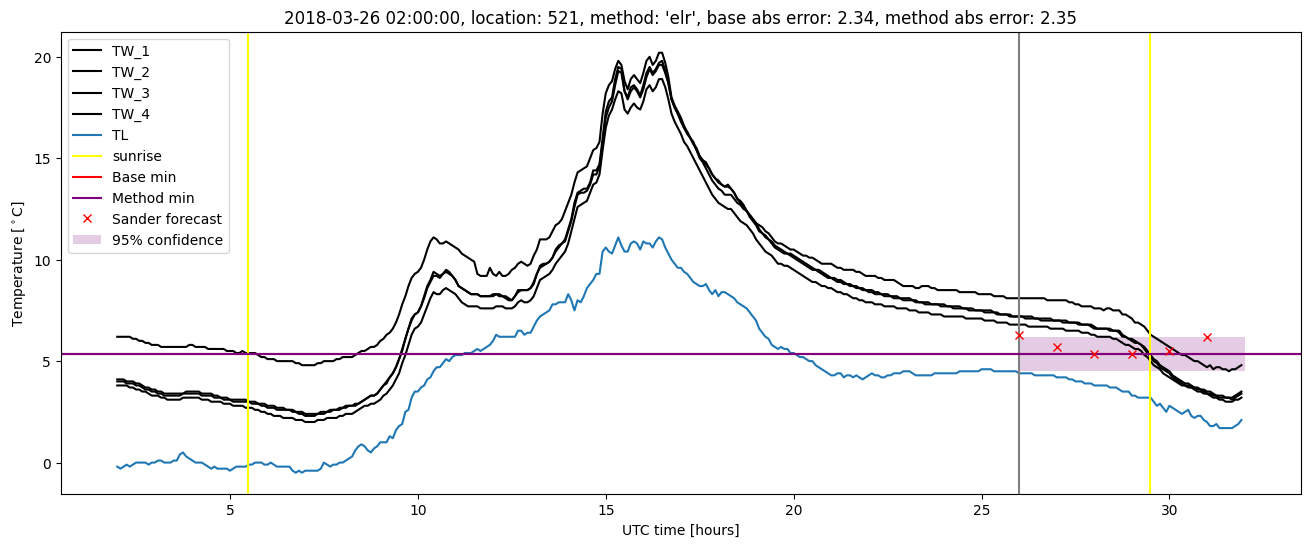
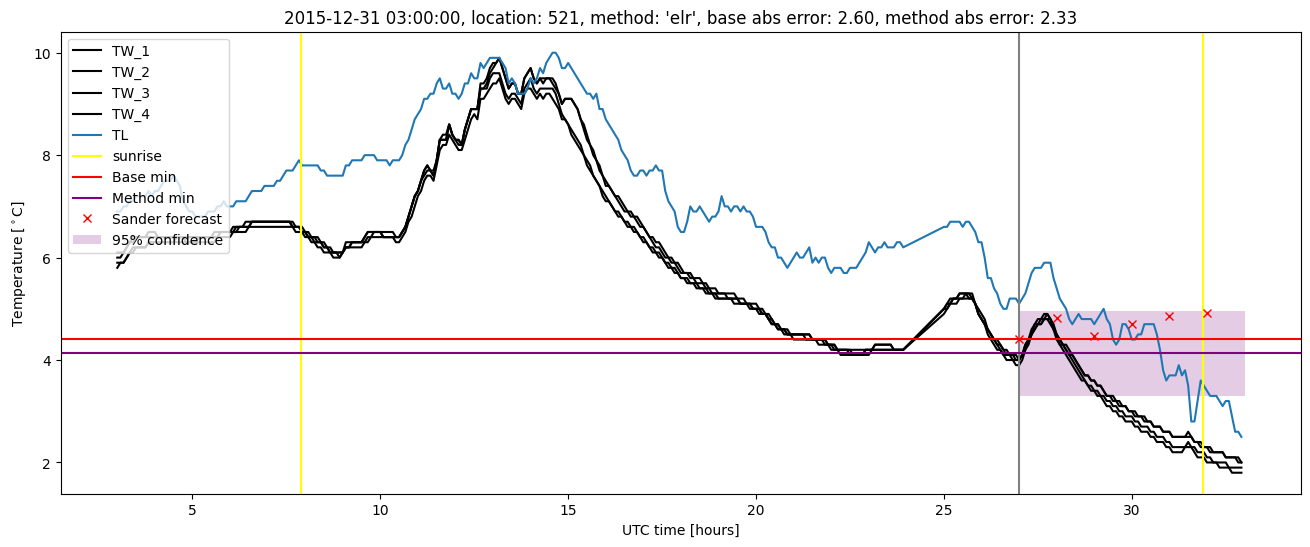
Extended logistic regression results
| names |
period |
power |
significance |
meanSquareError |
absError |
maxError |
CRPS |
IGN |
| baseline |
winter 2016 |
0.982 |
0.048 |
0.391 |
0.473 |
2.601 |
NaN |
NaN |
| elr |
winter 2016 |
0.982 |
0.048 |
0.335 |
0.440 |
2.334 |
0.607 |
6.403 |
| baseline |
winter 2017 |
0.983 |
0.094 |
0.420 |
0.470 |
2.738 |
NaN |
NaN |
| elr |
winter 2017 |
0.983 |
0.062 |
0.410 |
0.450 |
2.810 |
0.581 |
6.119 |
| baseline |
winter 2018 |
0.993 |
0.071 |
0.354 |
0.421 |
2.344 |
NaN |
NaN |
| elr |
winter 2018 |
0.993 |
0.107 |
0.339 |
0.450 |
2.352 |
0.625 |
6.312 |
| baseline |
winter 2019 |
0.993 |
0.000e+00 |
0.264 |
0.388 |
1.626 |
NaN |
NaN |
| elr |
winter 2019 |
0.993 |
0.000e+00 |
0.230 |
0.368 |
1.326 |
0.554 |
4.293 |
| baseline |
all |
0.988 |
0.065 |
0.358 |
0.439 |
2.738 |
NaN |
NaN |
| elr |
all |
0.988 |
0.065 |
0.329 |
0.428 |
2.810 |
0.593 |
5.815 |
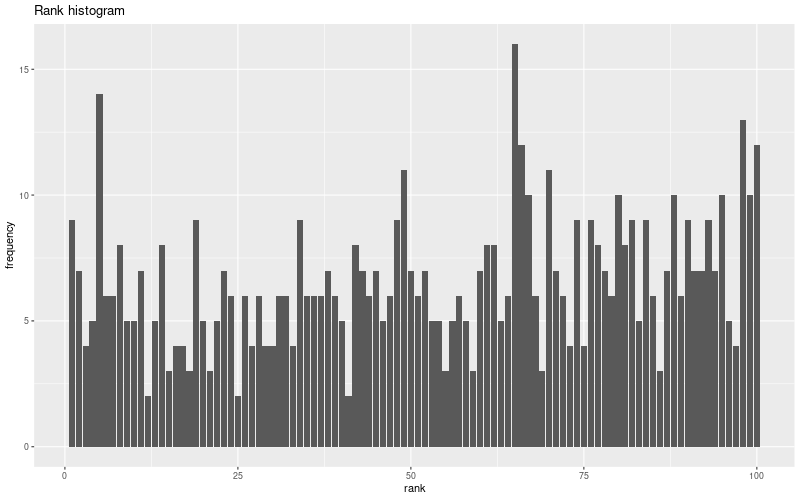
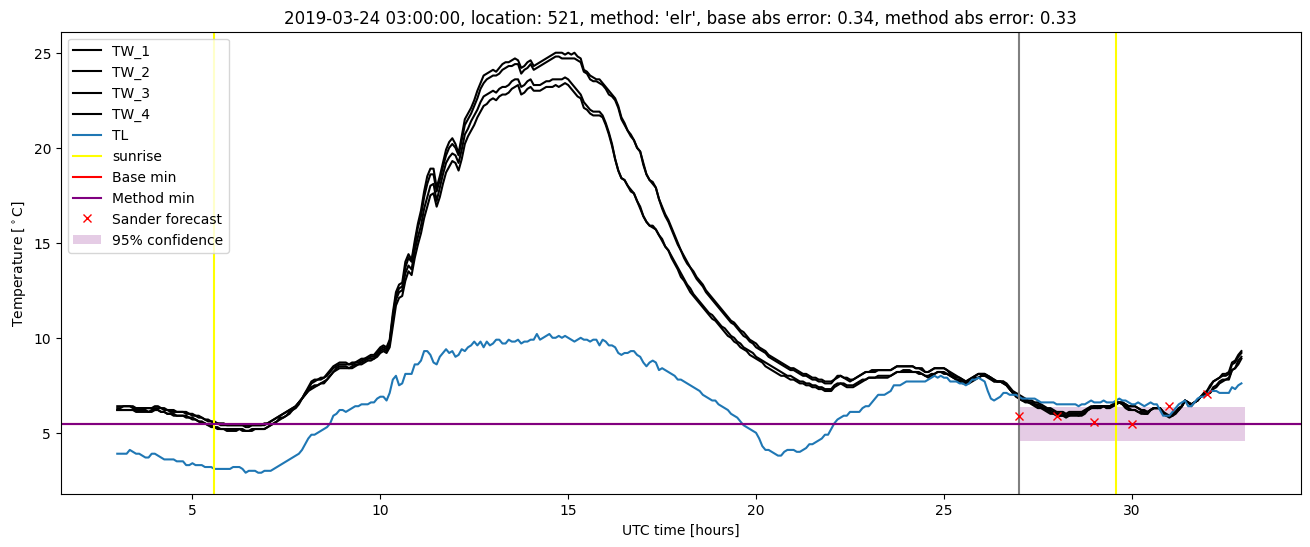
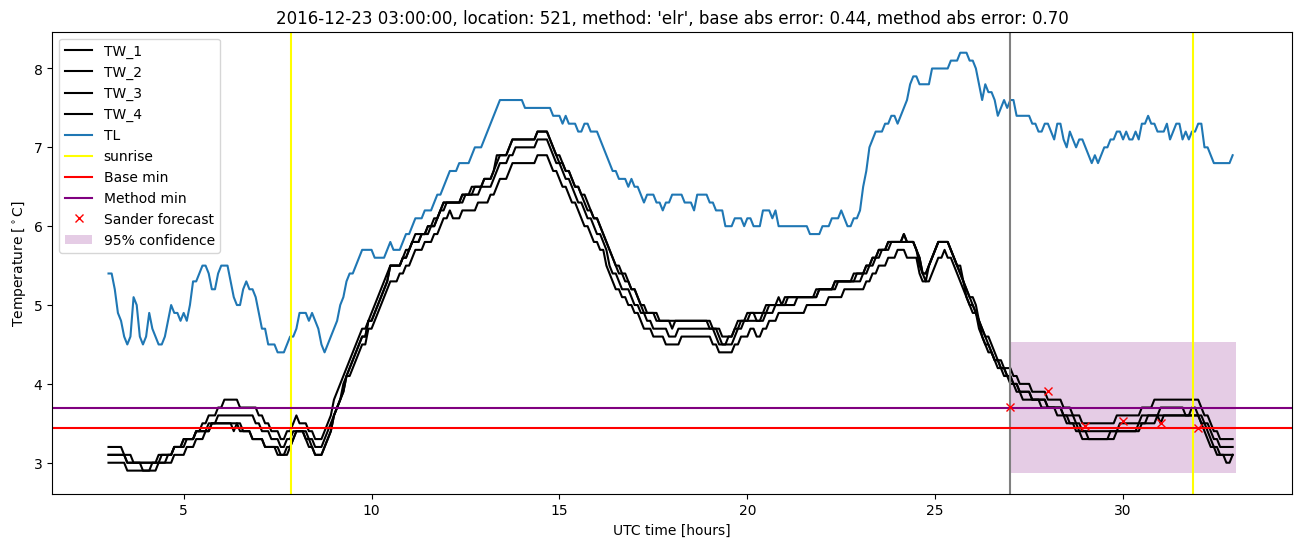
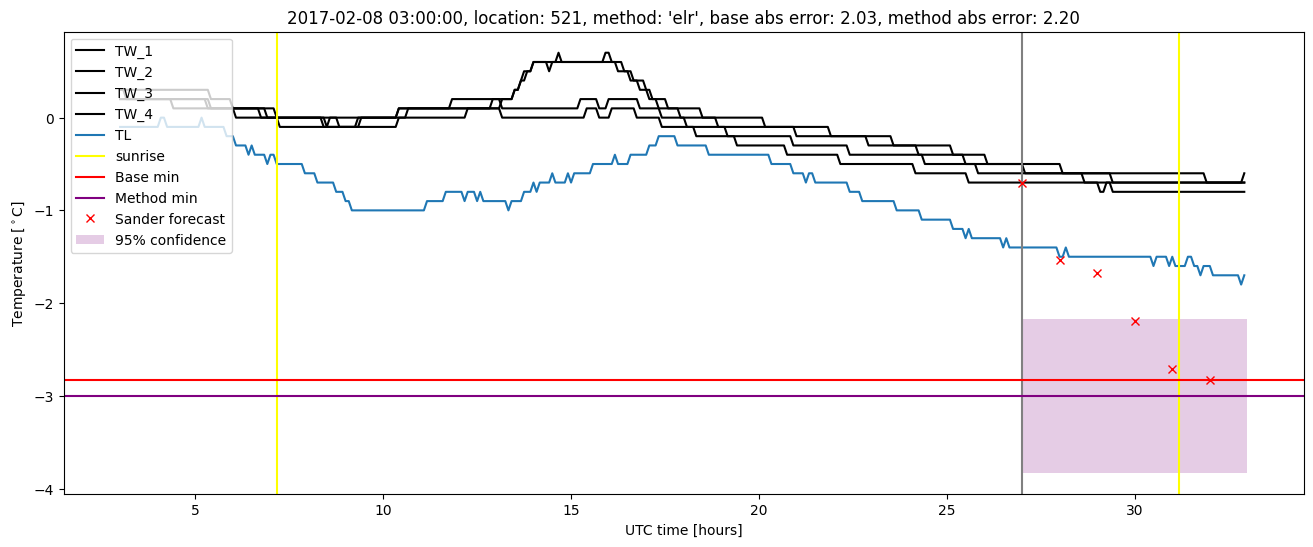
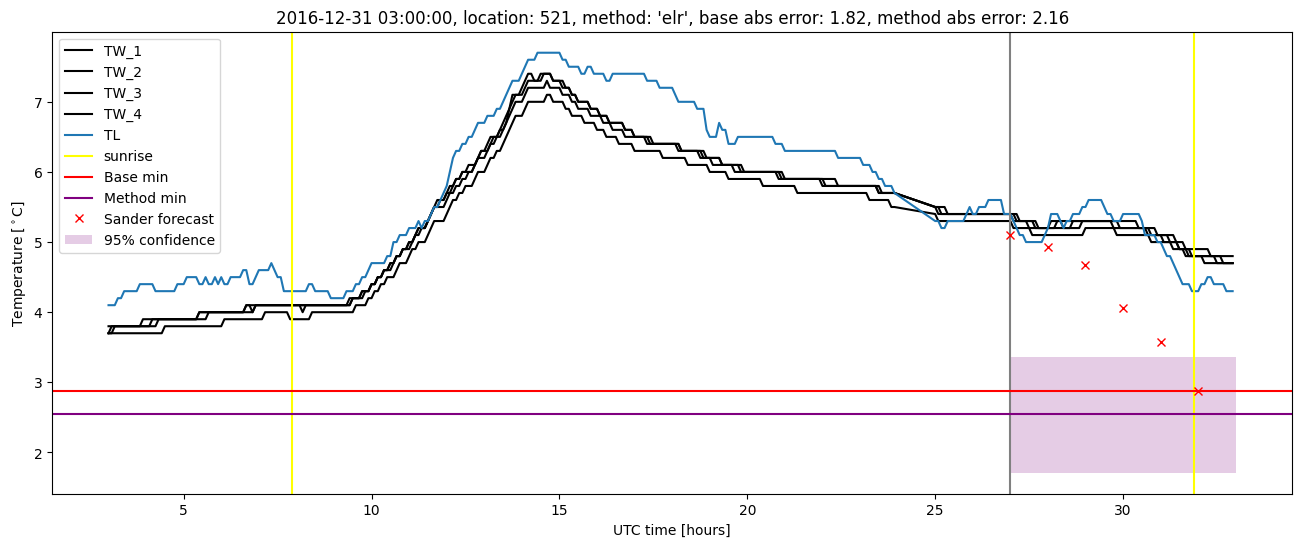
Extended logistic regression plots