GMS location: 520
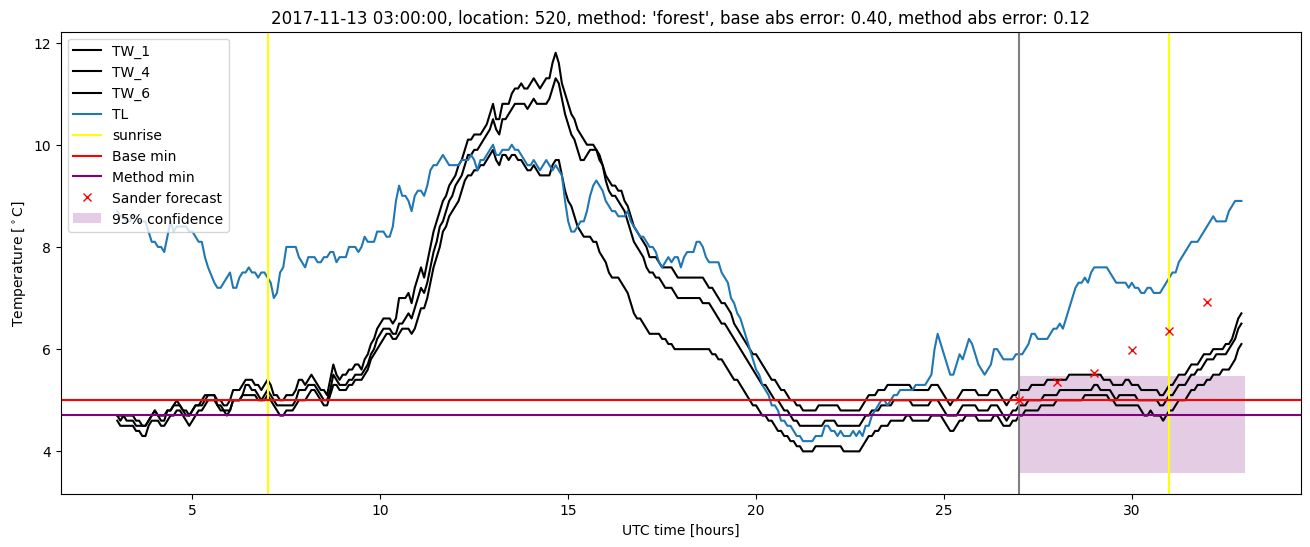
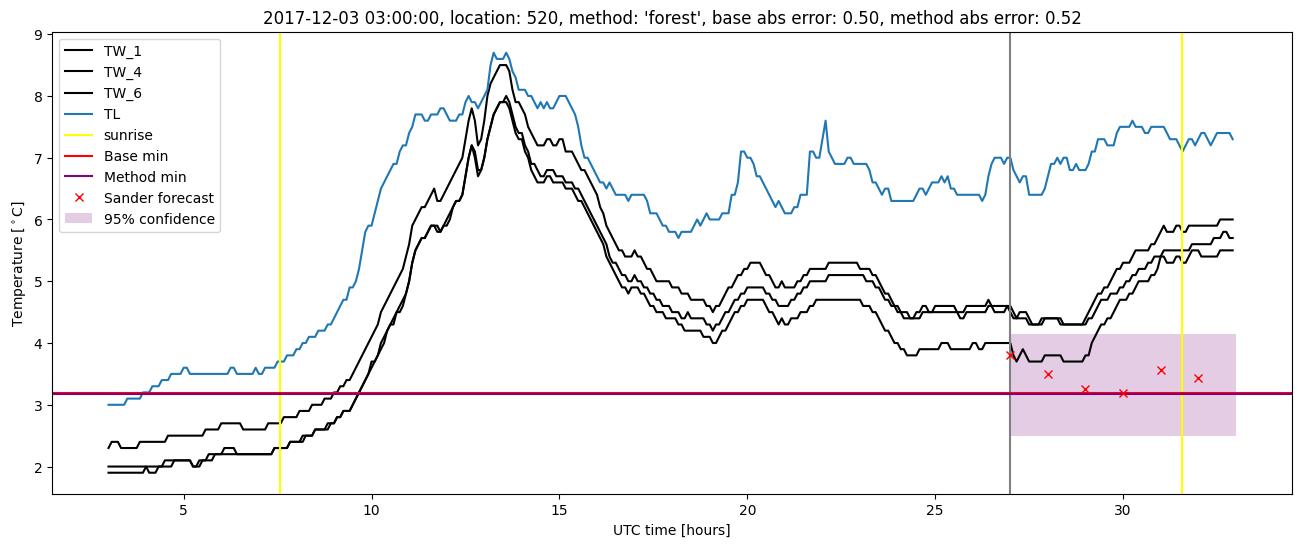
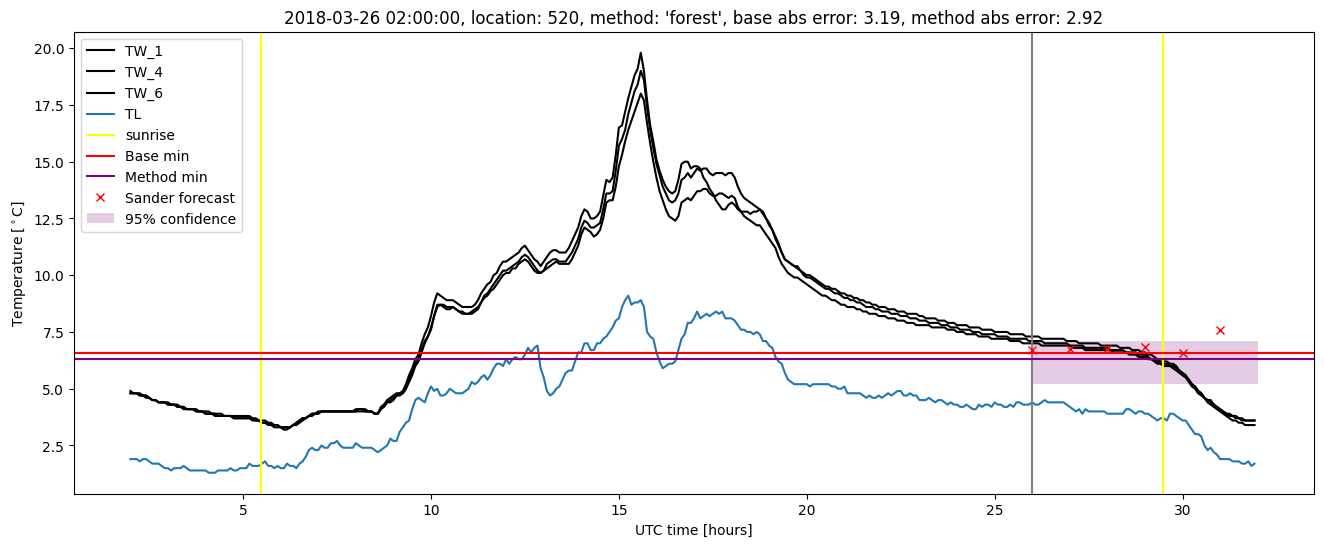
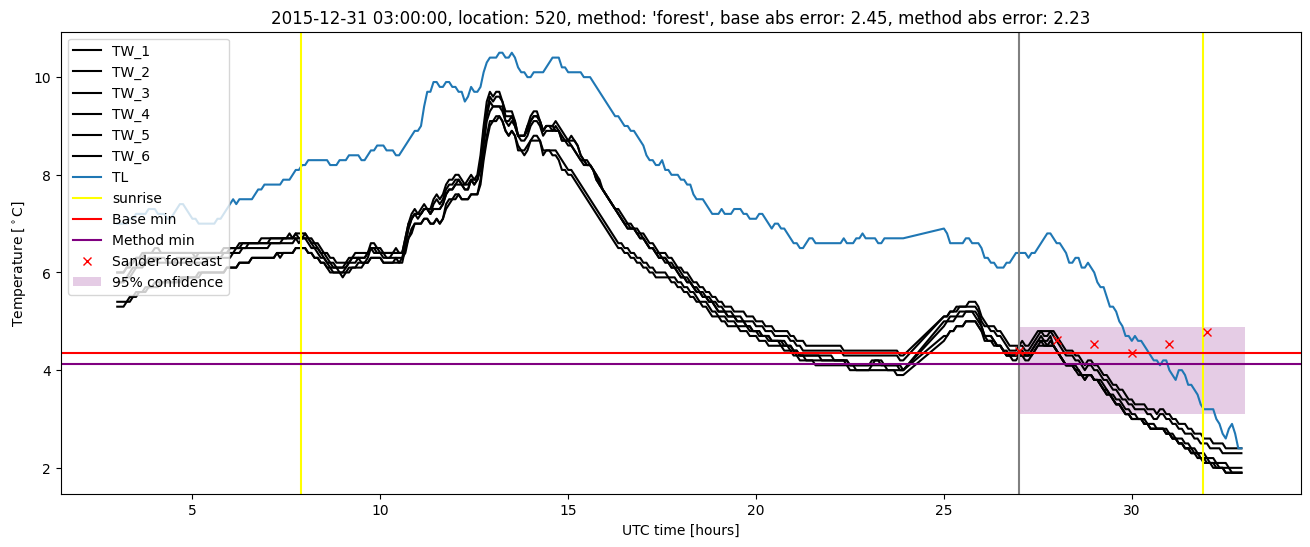
Random forest results
| names |
period |
power |
significance |
meanSquareError |
absError |
maxError |
CRPS |
IGN |
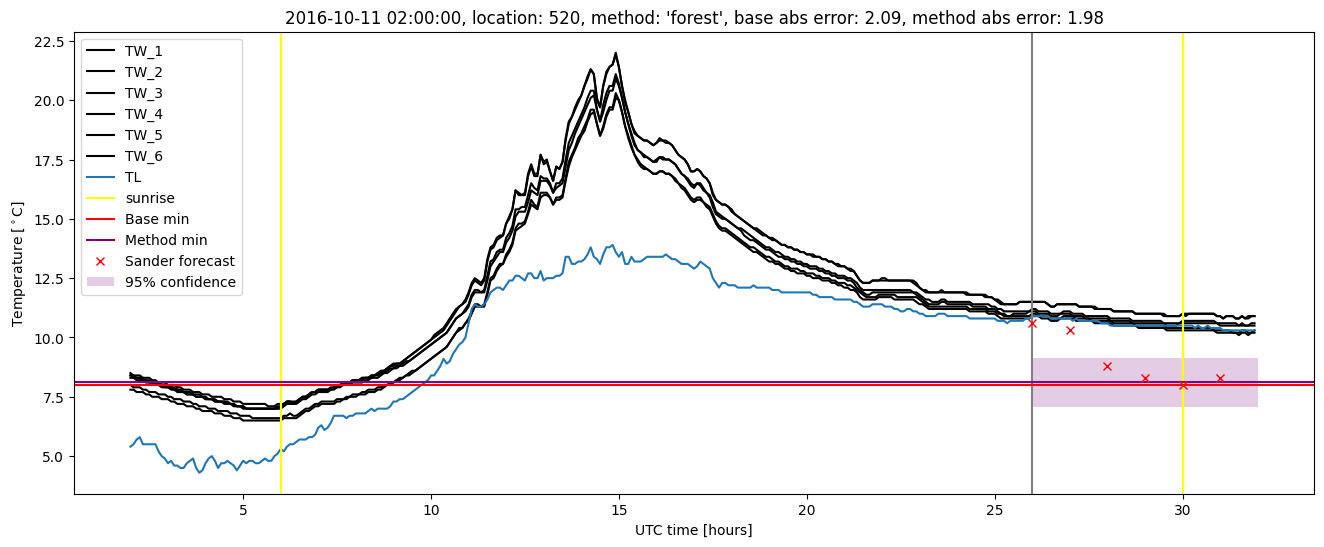
| baseline |
winter 2016 |
0.978 |
0.048 |
0.359 |
0.422 |
2.868 |
NaN |
NaN |
| forest |
winter 2016 |
0.978 |
0.048 |
0.282 |
0.373 |
2.441 |
0.517 |
2.961 |
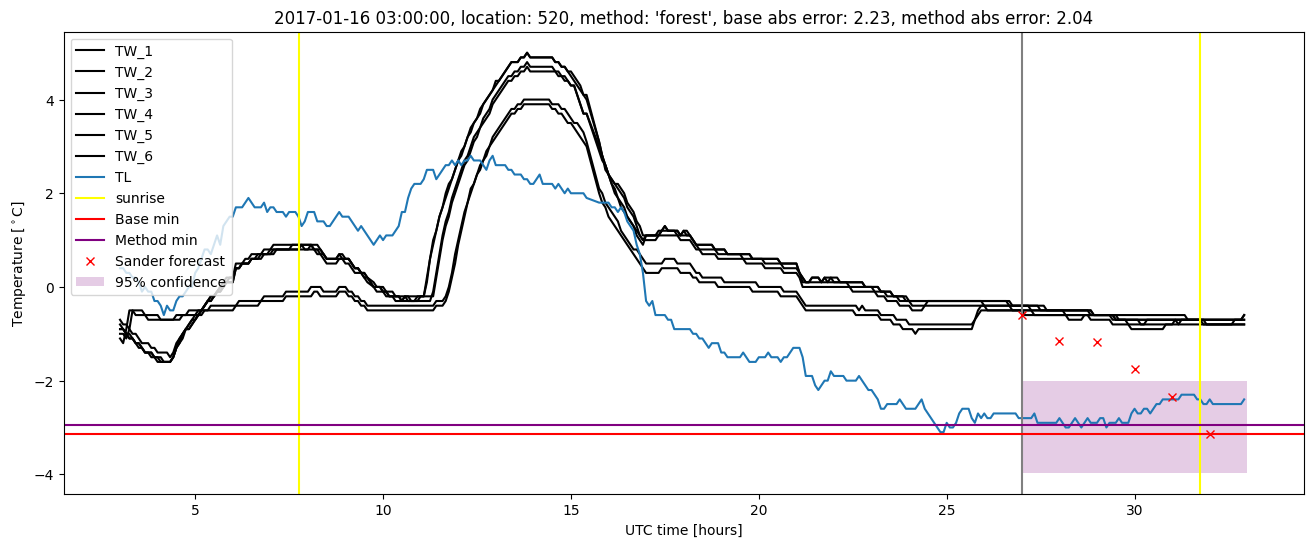
| baseline |
winter 2017 |
0.966 |
0.062 |
0.433 |
0.460 |
2.234 |
NaN |
NaN |
| forest |
winter 2017 |
0.975 |
0.062 |
0.361 |
0.429 |
2.041 |
0.502 |
4.008 |
| baseline |
winter 2018 |
0.990 |
0.091 |
0.439 |
0.482 |
3.187 |
NaN |
NaN |
| forest |
winter 2018 |
0.990 |
0.091 |
0.405 |
0.465 |
2.925 |
0.498 |
2.964 |
| baseline |
winter 2019 |
1.000 |
0.100 |
0.234 |
0.357 |
2.133 |
NaN |
NaN |
| forest |
winter 2019 |
1.000 |
0.100 |
0.199 |
0.322 |
1.844 |
0.528 |
2.819 |
| baseline |
all |
0.983 |
0.073 |
0.367 |
0.430 |
3.187 |
NaN |
NaN |
| forest |
all |
0.985 |
0.073 |
0.309 |
0.395 |
2.925 |
0.512 |
3.185 |
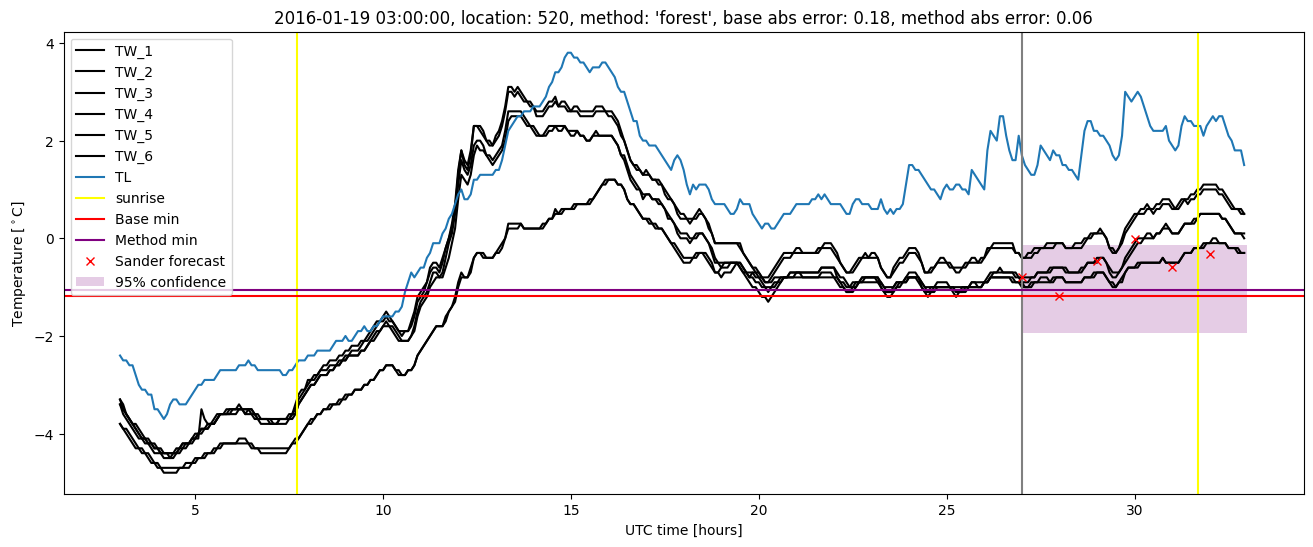
Random forest plots

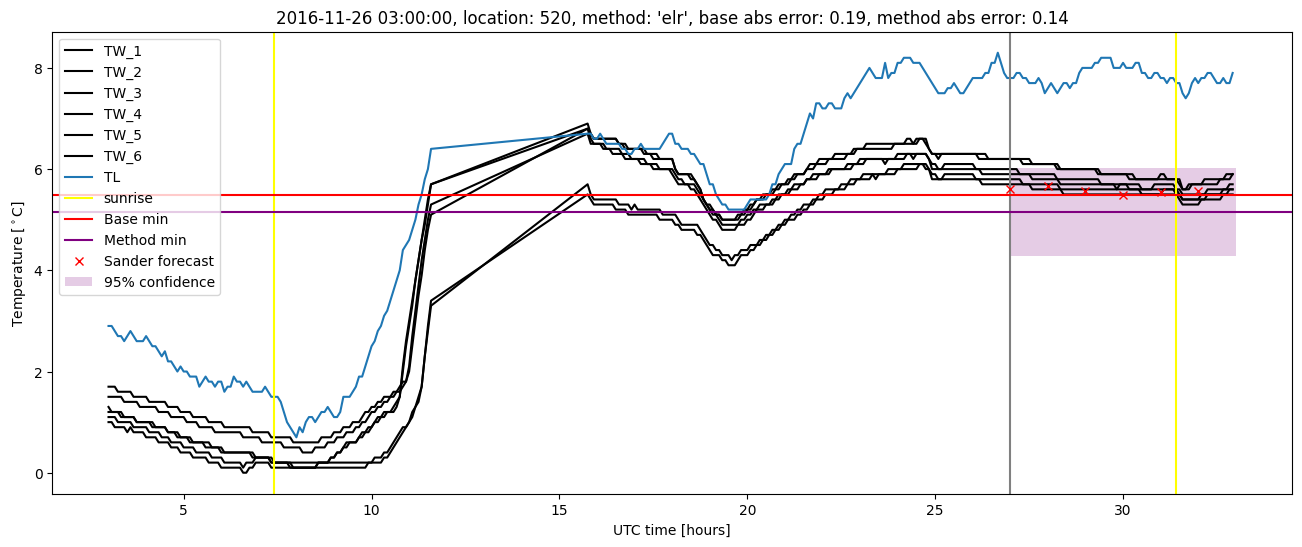
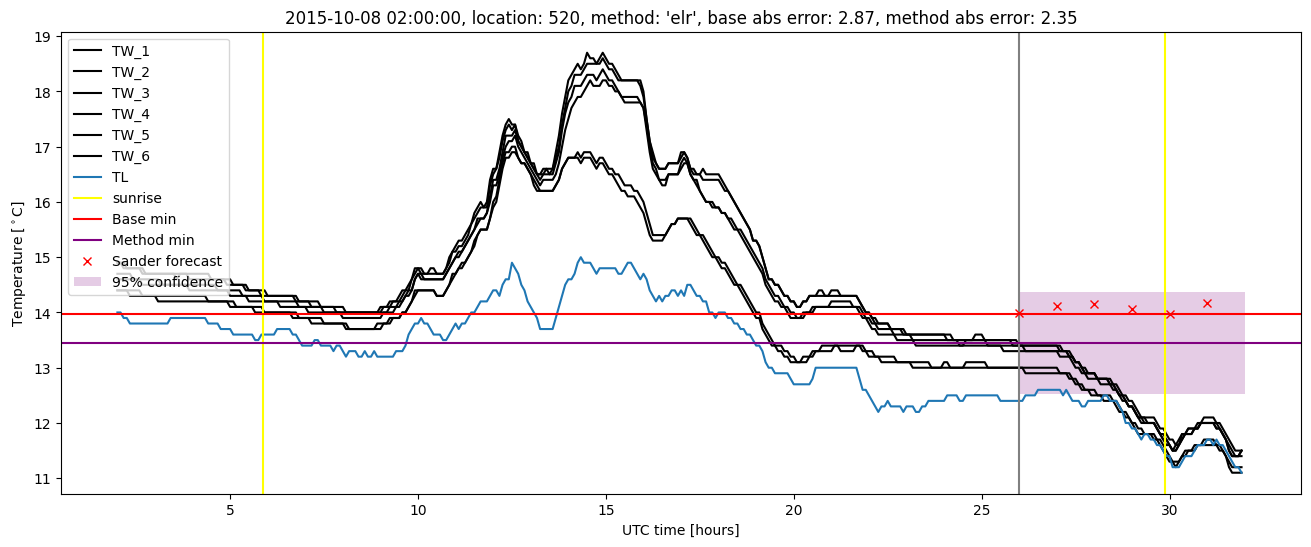
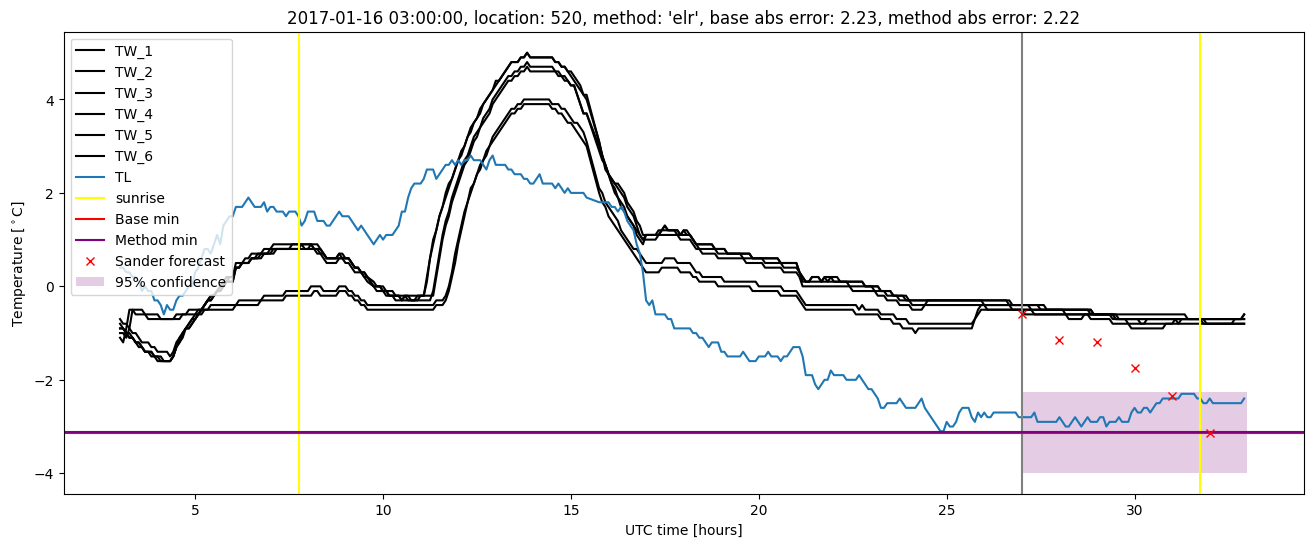
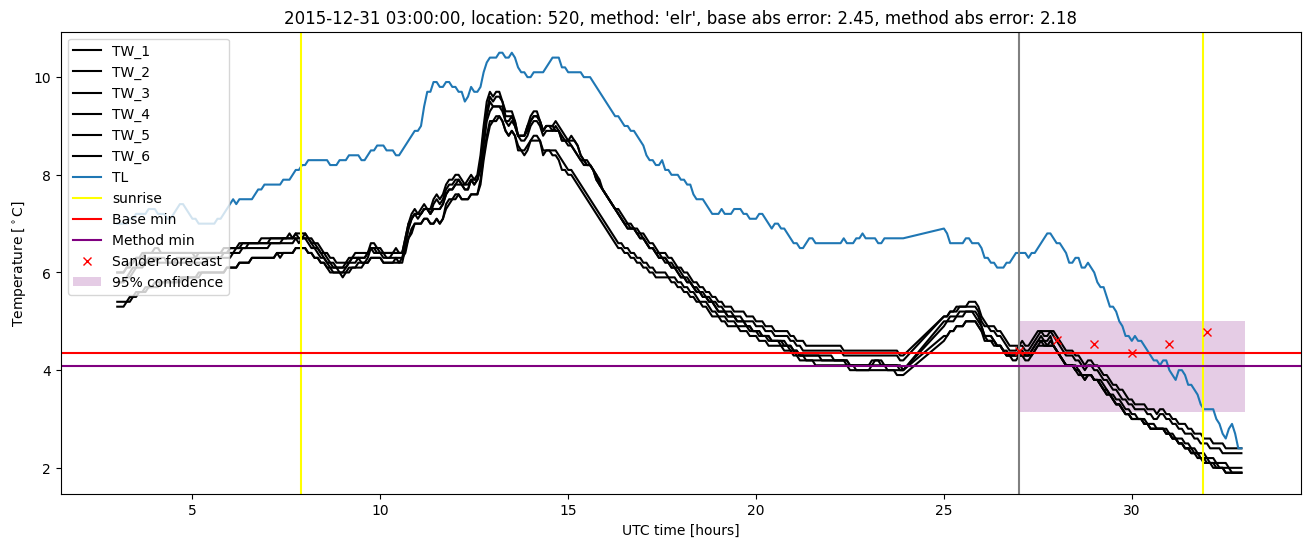
Extended logistic regression results
| names |
period |
power |
significance |
meanSquareError |
absError |
maxError |
CRPS |
IGN |
| baseline |
winter 2016 |
0.978 |
0.048 |
0.359 |
0.422 |
2.868 |
NaN |
NaN |
| elr |
winter 2016 |
0.978 |
0.048 |
0.318 |
0.412 |
2.353 |
0.589 |
4.129 |
| baseline |
winter 2017 |
0.966 |
0.062 |
0.433 |
0.460 |
2.234 |
NaN |
NaN |
| elr |
winter 2017 |
0.975 |
0.062 |
0.411 |
0.462 |
2.223 |
0.552 |
4.777 |
| baseline |
winter 2018 |
0.990 |
0.091 |
0.439 |
0.482 |
3.187 |
NaN |
NaN |
| elr |
winter 2018 |
0.990 |
0.061 |
0.389 |
0.448 |
3.068 |
0.568 |
5.098 |
| baseline |
winter 2019 |
1.000 |
0.100 |
0.234 |
0.357 |
2.133 |
NaN |
NaN |
| elr |
winter 2019 |
1.000 |
0.100 |
0.233 |
0.368 |
1.790 |
0.555 |
3.521 |
| baseline |
all |
0.983 |
0.073 |
0.367 |
0.430 |
3.187 |
NaN |
NaN |
| elr |
all |
0.985 |
0.062 |
0.337 |
0.422 |
3.068 |
0.568 |
4.362 |
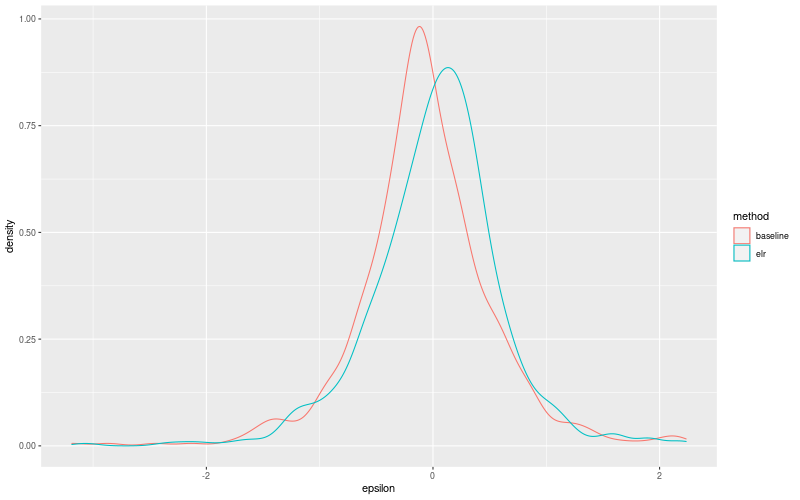
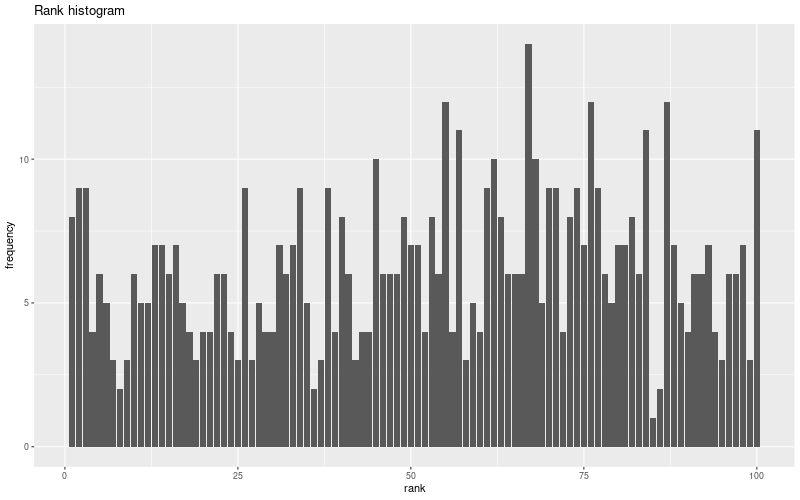
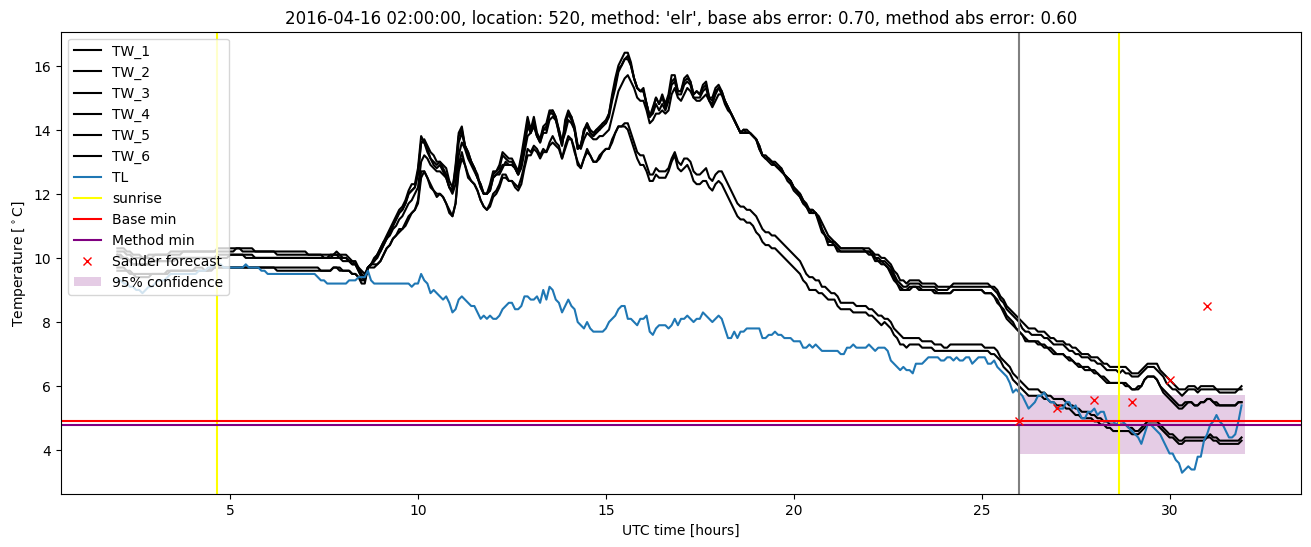
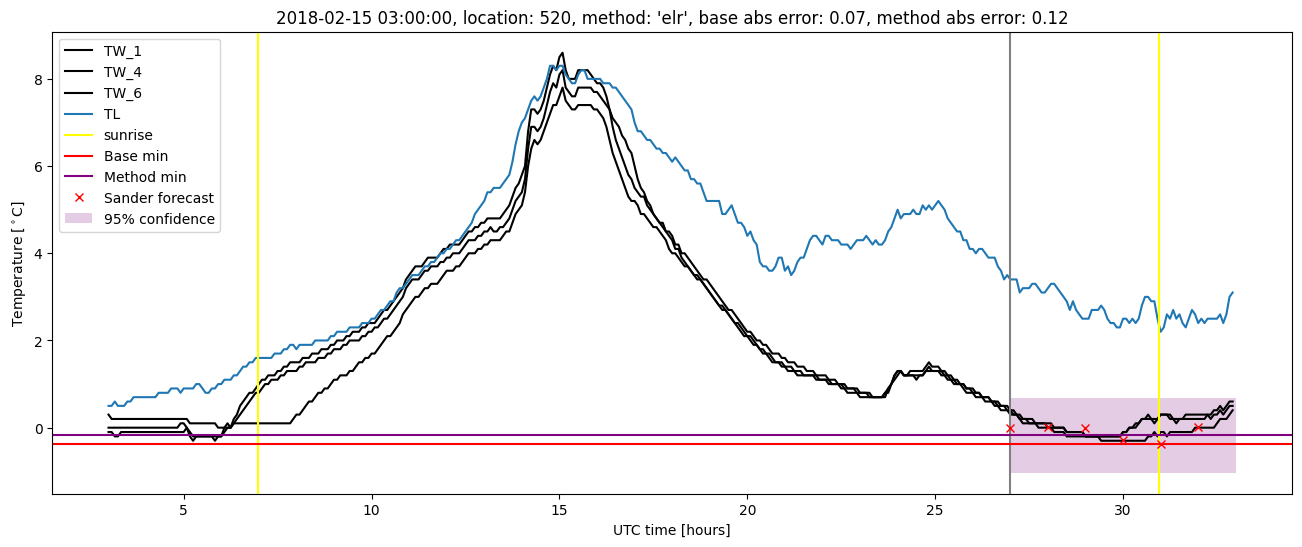
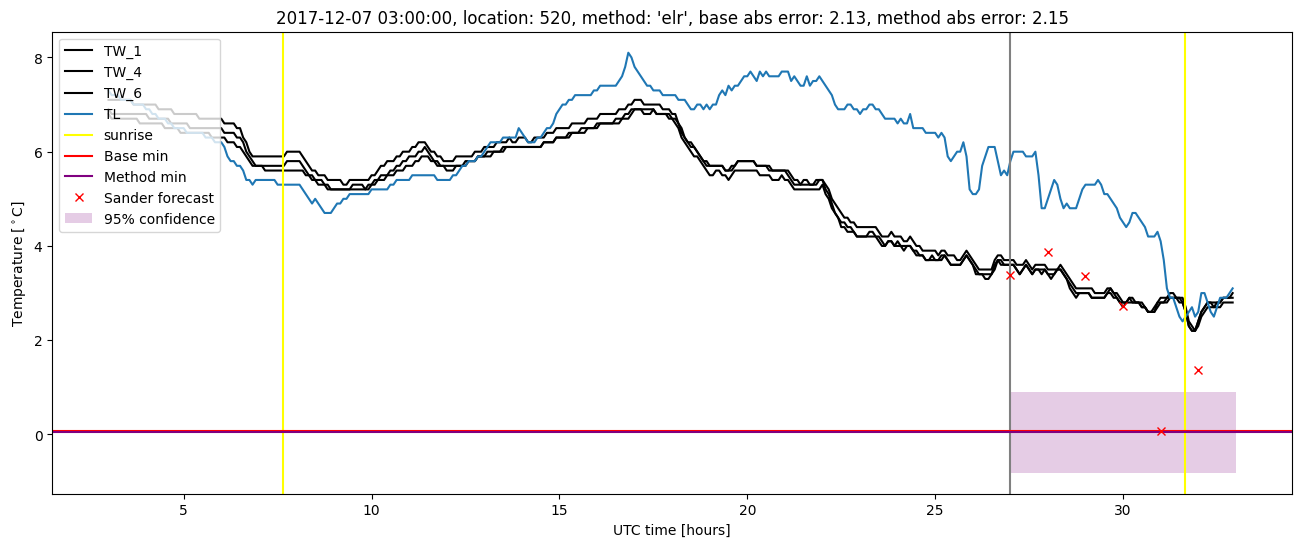
Extended logistic regression plots