GMS location: 518
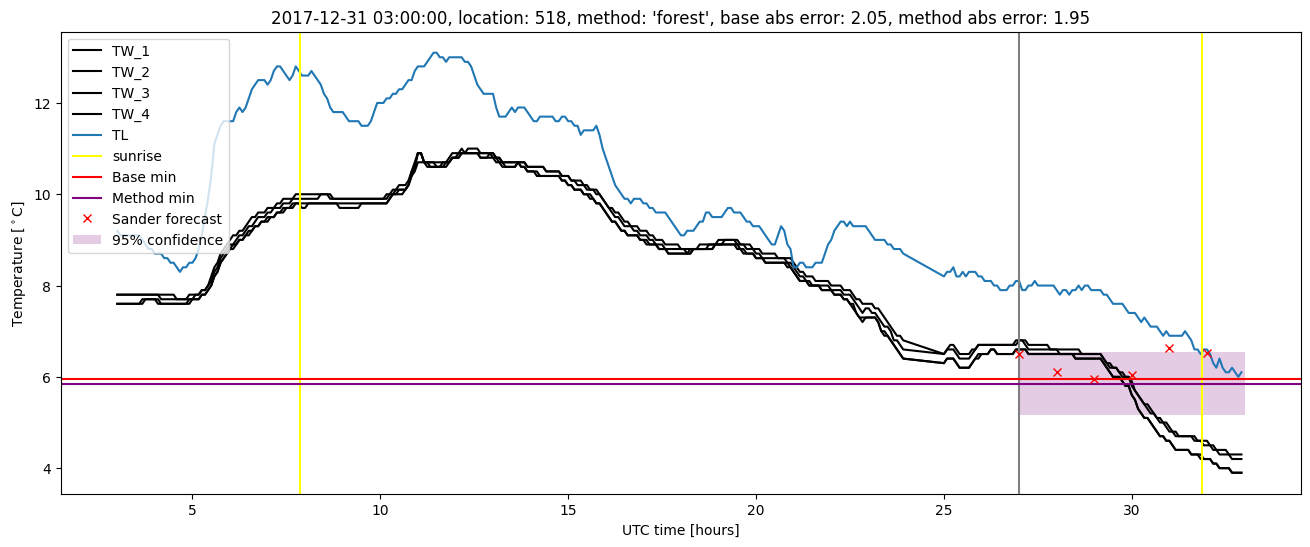
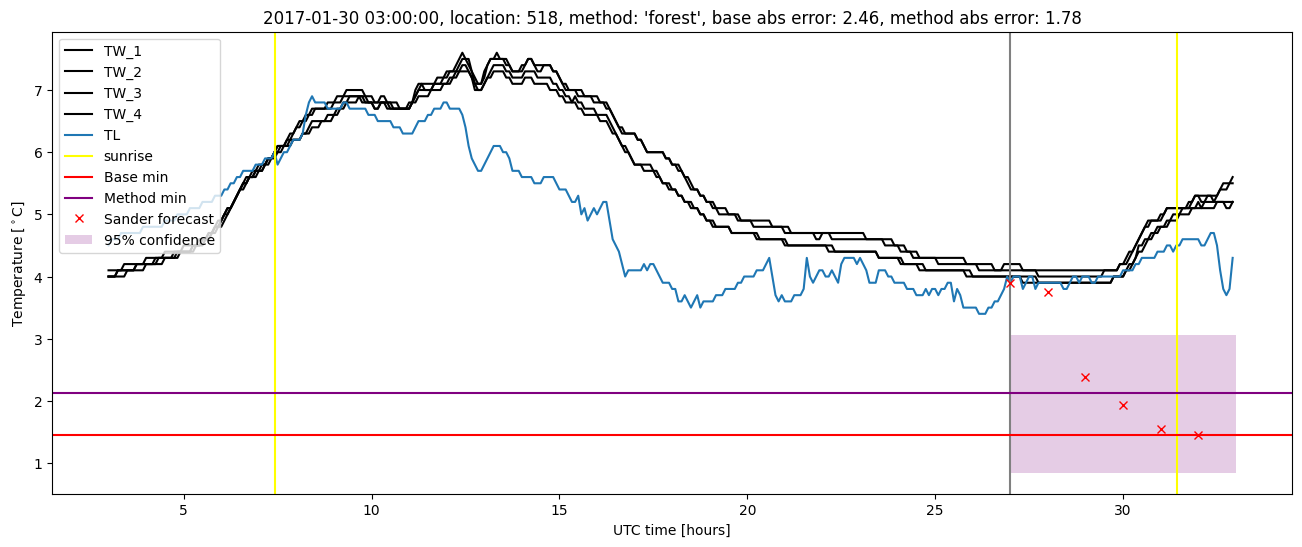
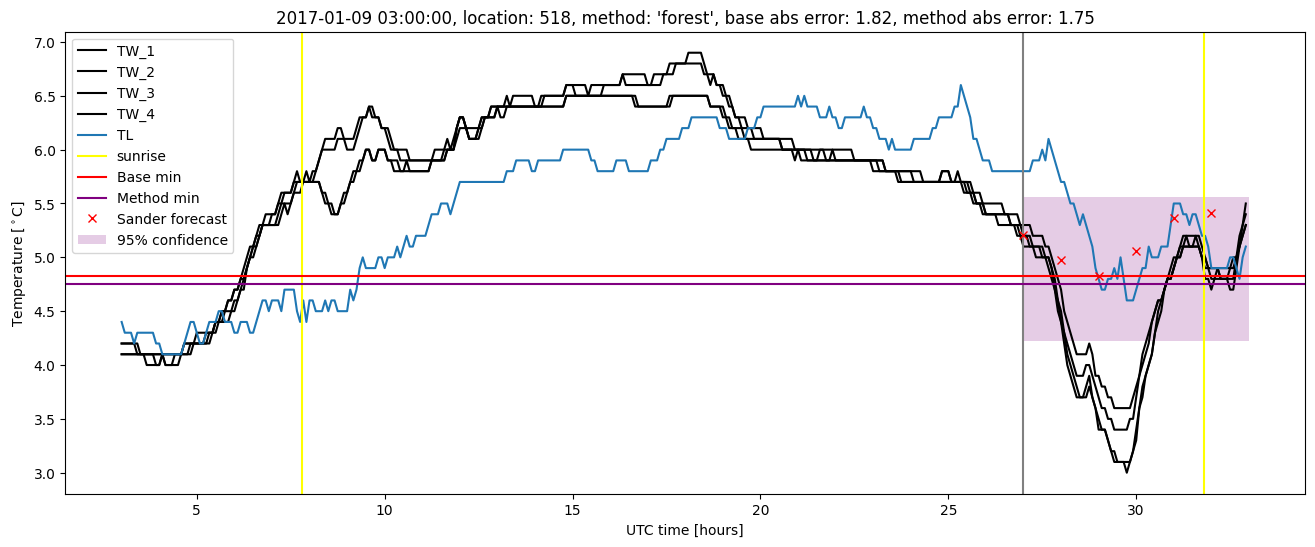
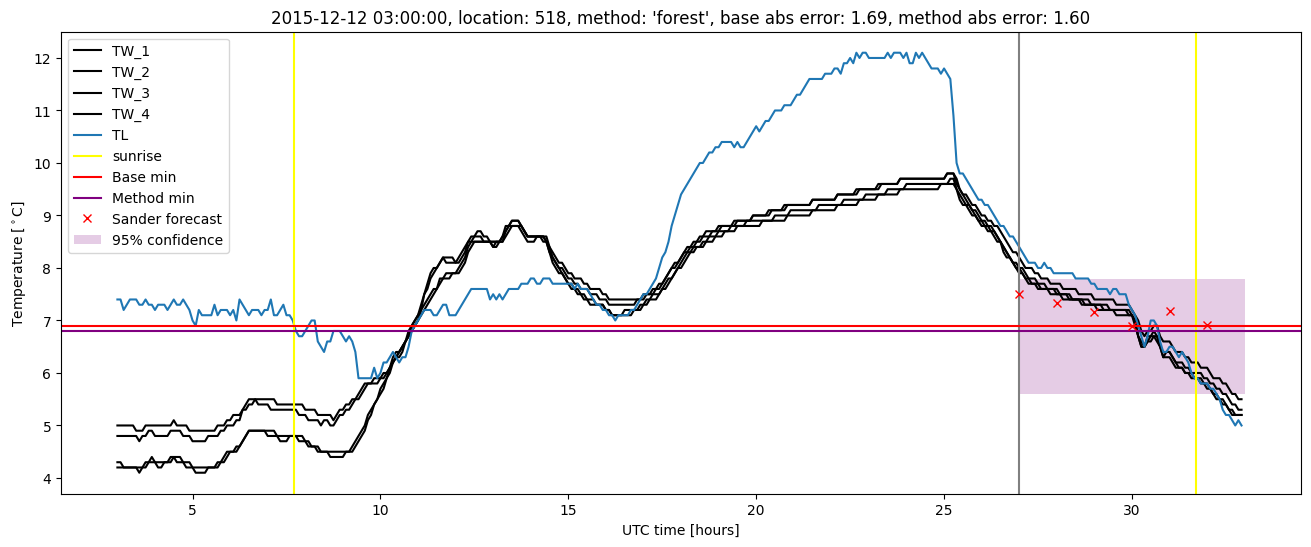
Random forest results
| names |
period |
power |
significance |
meanSquareError |
absError |
maxError |
CRPS |
IGN |
| baseline |
winter 2016 |
0.973 |
0.000e+00 |
0.384 |
0.471 |
1.939 |
NaN |
NaN |
| forest |
winter 2016 |
1.000 |
0.000e+00 |
0.264 |
0.389 |
2.046 |
0.431 |
3.010 |
| baseline |
winter 2017 |
0.977 |
0.040 |
0.499 |
0.518 |
2.457 |
NaN |
NaN |
| forest |
winter 2017 |
0.984 |
0.040 |
0.296 |
0.388 |
1.776 |
0.436 |
3.235 |
| baseline |
winter 2018 |
0.981 |
0.045 |
0.295 |
0.416 |
2.054 |
NaN |
NaN |
| forest |
winter 2018 |
0.994 |
0.045 |
0.226 |
0.352 |
1.946 |
0.443 |
2.445 |
| baseline |
winter 2019 |
0.974 |
0.111 |
0.329 |
0.418 |
1.990 |
NaN |
NaN |
| forest |
winter 2019 |
0.980 |
0.111 |
0.249 |
0.374 |
1.595 |
0.443 |
2.564 |
| baseline |
all |
0.976 |
0.043 |
0.373 |
0.455 |
2.457 |
NaN |
NaN |
| forest |
all |
0.990 |
0.043 |
0.258 |
0.376 |
2.046 |
0.438 |
2.810 |
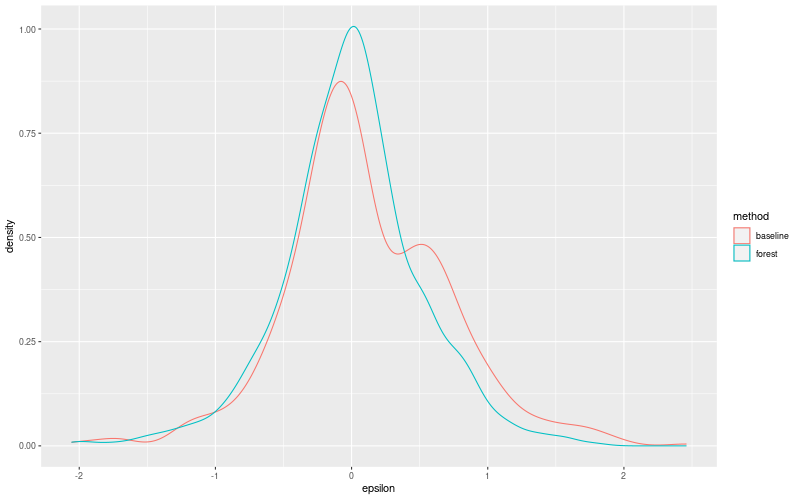
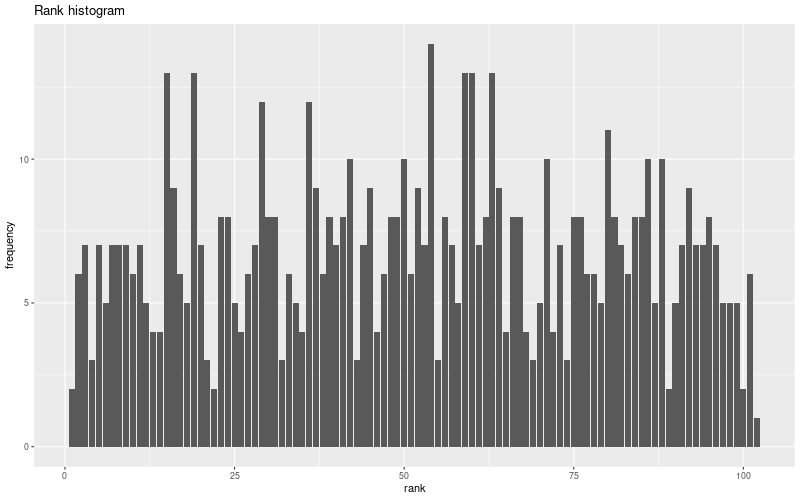
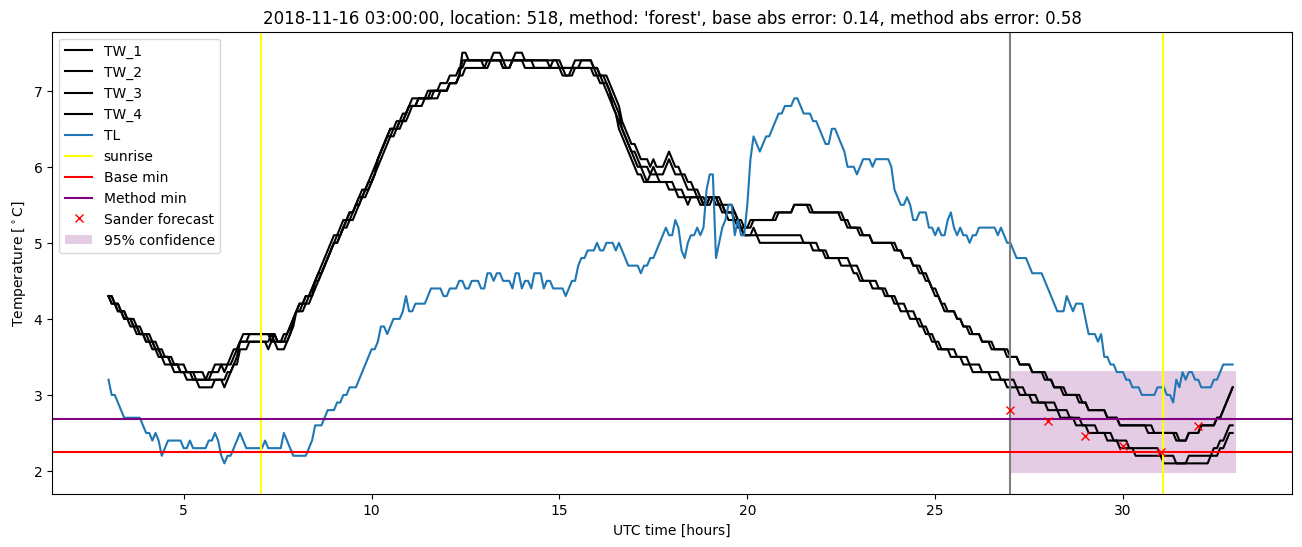
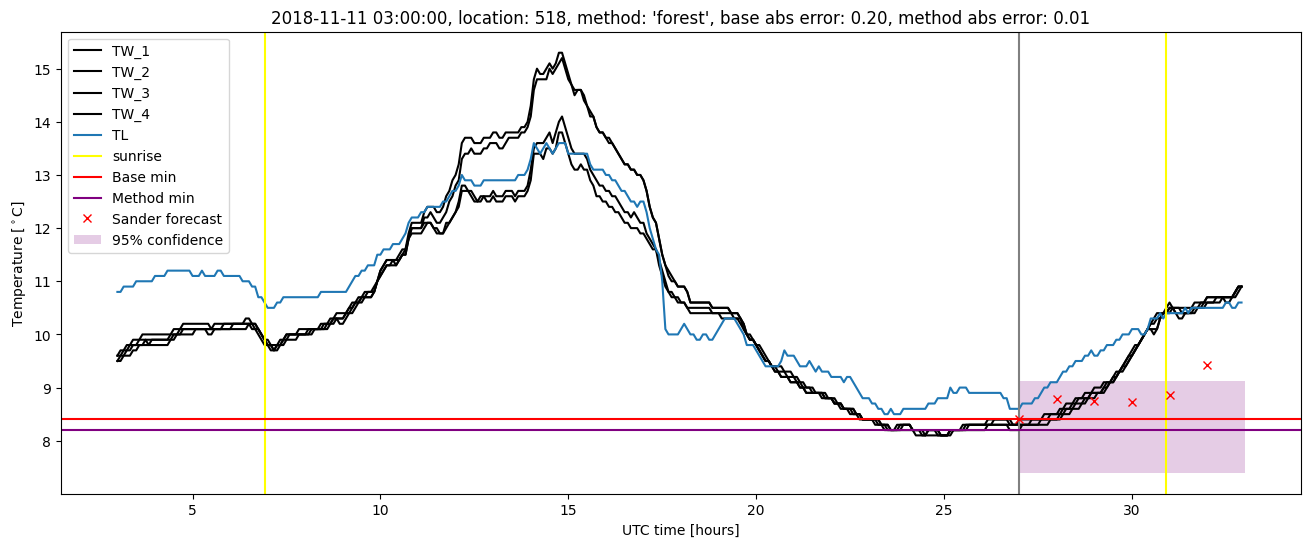
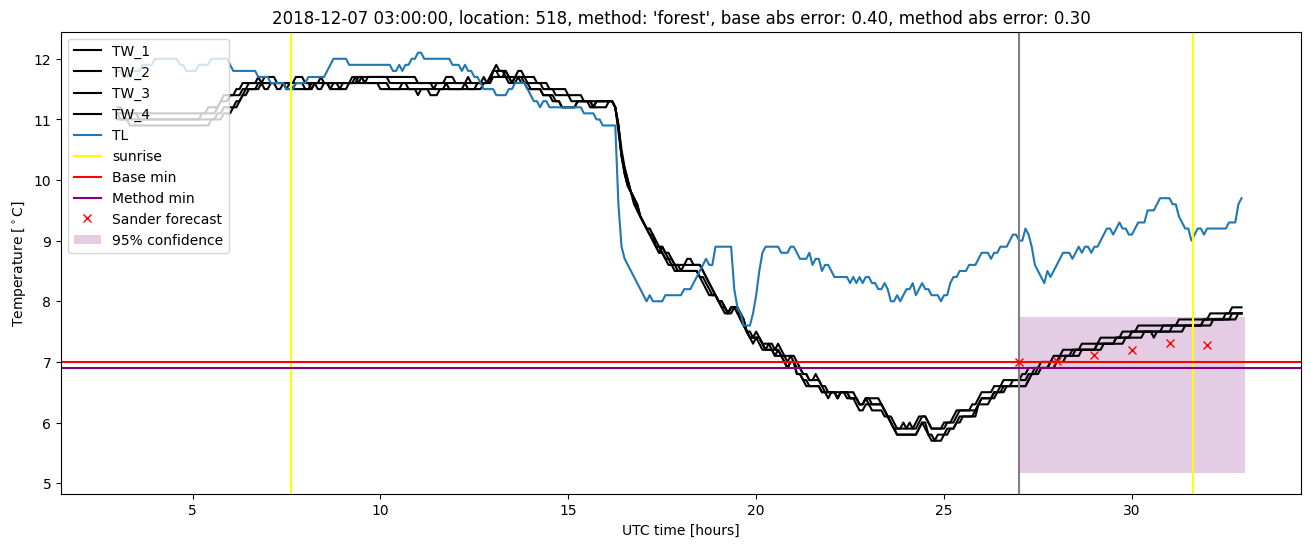
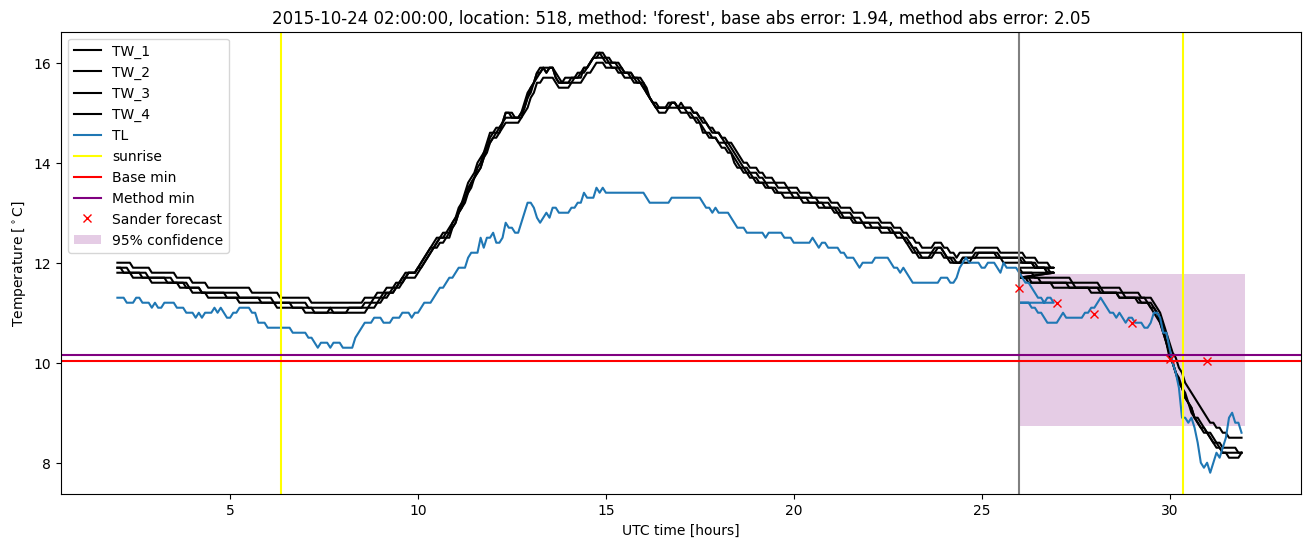
Random forest plots
Extended logistic regression results
| names |
period |
power |
significance |
meanSquareError |
absError |
maxError |
CRPS |
IGN |
| baseline |
winter 2016 |
0.973 |
0.000e+00 |
0.384 |
0.471 |
1.939 |
NaN |
NaN |
| elr |
winter 2016 |
0.984 |
0.000e+00 |
0.303 |
0.433 |
2.164 |
0.483 |
4.128 |
| baseline |
winter 2017 |
0.977 |
0.040 |
0.499 |
0.518 |
2.457 |
NaN |
NaN |
| elr |
winter 2017 |
0.977 |
0.040 |
0.393 |
0.456 |
2.054 |
0.515 |
5.331 |
| baseline |
winter 2018 |
0.981 |
0.045 |
0.295 |
0.416 |
2.054 |
NaN |
NaN |
| elr |
winter 2018 |
0.987 |
0.045 |
0.268 |
0.394 |
2.242 |
0.507 |
4.095 |
| baseline |
winter 2019 |
0.974 |
0.111 |
0.329 |
0.418 |
1.990 |
NaN |
NaN |
| elr |
winter 2019 |
0.987 |
0.222 |
0.270 |
0.402 |
1.502 |
0.497 |
4.266 |
| baseline |
all |
0.976 |
0.043 |
0.373 |
0.455 |
2.457 |
NaN |
NaN |
| elr |
all |
0.984 |
0.057 |
0.306 |
0.421 |
2.242 |
0.500 |
4.417 |
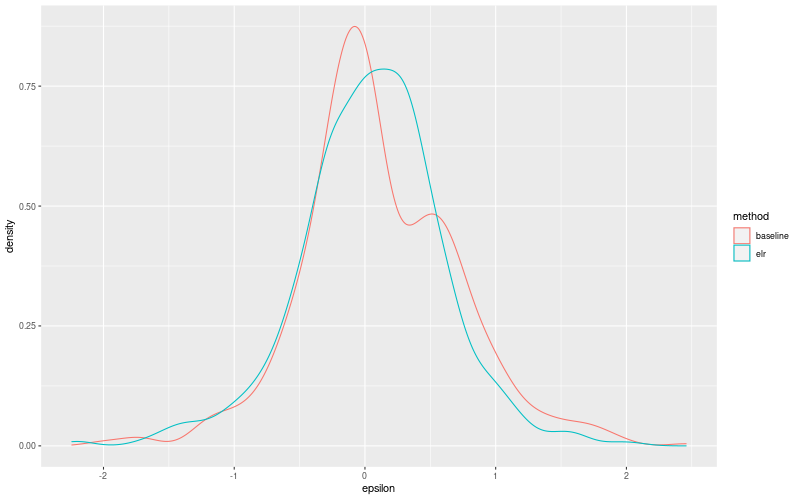
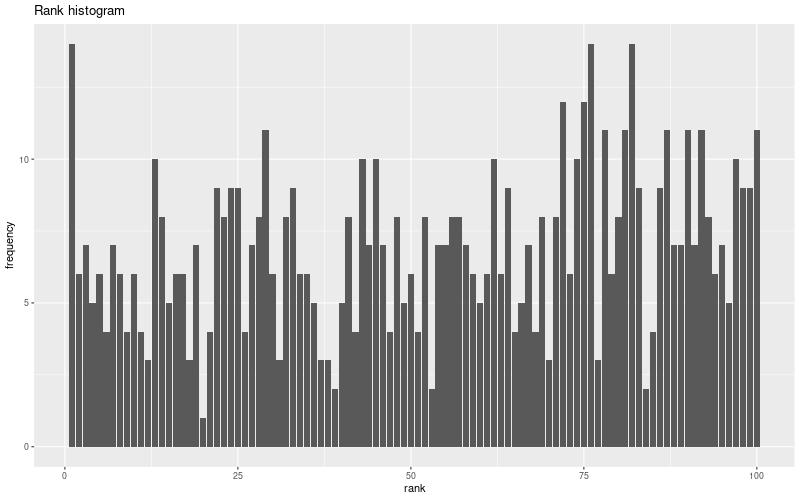
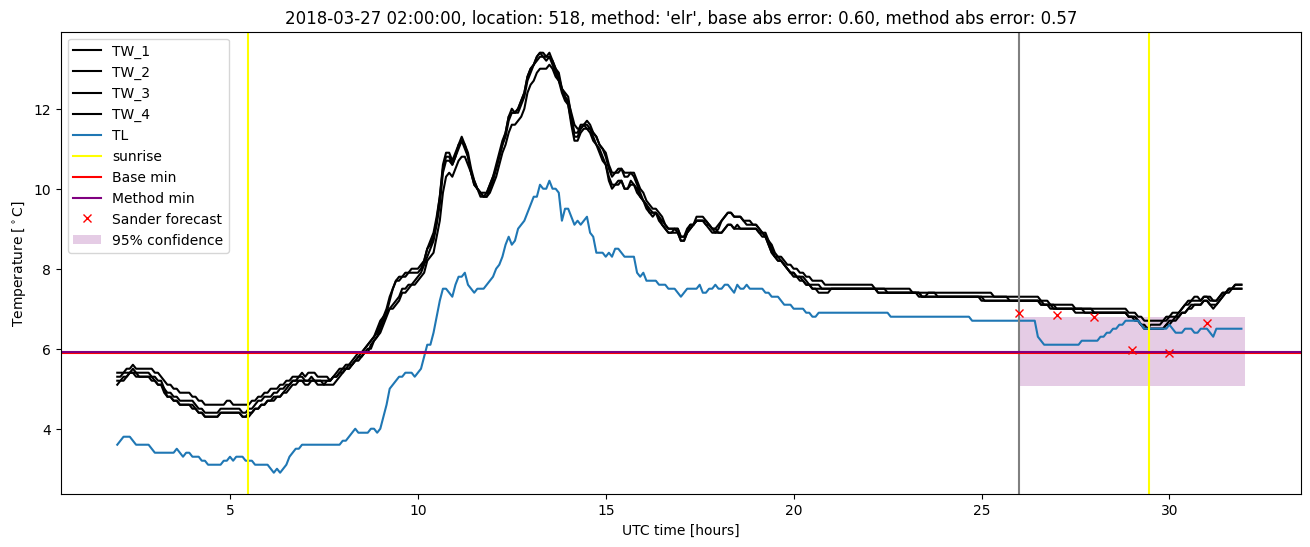
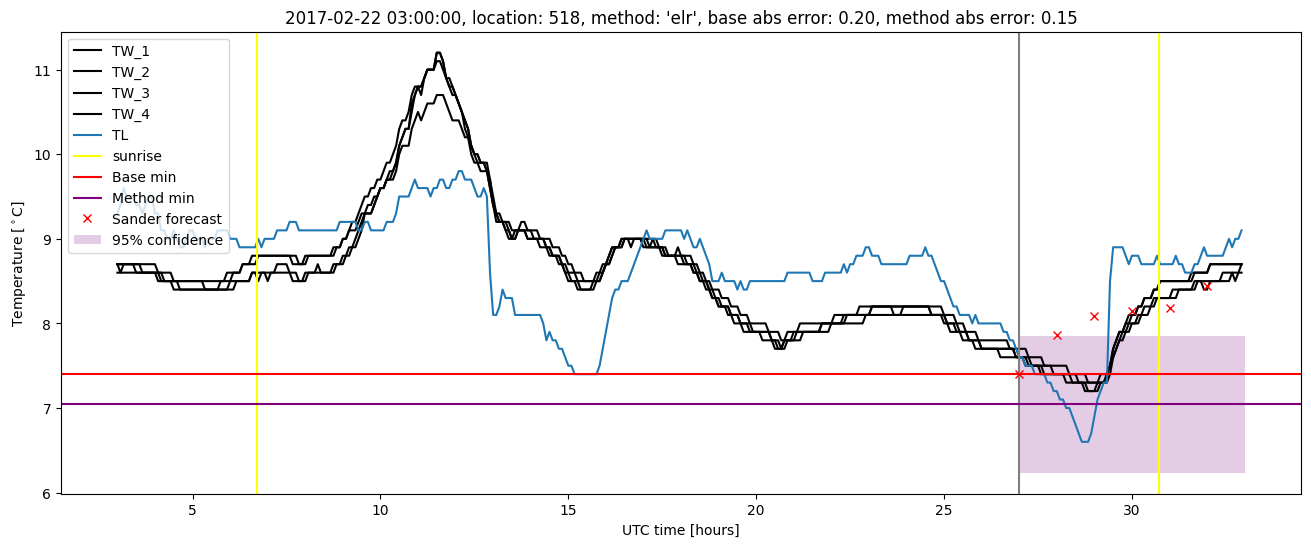
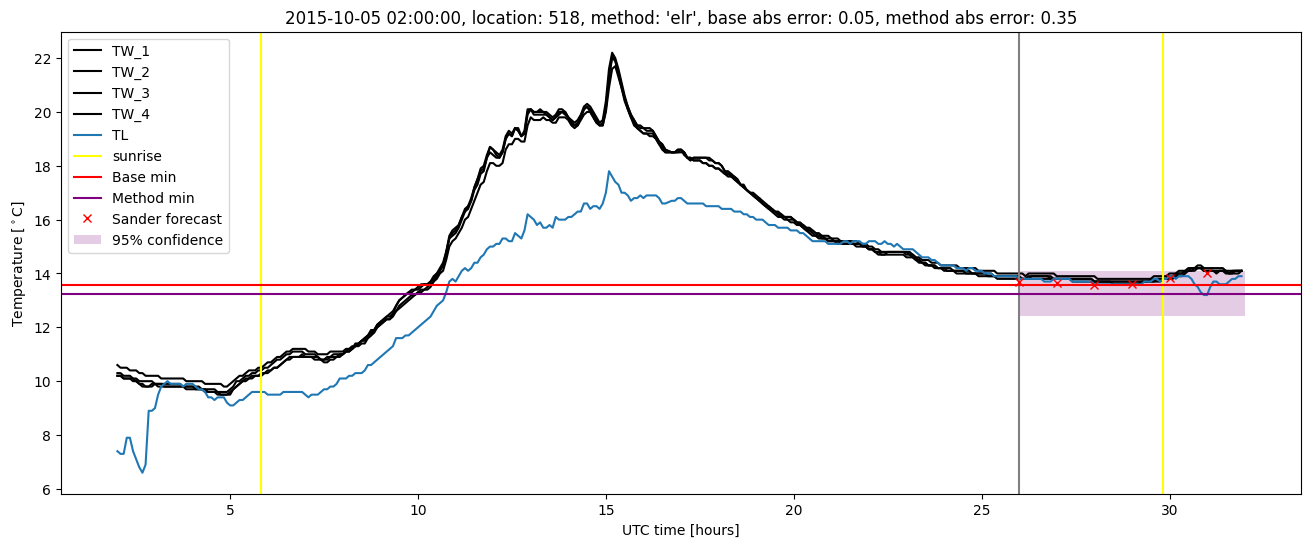
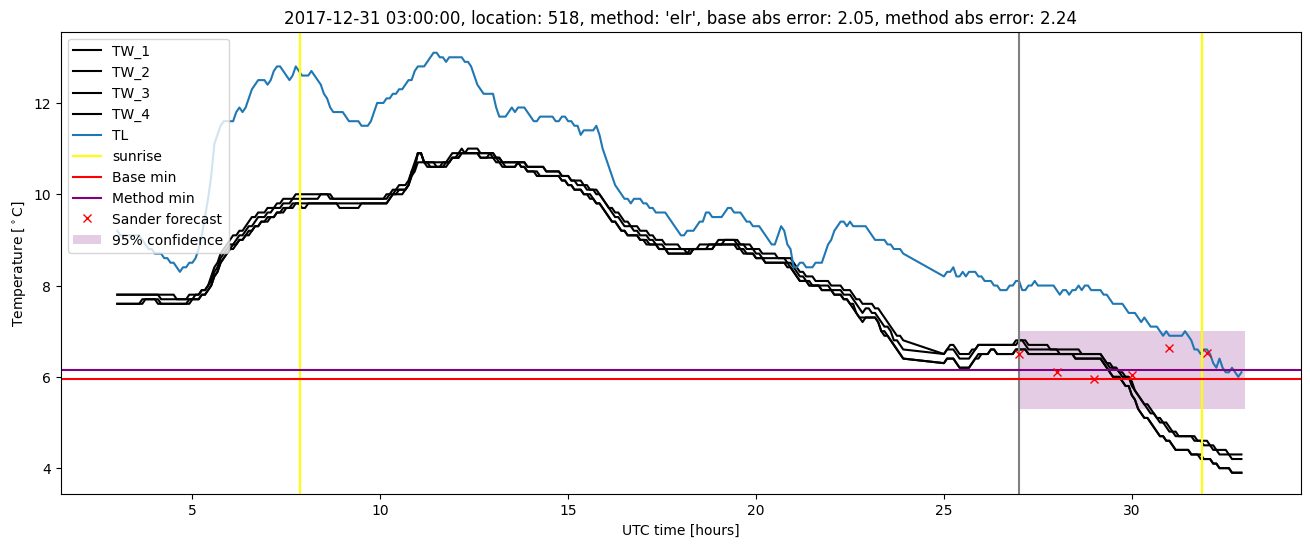
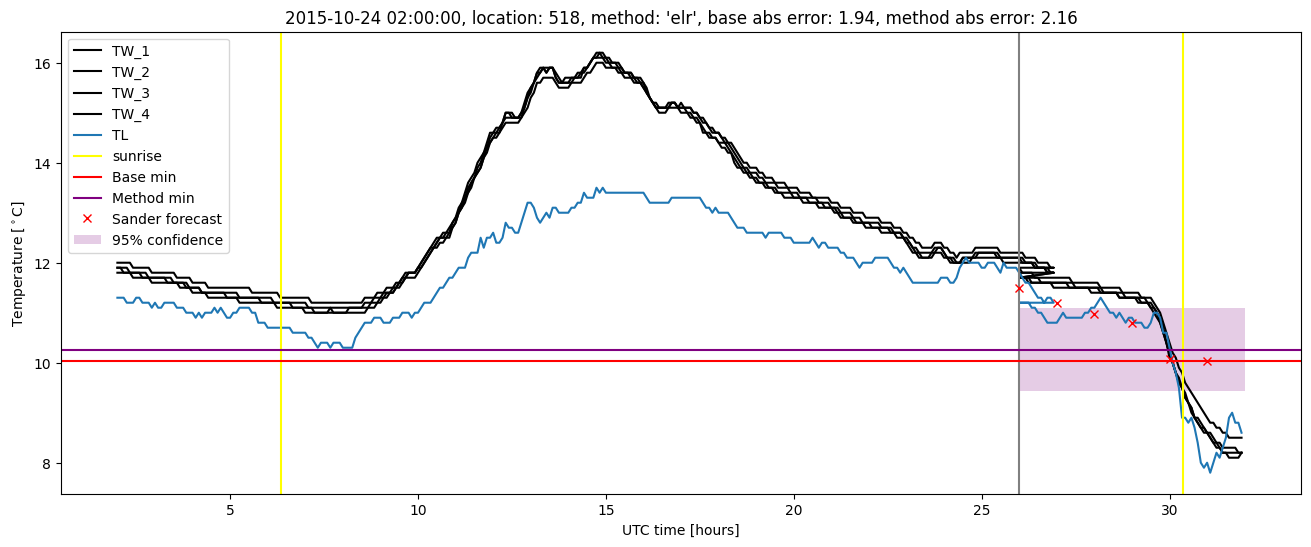
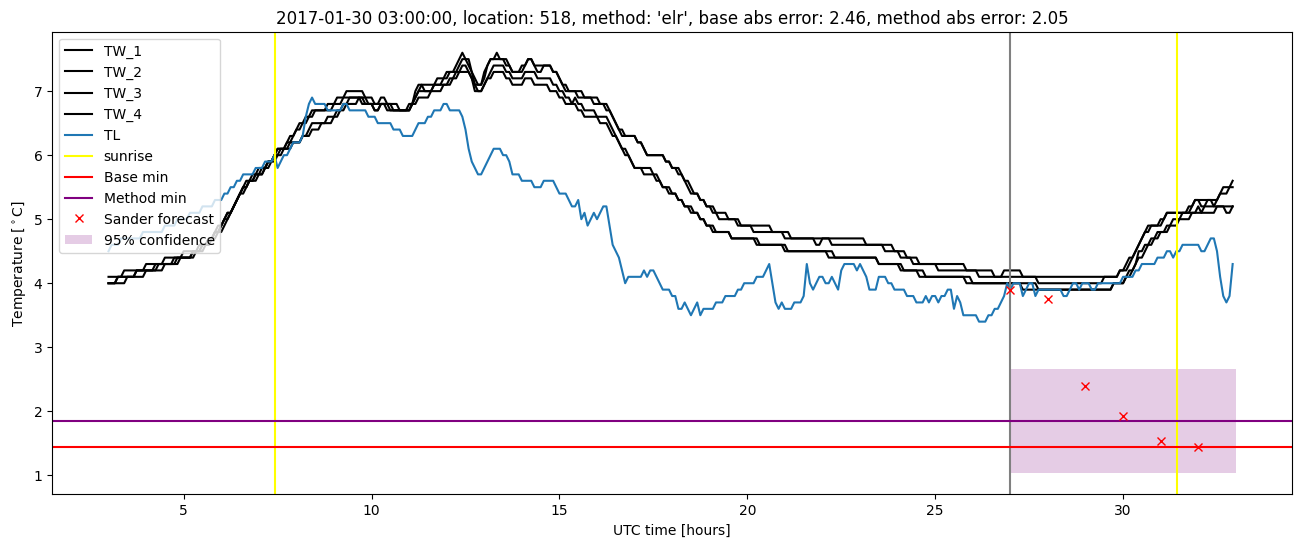
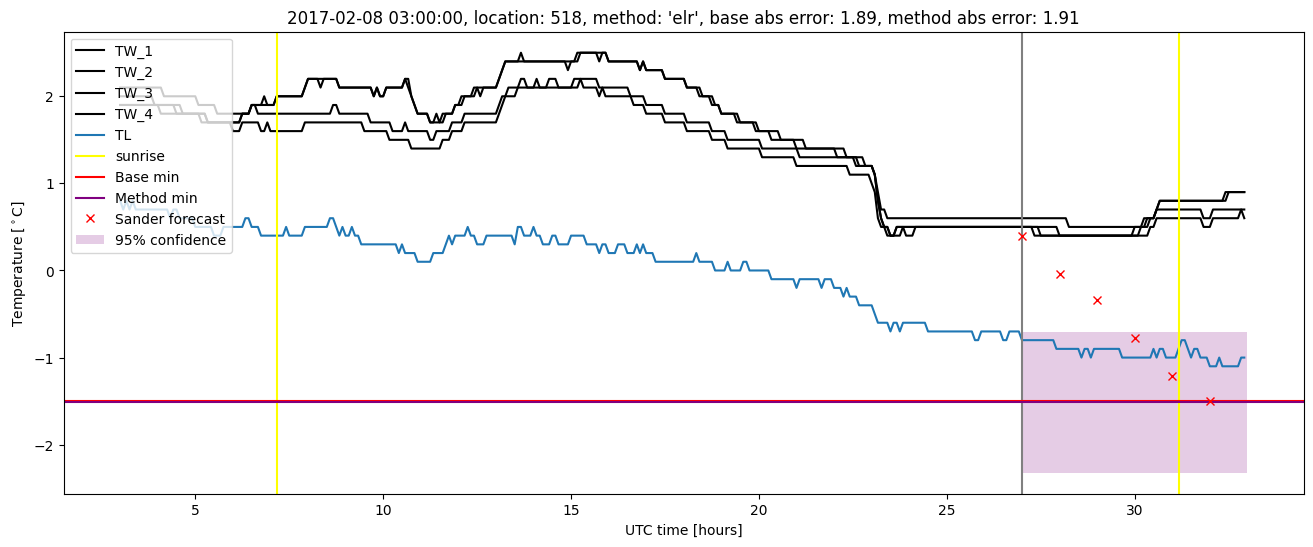
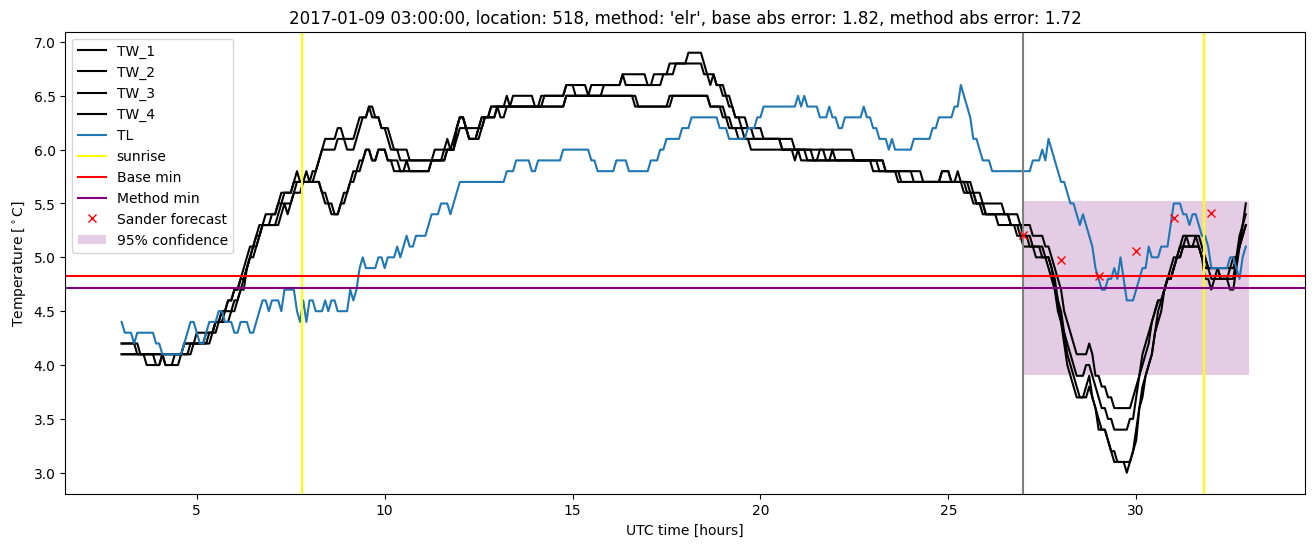
Extended logistic regression plots