GMS location: 517
Random forest results
| names |
period |
power |
significance |
meanSquareError |
absError |
maxError |
CRPS |
IGN |
| baseline |
winter 2016 |
0.978 |
0.000e+00 |
0.277 |
0.415 |
1.643 |
NaN |
NaN |
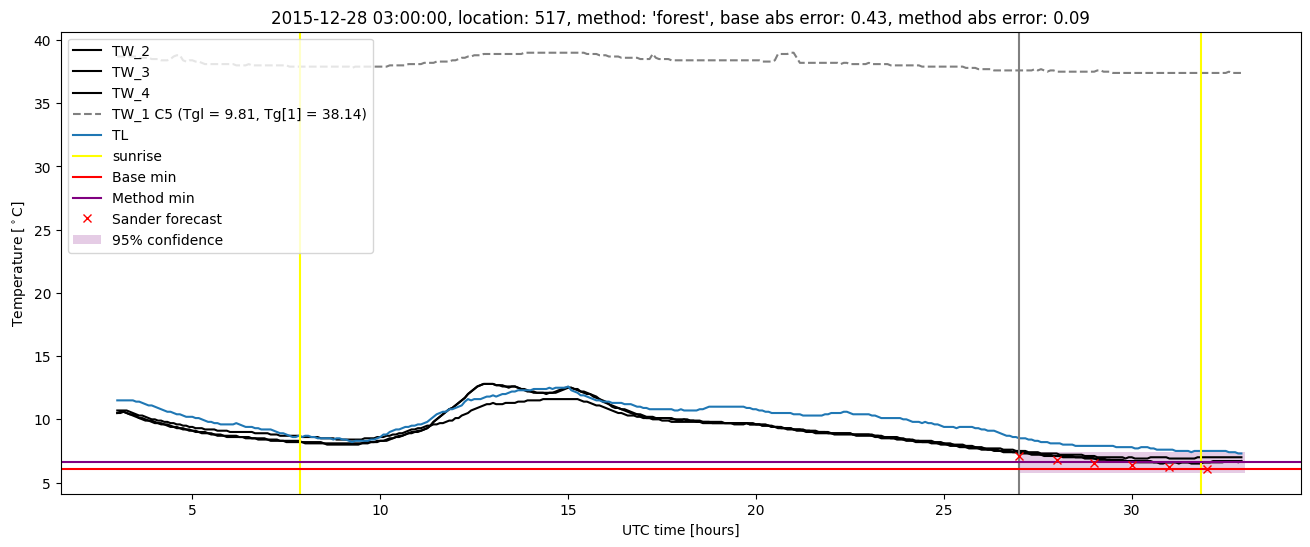
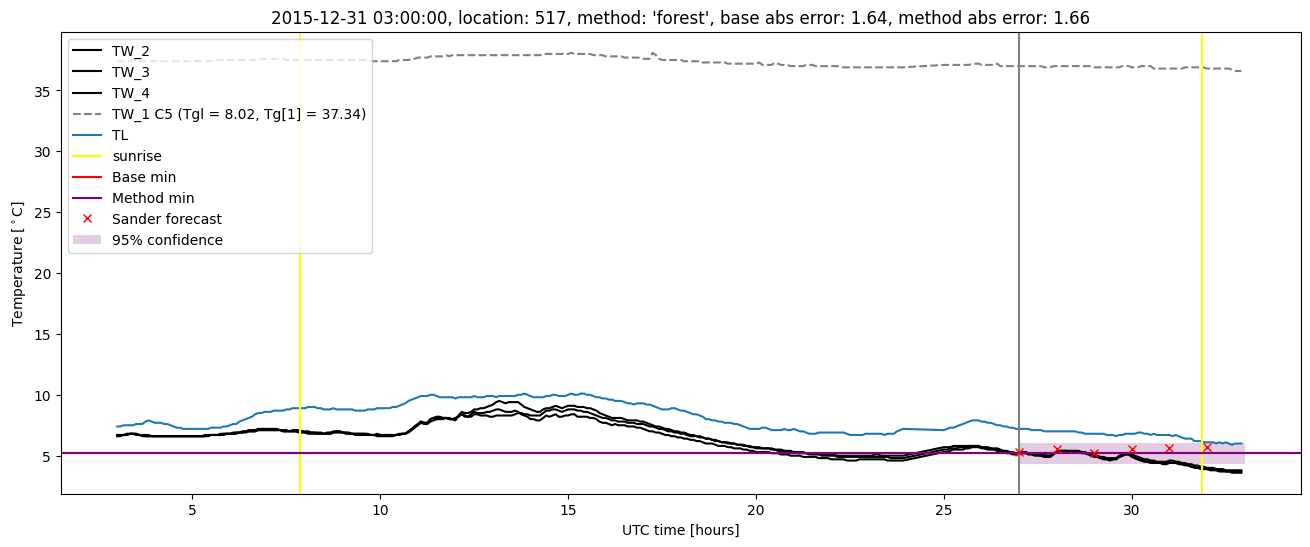
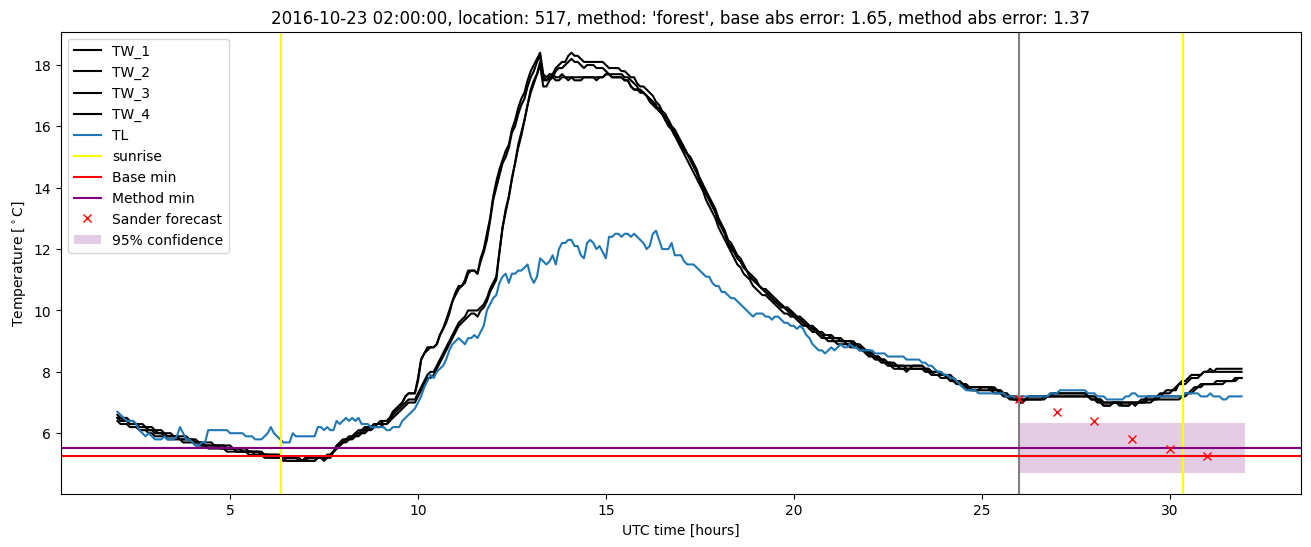
| forest |
winter 2016 |
0.994 |
0.000e+00 |
0.207 |
0.350 |
1.660 |
0.450 |
7.094 |
| baseline |
winter 2017 |
0.992 |
0.077 |
0.328 |
0.448 |
1.649 |
NaN |
NaN |
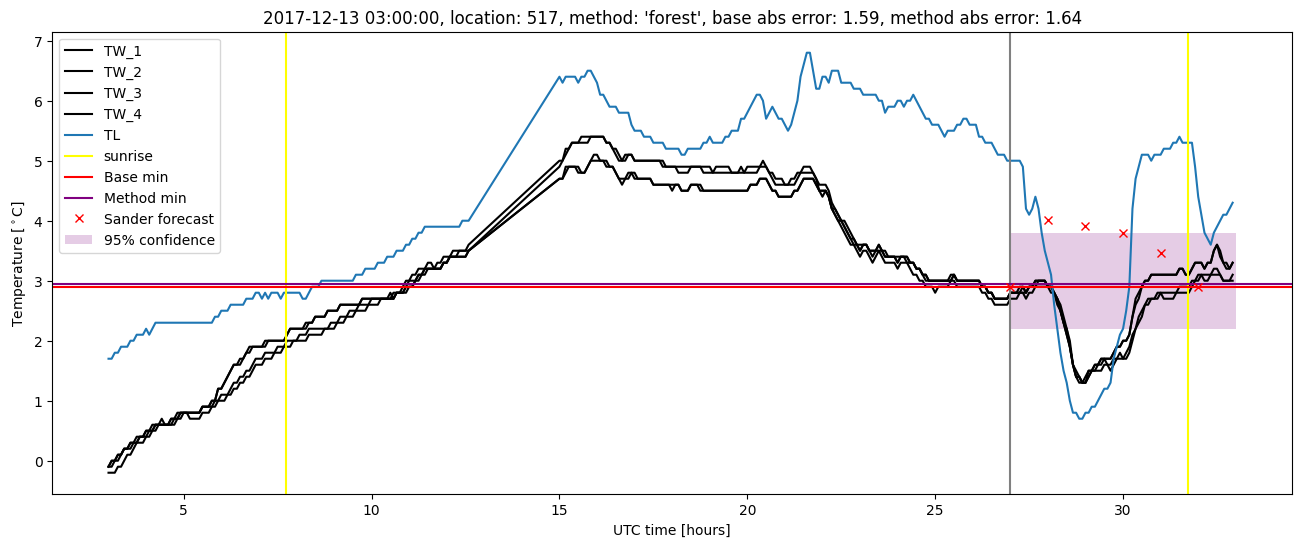
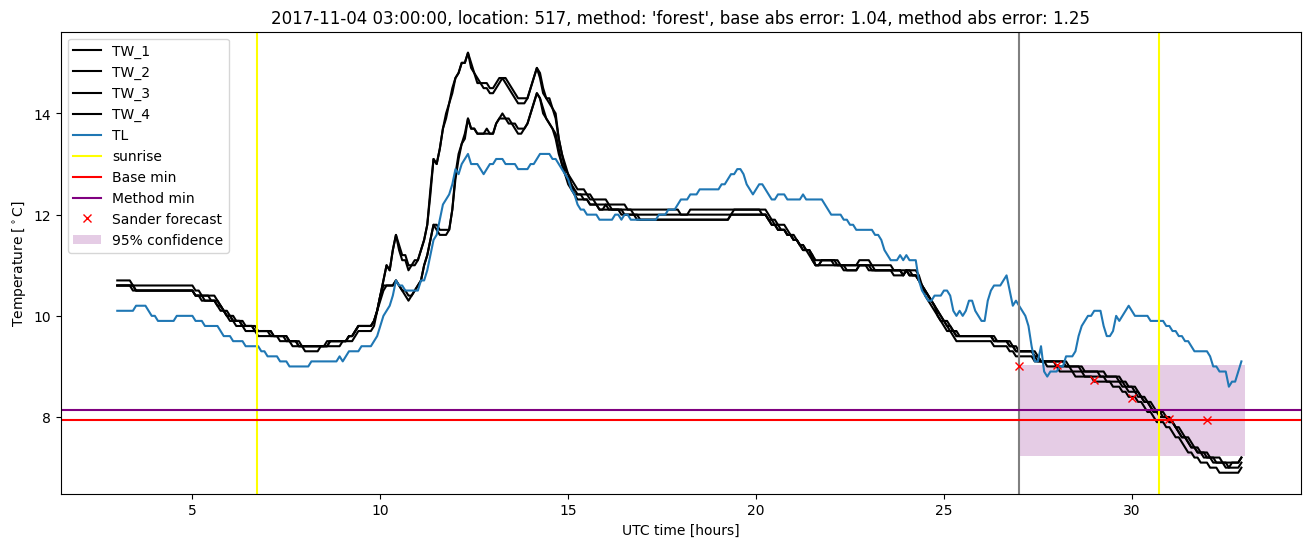
| forest |
winter 2017 |
1.000 |
0.077 |
0.191 |
0.351 |
1.372 |
0.454 |
5.775 |
| baseline |
winter 2018 |
0.993 |
0.077 |
0.270 |
0.390 |
1.591 |
NaN |
NaN |
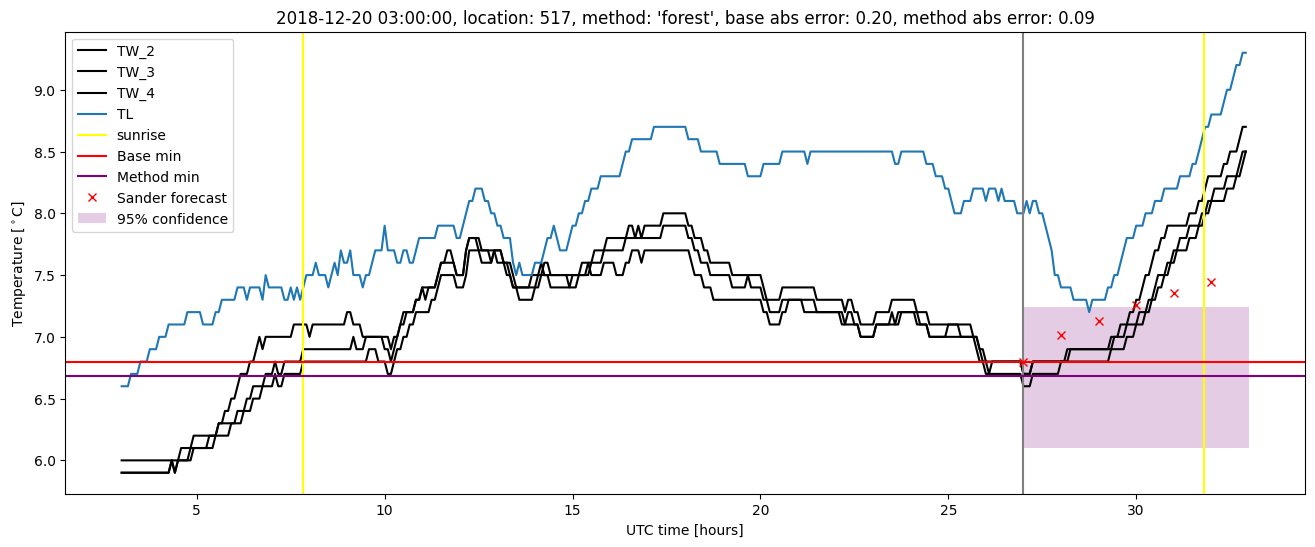
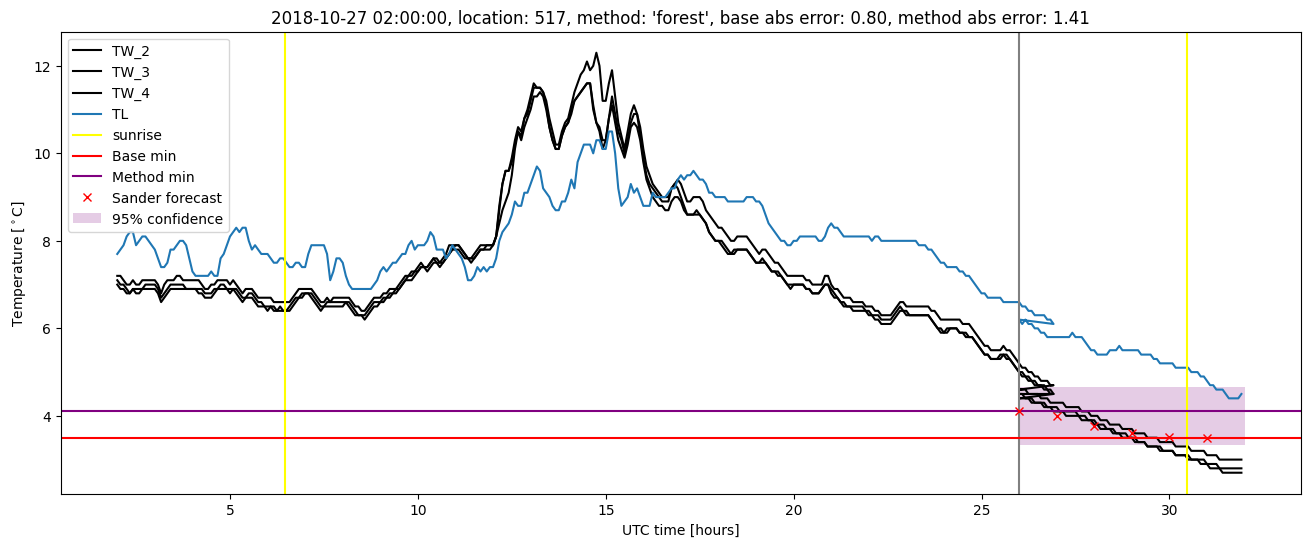
| forest |
winter 2018 |
1.000 |
0.077 |
0.210 |
0.348 |
1.641 |
0.458 |
5.275 |
| baseline |
winter 2019 |
0.986 |
0.000e+00 |
0.242 |
0.370 |
1.639 |
NaN |
NaN |
| forest |
winter 2019 |
1.000 |
0.000e+00 |
0.182 |
0.315 |
1.407 |
0.462 |
5.401 |
| baseline |
all |
0.986 |
0.055 |
0.279 |
0.406 |
1.649 |
NaN |
NaN |
| forest |
all |
0.998 |
0.055 |
0.198 |
0.342 |
1.660 |
0.456 |
5.944 |
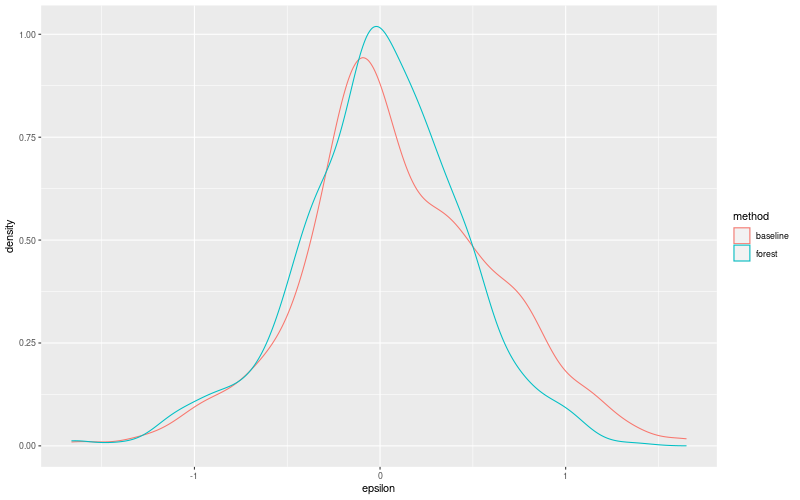
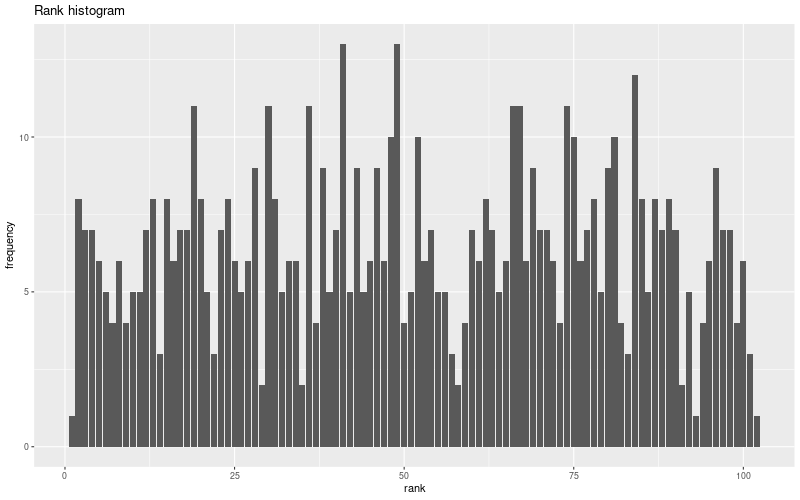
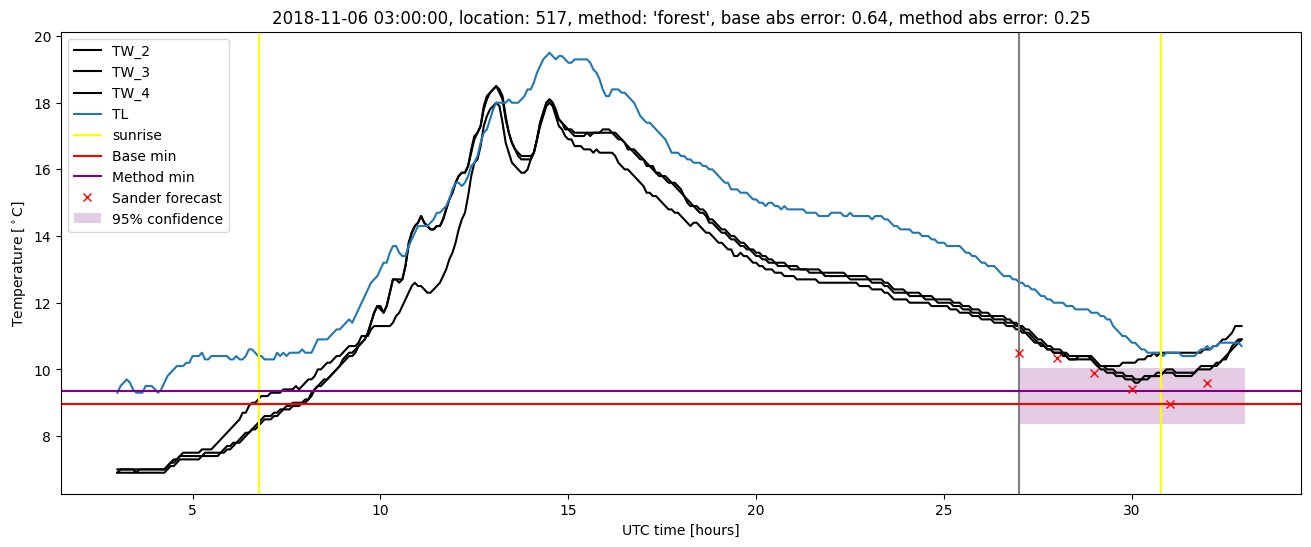
Random forest plots
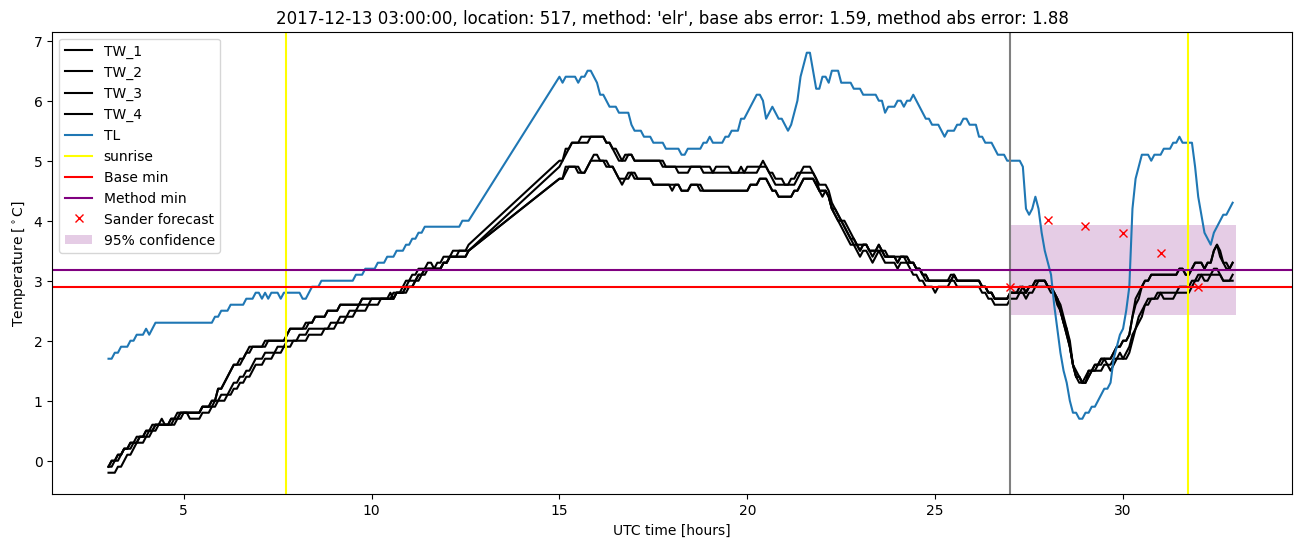
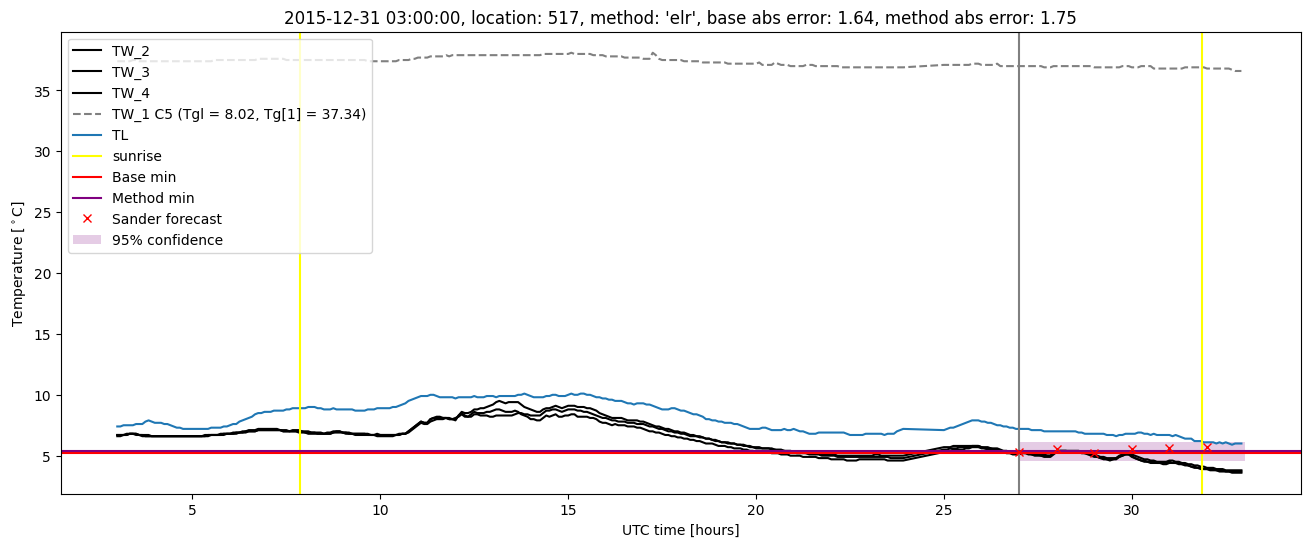
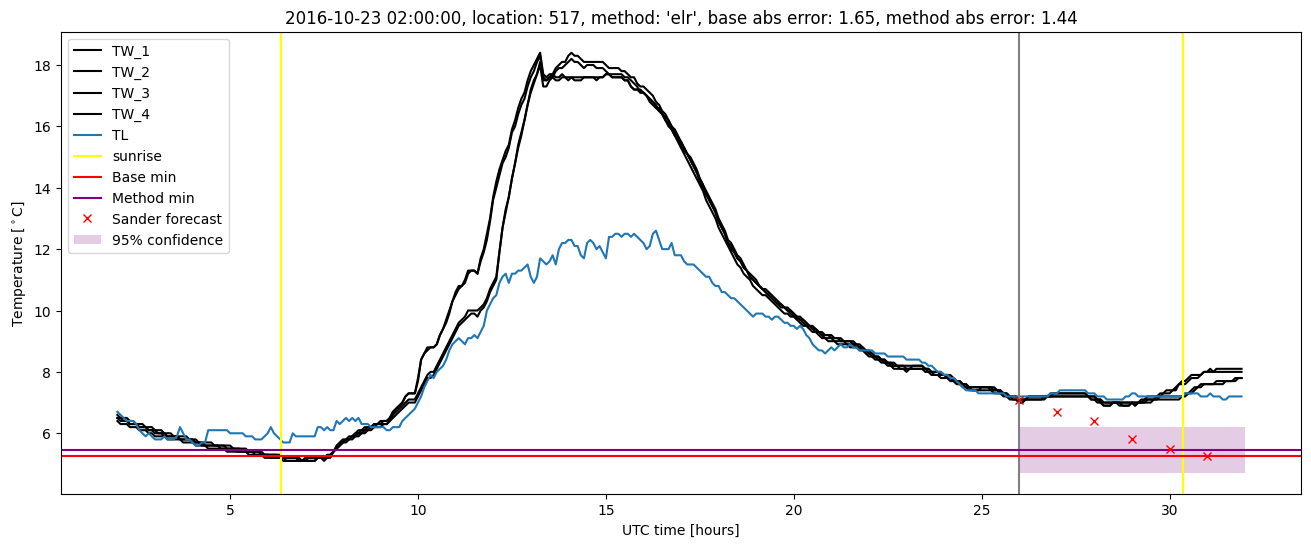
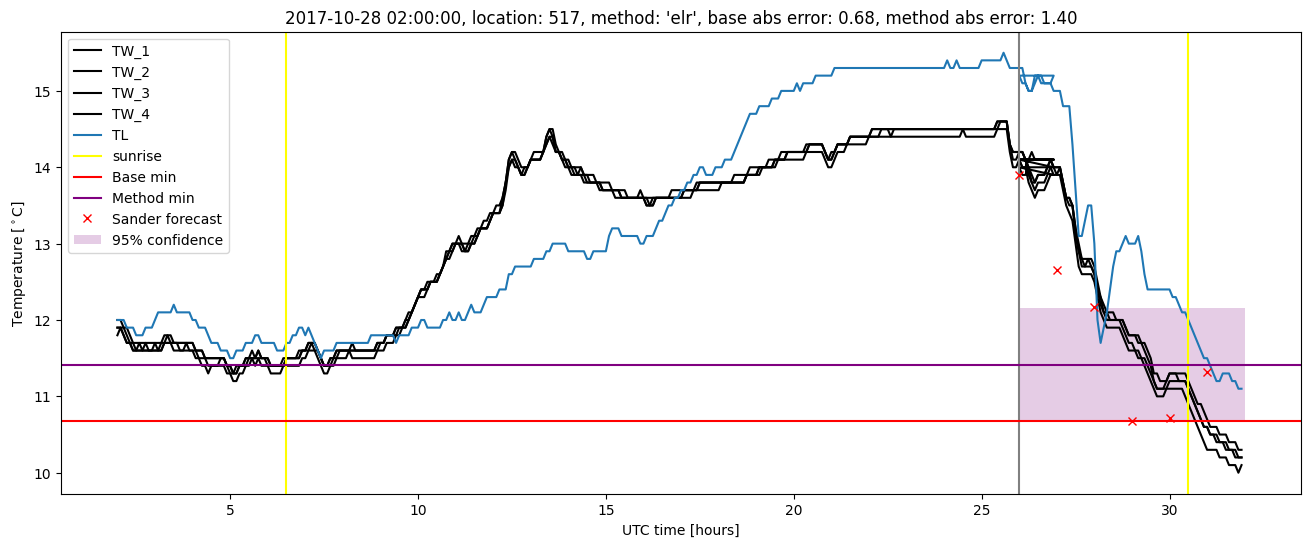
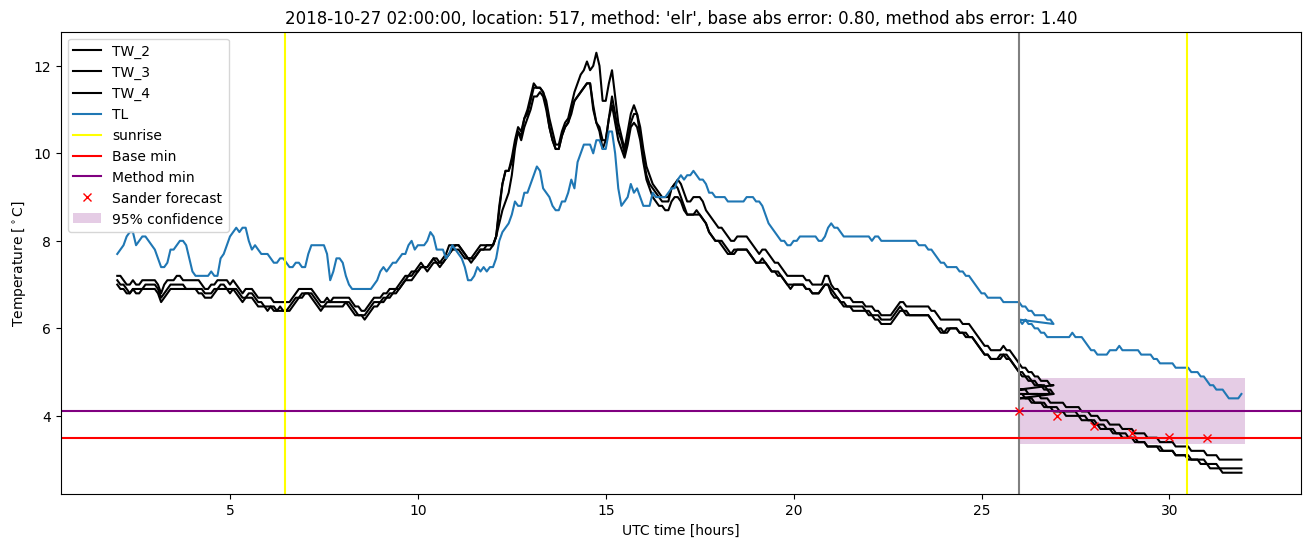
Extended logistic regression results
| names |
period |
power |
significance |
meanSquareError |
absError |
maxError |
CRPS |
IGN |
| baseline |
winter 2016 |
0.978 |
0.000e+00 |
0.277 |
0.415 |
1.643 |
NaN |
NaN |
| elr |
winter 2016 |
0.994 |
0.000e+00 |
0.223 |
0.373 |
1.754 |
0.515 |
6.950 |
| baseline |
winter 2017 |
0.992 |
0.077 |
0.328 |
0.448 |
1.649 |
NaN |
NaN |
| elr |
winter 2017 |
1.000 |
0.077 |
0.238 |
0.388 |
1.438 |
0.501 |
6.492 |
| baseline |
winter 2018 |
0.993 |
0.077 |
0.270 |
0.390 |
1.591 |
NaN |
NaN |
| elr |
winter 2018 |
0.993 |
0.038 |
0.229 |
0.361 |
1.876 |
0.515 |
6.938 |
| baseline |
winter 2019 |
0.986 |
0.000e+00 |
0.242 |
0.370 |
1.639 |
NaN |
NaN |
| elr |
winter 2019 |
1.000 |
0.000e+00 |
0.175 |
0.303 |
1.404 |
0.503 |
6.286 |
| baseline |
all |
0.986 |
0.055 |
0.279 |
0.406 |
1.649 |
NaN |
NaN |
| elr |
all |
0.997 |
0.041 |
0.217 |
0.358 |
1.876 |
0.509 |
6.693 |
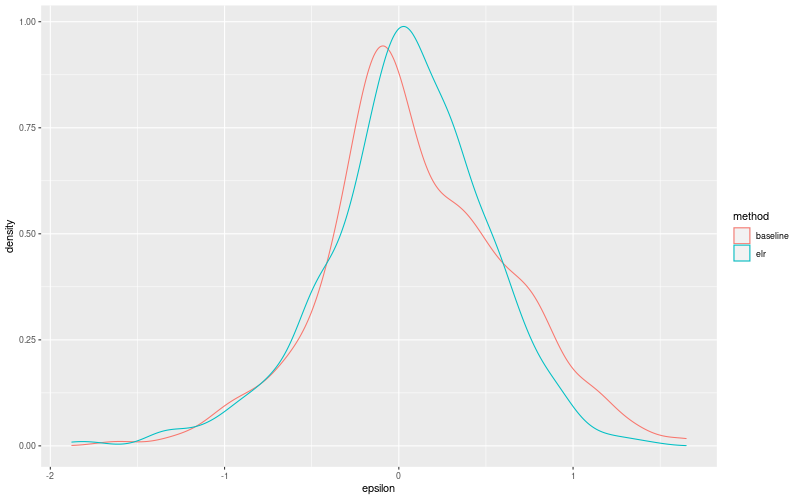
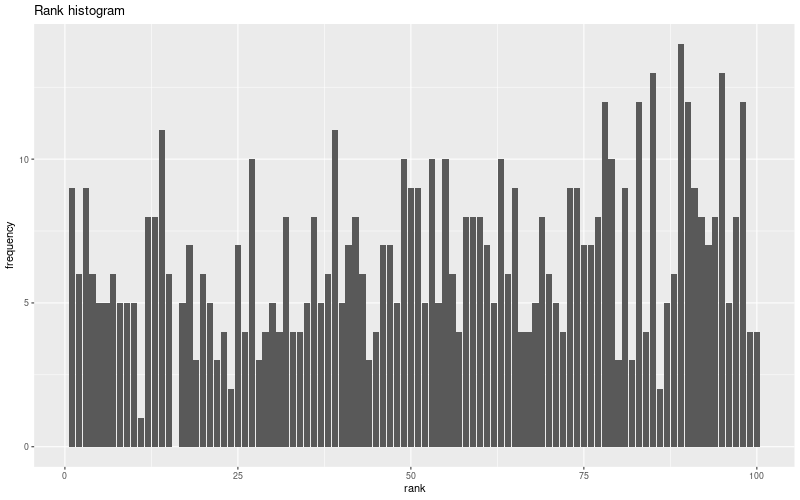
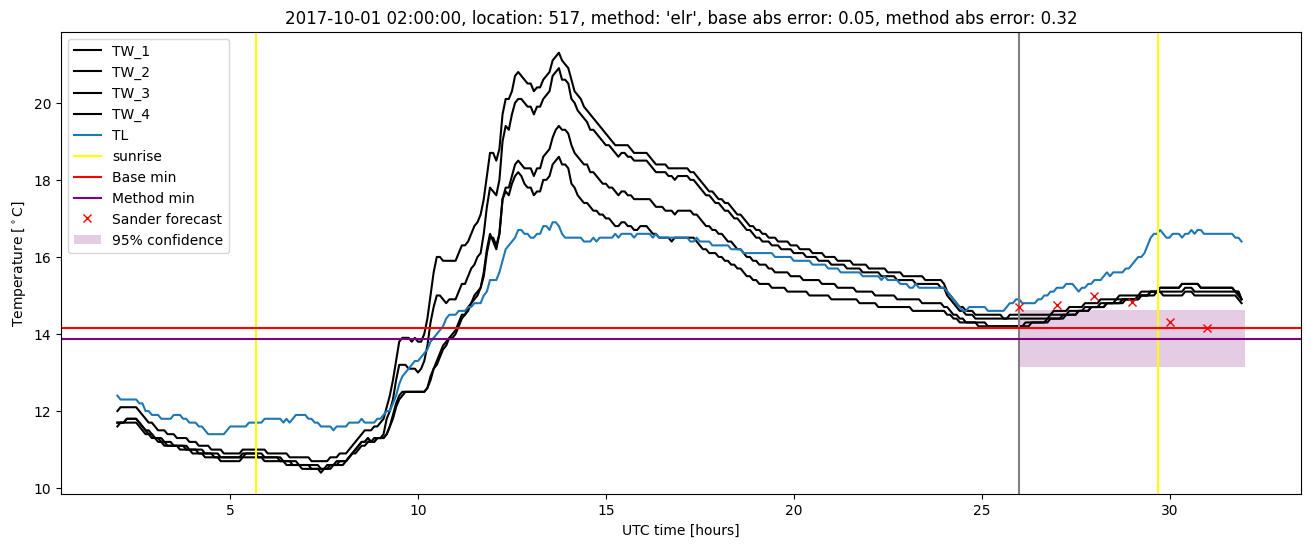
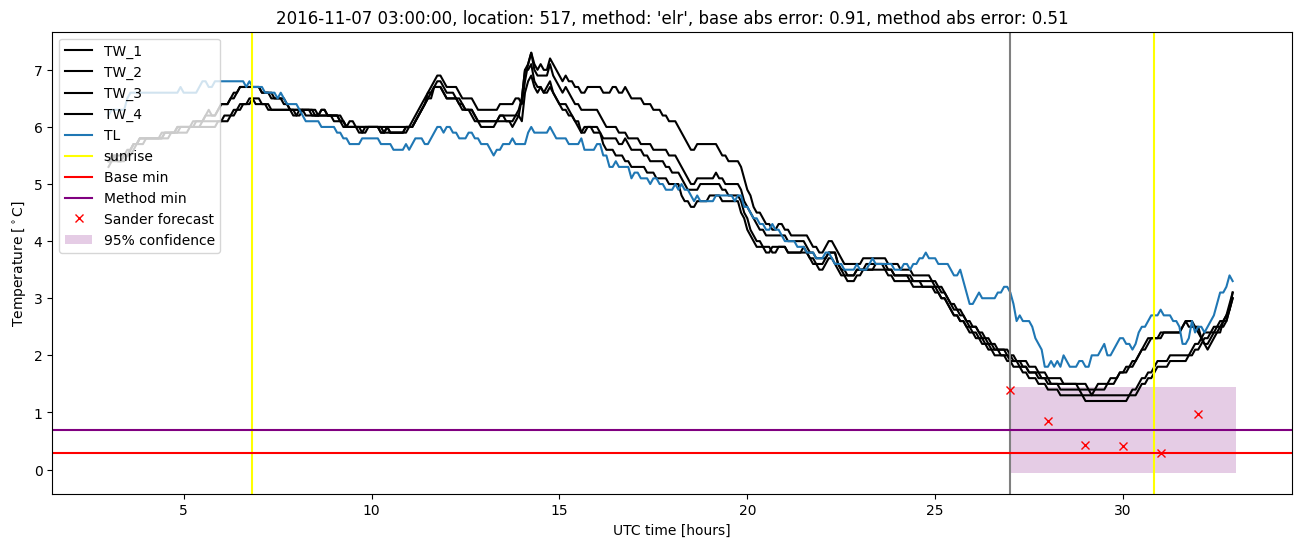
Extended logistic regression plots